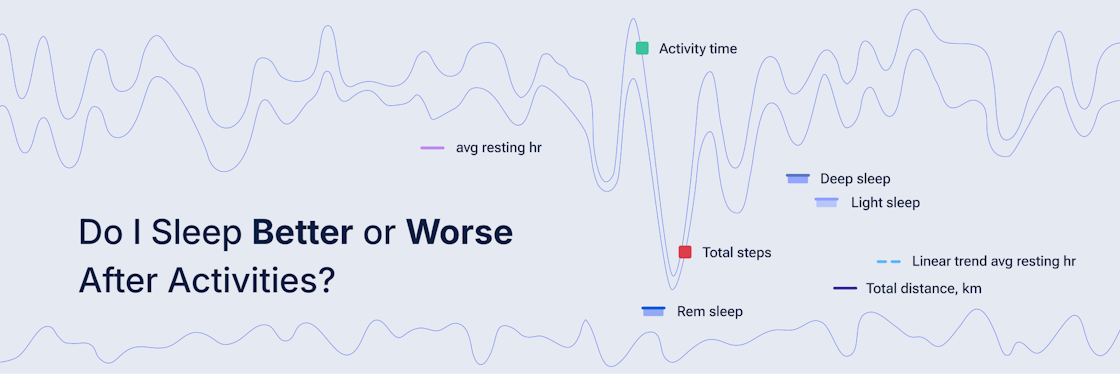
An eazyBI support consultant, Mārtiņš Vanags, does personal data experiments with Garmin, Python, and eazyBI. He imports his smartwatch data via REST APIs to test one question: does he sleep better after being active? See the reports, the setup, and the verdict.
At Atlassian Team ’26, the questions changed. From “how” to “why.” We share the six most common questions we heard at the eazyBI booth — from AI and reporting meaning to getting started — and what they reveal about where BI (and its users) are heading.
Not using Jira Service Management, but still need SLA tracking? Learn how teams use SLA PowerBox and eazyBI to track time across support, development, and delivery processes — gain visibility, spot delays, and make better decisions with reliable data.
eazyBI launched a Certification Program to empower partners with advanced analytics skills. In just one year, 11 partners achieved certification—strengthening their expertise, credibility, and growth while delivering greater value to customers. Discover their feedback.
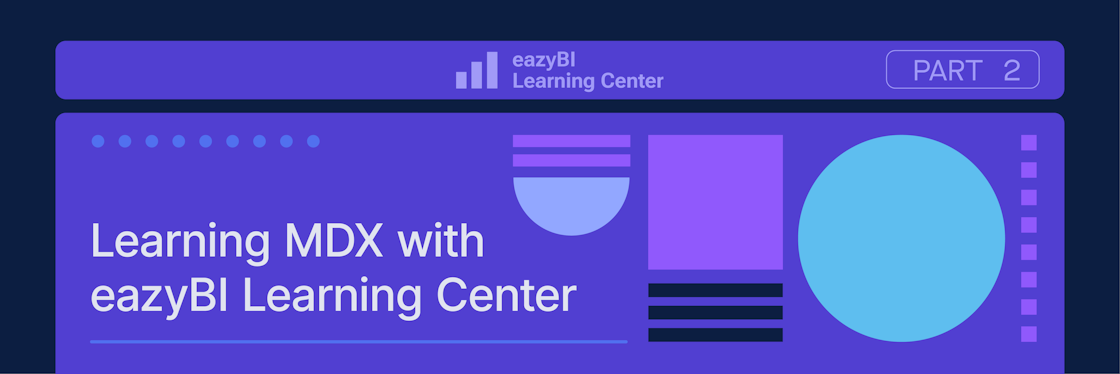
Ready to go beyond drag-and-drop in eazyBI? Learn MDX in the eazyBI Learning Center. Through 20 practical lessons, you learn calculated measures, tuples, and dimension members to build more precise, flexible Jira reports with eazyBI.
Discover the first three eazyBI Learning Center courses and learn Jira reporting step by step. Build your first reports, create charts and progress views, and explore advanced formatting — all with guided lessons and a safe Jira training sandbox.
Boubyan Bank saved over 100 hours each month by automating portfolio and project reporting with eazyBI. By replacing manual Excel work with clear, centralized dashboards, the bank improved visibility, timely delivery, and decision-making.
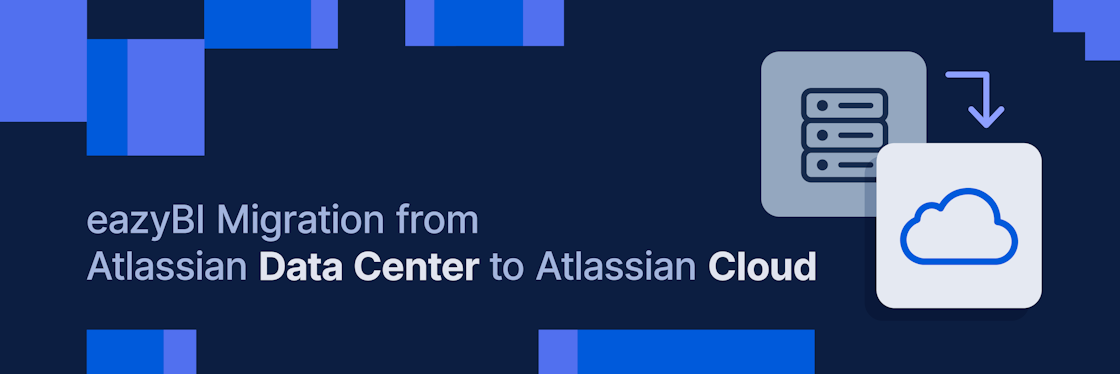
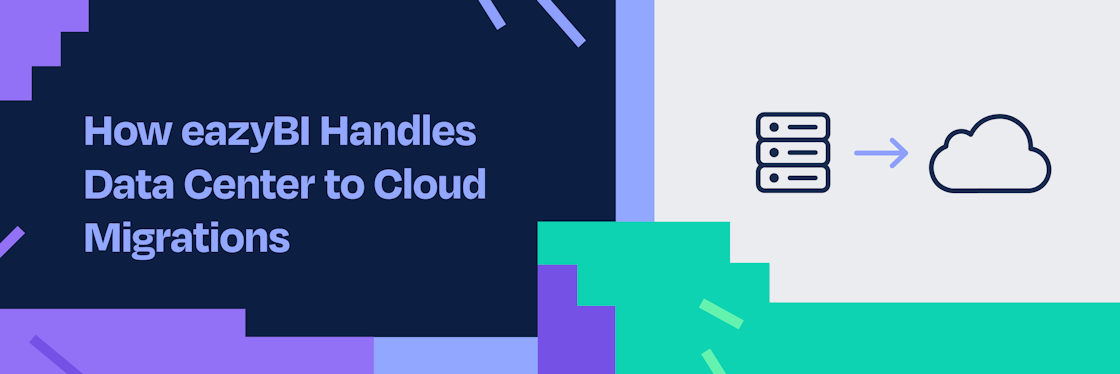
Learn how to migrate eazyBI from Atlassian Data Center to Jira Cloud. This guide covers prerequisites, the migration process, post-migration verification, and troubleshooting — plus a downloadable checklist and full webinar recording.
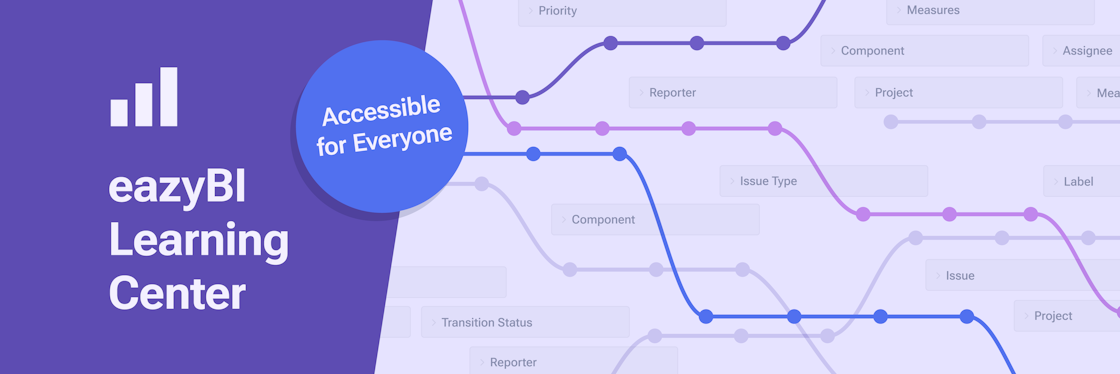
eazyBI Learning Center is your safe space to learn eazyBI – no pressure, no prior experience needed. Build reports, explore MDX, and practice in your own sandbox with step-by-step, use-case-based lessons.
AI is changing the way we build reports. At eazyBI Community Days 2025, Mindaugas shared how tools like ChatGPT and eazyBI AI Assistants help simplify MDX, debug faster, and boost reporting clarity.
AI usage at eazyBI started with curiosity, skepticism, and plenty of experiments. In this behind-the-scenes story, Gerda from the eazyBI team shares how AI Assistants evolved from early ideas into real product features – and how they continue to shape eazyBI today.
At eazyBI Community Days 2025, Juan José Marchal shared how a bank’s Jira Cloud migration exposed outdated scripted fields for linked issues. By moving the logic to eazyBI, the team achieved accurate, real-time reporting and a cleaner, more reliable deployment workflow.
Sushi café's example shows how dashboards evolve from reporting what happened to recommending what to do next. By combining descriptive, predictive, and prescriptive analytics, data becomes a decision-making partner that helps businesses plan, improve, and act smarter.
Effective Dec 1, 2025, we'll update pricing for eazyBI Reports and Charts for Jira Cloud, with a 60-day grandfathering until Jan 30, 2026. Learn about new AI features, integrations, and full pricing details in our latest update.
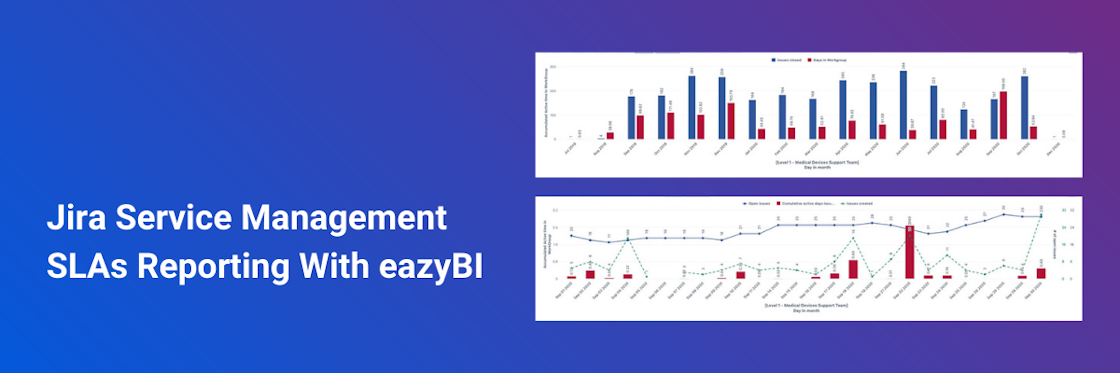
Discover how an Indonesian bank transformed complaint handling and reporting by integrating Jira Service Management with eazyBI. From replacing manual Excel reports to building automated dashboards, the solution delivered faster insights, improved SLAs, and better decisions.
From Data Center to Cloud, eazyBI migrations don’t have to be scary. With one core platform behind every version, the eazyBI Database Migrator moves your metadata, reports, and settings – not your data – so you can rebuild imports and keep reports running smoothly.
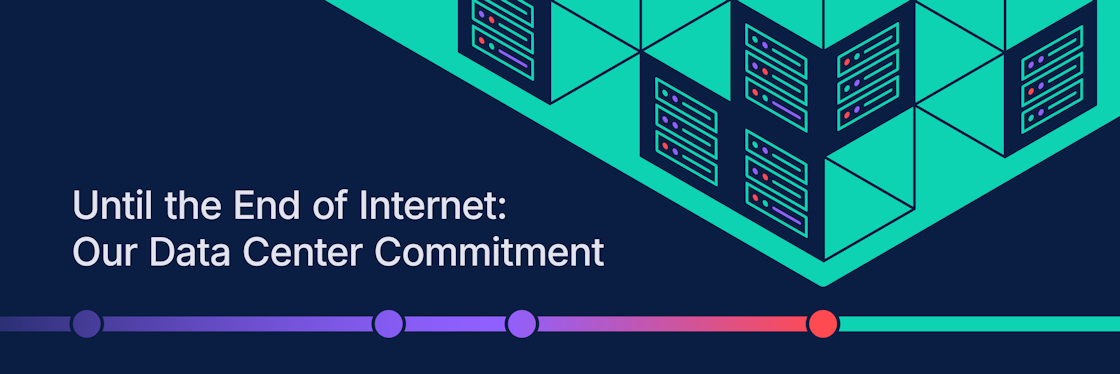
Atlassian's Data Center EOL doesn't mean the end of our support. Here's eazyBI's commitment to Data Center customers: active development and full feature parity through 2029, plus migration support to Cloud or other platforms.
Struggling to compare team performance, keep vendors accountable, or prep for DORA compliance in Jira? Discover 5 real-world reporting challenges—from SLA monitoring to out-of-process requests—and how eazyBI turns scattered Jira data into clear, actionable insights.
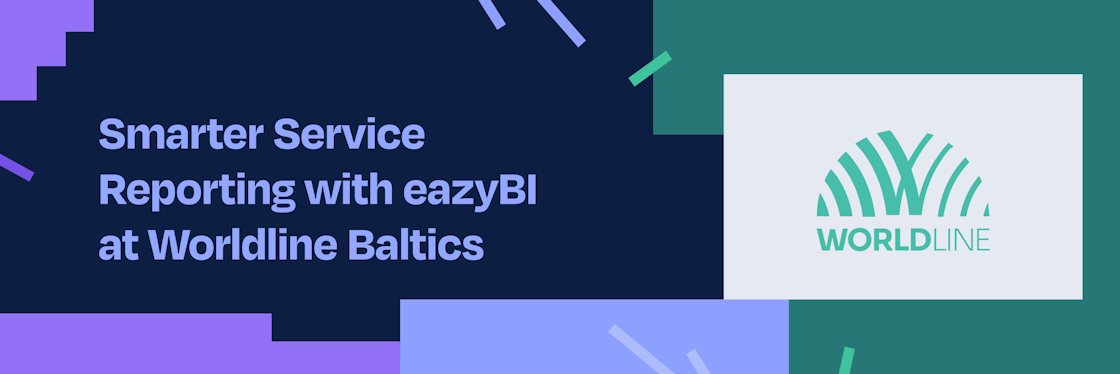
When customer complaints started piling up, Worldline Baltics realized the problem wasn’t just support—it was company-wide. Discover how 10+ years of eazyBI experience helped redesign Jira workflows, fix misleading “averages,” and rebuild trust across teams.
At eazyBI, security is built into everything we do—from SOC 2 Type II audits and our open Trust Center to bug bounty programs and continuous monitoring. Transparency and accountability are at the core of how we keep your data safe, every day.
Mercedes-Benz is renowned for its rich history and technological leadership. By combining flexibility with smart reporting, they’ve shifted from reactive firefighting to proactive steering, giving teams the visibility to spot what’s coming and act before issues escalate.
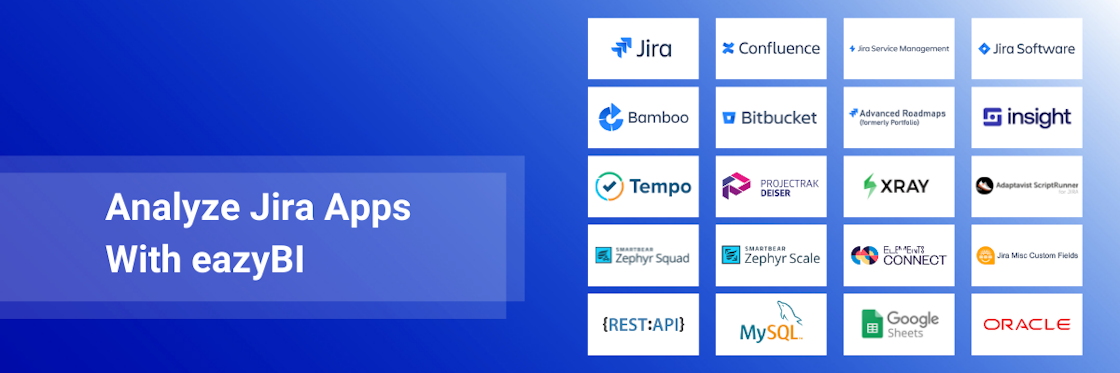
eazyBI have integrations with several testing apps in Jira. The most popular among eazyBI users is Xray Test management for Jira. Continue reading and learn how Xray data is organized in eazyBI and explore Xray report samples built with eazyBI.
Whether you're just starting out or looking to deepen your eazyBI expertise, this guide walks you through the essential steps and tips to elevate your eazyBI knowledge and create impactful dashboards and reports.
Discover how Elements Connect and eazyBI streamline workflows by unifying external data with Jira for better decision-making. Elements Connect integrates external data into Jira, while eazyBI creates actionable dashboards and reports.
Picking the right tool can make data analysis easier and more effective. For Jira reporting, two popular choices often come up: Power BI and eazyBI. While both are powerful business intelligence tools, they cater to different needs and user skills.
The BeyondTeam24 European Edition Tour united eazyBI, Elements, Refined, and Resolution across 13 cities in 6 countries. Over 4 weeks, they showcased shared case studies, and built partnerships, fostering collaboration, innovation, and connections in the Atlassian ecosystem.
eazyBI is a powerful tool for turning raw data into reports, and now it's even better with AI Assistants. Whether building reports, exploring measures, or using MDX, AI helpers simplify learning and maximize your data’s value. Here are 3 ways they can elevate your eazyBI skills!
A Program Increment (PI) dashboard is essential for the teams working in SAFe for planning, tracking, and analyzing their work. Discover how to analyze Program Increment data and issue dependancies from Easy Agile Programs app using eazyBI reports and dashboards.
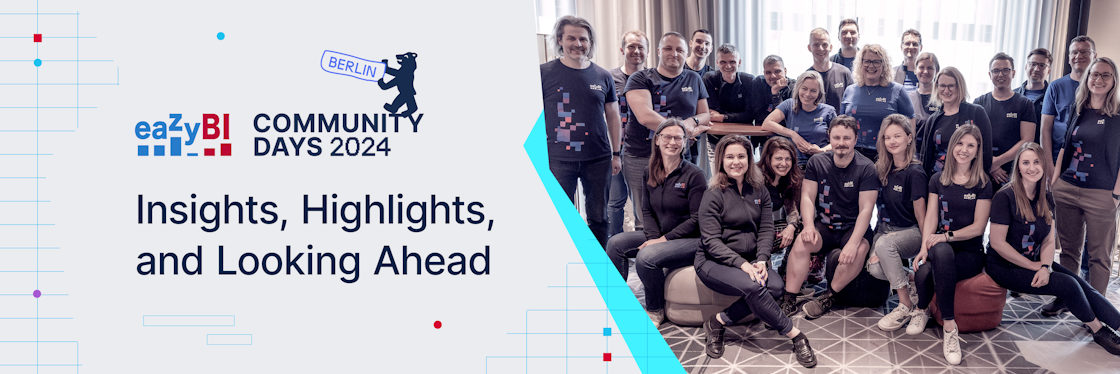
eazyBI Community Days a remarkable event for our customers and us, the eazyBI team. We can share our knowledge and gather instant feedback, and customers can learn from the source and shape the product’s future. Let's wrap up the takeaways and see what's next!
During eazyBI Community Days 2024, Stefan Krooshof, a passionate Atlassian expert from Prepend with eight years of using eazyBI, shared his experience building and using various control charts to ensure data integrity and reliability.
Highlights of the eazyBI, easyAgile, Refined, and Resolution partners tour across the USA and Canada, visiting six partners in five different cities. Presenting two mutual case studies at ACEs and panel discussions on key Atlassian Team 24 announcements.
We are launching AI assistants to help our users to make complex things easier. Read more about new assistants for report building, MDX calculation formulas and custom field JavaScript code.
eazyBI app has always been on Cloud—eazyBI Reports and Charts for Jira was the first Atlassian Connect app to launch in September 2013, and this year only reinforced the focus on Cloud solutions.
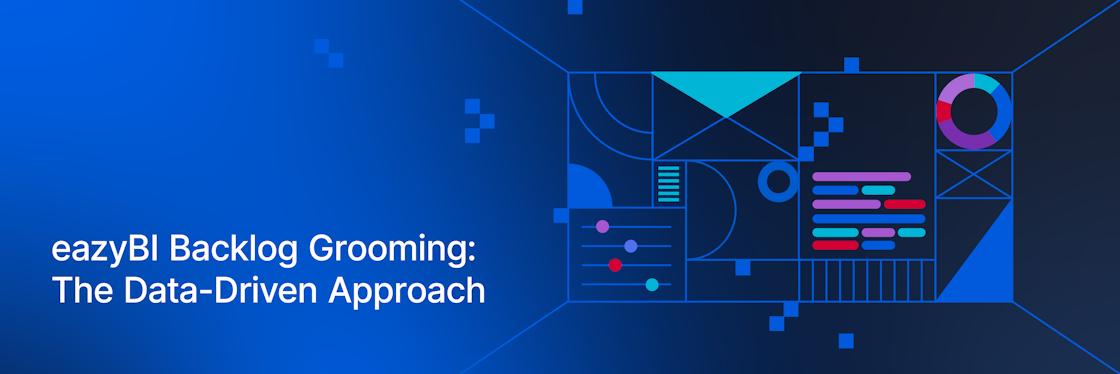
eazyBI app is constantly evolving. The goal is always to ensure the product stays relevant and valuable for you—the eazyBI user. Let's peek behind the scenes and see how we at eazyBI analyze the backlog using our favorite data analysis tool—eazyBI!
We're thrilled to announce that eazyBI is a proud sponsor at the Atlassian Team '24 event in Las Vegas! This premier gathering of the Atlassian community is shaping up to be an unforgettable celebration of collaboration, innovation, and the immense power of teamwork.
eazyBI is a scalable, powerful, and enterprise-ready business intelligence tool, for small businesses and large enterprises. Unlock its full potential with eazyBI partners' expertise. Explore the Top 10 benefits for customers leveraging these services.
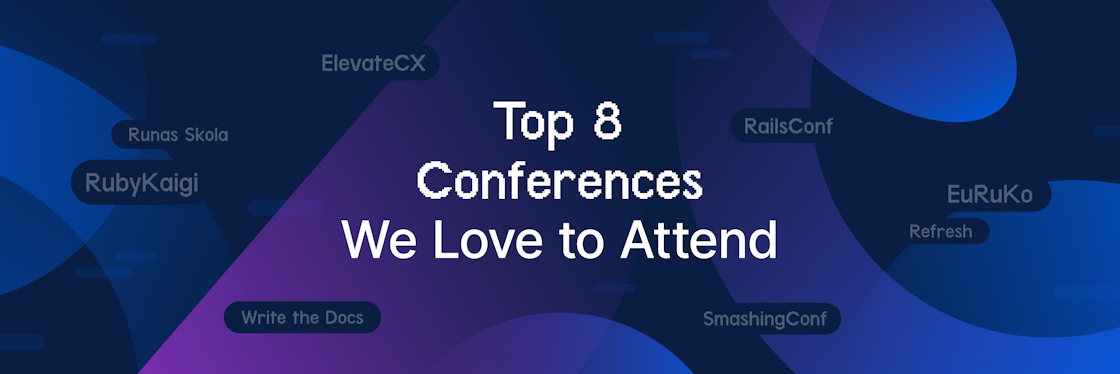
All eazyBI employees are eager to attend different conferences and seminars, as they inspire us and shape our knowledge. To inspire you, we share a list of eight conferences and seminars we have loved and would probably attend again.
During summer, lots of Latvians prepare jams and winter stock to last through the winter. Jānis Baiža, one of the most experienced eazyBI developers, takes it a step further by saving solar energy to use in the darker seasons. Find out what's eazyBI role in that.
Jānis Vītums, the first employee who joined eazyBI founder Raimonds, marked his 10th year at the company. While he enjoys working from home, cultural fit with the company’s values is the main reason why he is still here. Actually, Jānis himself is a part of eazyBI culture.
Meet Ray and Di, our eazyBi comic-style cats, who have embarked on a mission to find a new roommate using the power eazyBI. Their decision-making process is strictly data-driven; however, when it comes to the decision itself, your heart has a say.
eazyBI will participate in several Atlassian and partner events this autumn! Join us to gain new data-analysis insights, meet experts, influence eazyBI features, and connect with peers.
Experience the enhanced power of data analysis with eazyBI 7.0, featuring new capabilities like conditional alerts, custom time hierarchies, and integration with ClickHouse for boosted performance. Enjoy the convenience of alerts and reports right in your inbox.
Join eazyBI Community Days 2023 in Riga, Latvia for innovative sessions, customer stories, hands-on training, and networking with experts. Can't attend in person? Join online. Follow #eCD23 for updates. Register now and join the eazyBI community!
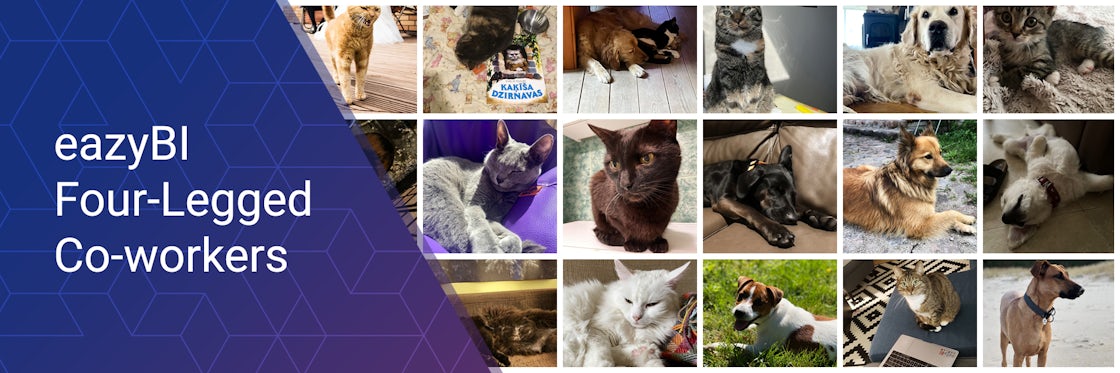
In eazyBI, we like to import not-job-related information into our app to analyze data just for fun. So we have gathered information about our four-legged back office. Also we have create a report to help you choose your ideal dog breed.
Software security has been my personal interest since the early days of web development thirty years ago. Many years later, when starting eazyBI, security was one of our key priorities. It was a natural next step in our security journey to become a SOC 2 compliant organization.
What is the Jira Sprint Report, and how to use agile reporting in Jira for better team collaboration, project management, and productivity? Learn more about types of jira reports.
Gantt charts have been around since the 1890s and is still used today. The Gantt chart is popular because it is easy to understand, helps people work together, and shows the big picture. It’s a visual tool for keeping track of a project’s tasks, deadlines, and dependencies.
Jira is an indispensable workflow management tool helping with planning and tracking. How can you unlock its full potential? This article provides an overview of Jira reporting. Advantages, disadvantages, and best practices on using built-in and external Jira reporting solutions.
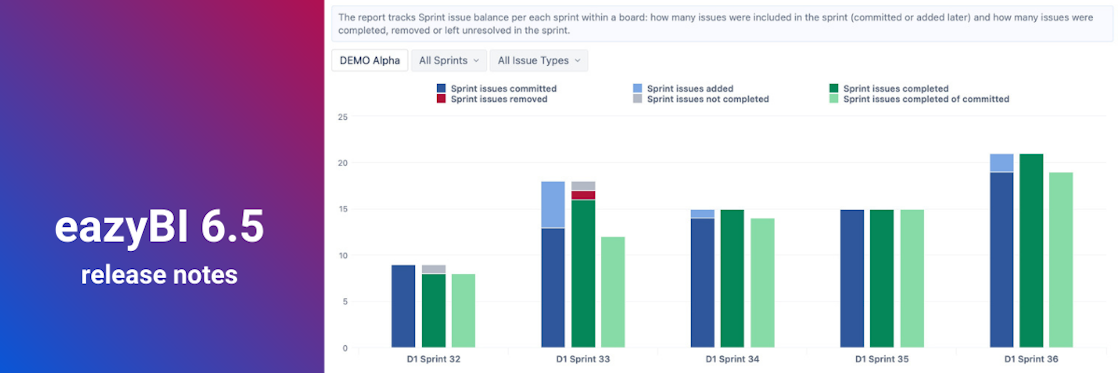
At eazyBI, we have the principle of deploying new features as soon as possible. Cloud customers have already enjoyed some of the recent greatness, and finally, we released it in eazyBI version 6.5.
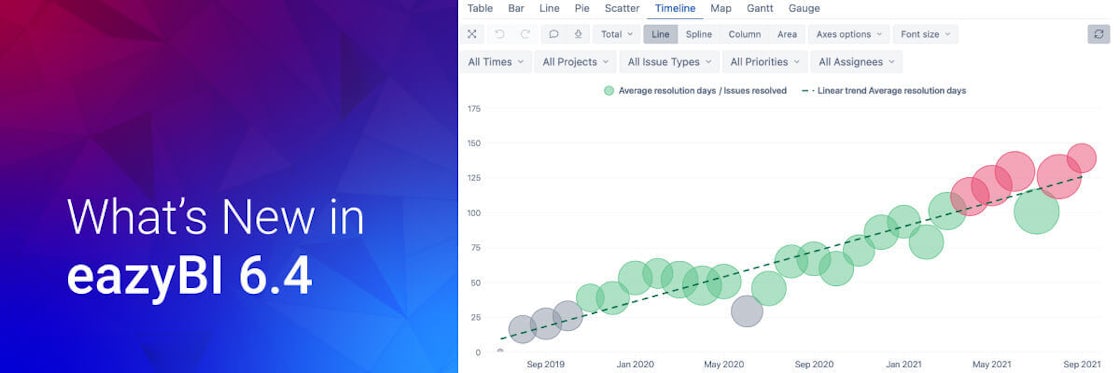
eazyBI version 6.4 is released. From small user-interface improvements to conditional chart formatting. New Sprint and Issue type hierarchies, and the ability to create your own custom hierarchies from Jira custom fields. We are happy to share with you what's new.
Occasionally I work with clients who use Jira and who would like to leverage Microsoft Power BI as a business intelligence tool for Jira data analysis. What to look at before choosing the Jira reporting tool? How do eazyBI and Power BI differ when it comes to Jira reporting?
eazyBI Reports and Charts for Confluence app was relaunched in October 2019. Since then besides eazyBI for Jira report publishing on Confluence pages, you can analyze Confluence data–page updates and views, search queries, attachment size, task completion, and more.
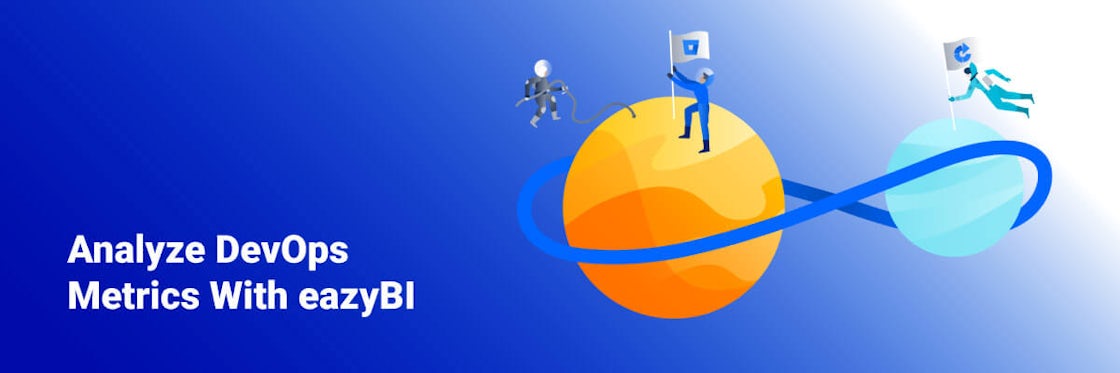
Atlassian is a rich ecosystem with native and 3rd party apps covering almost every aspect of DevOps lifecycle. Analyze and visualize Jira and many popular Jira apps–all in one place with eazyBI. Find out how to extend your Jira reporting perspective with eazyBI.
Starting from the eazyBI version 6.2, Insight is also available in Jira Cloud. You can add an additional "layer" of data in your Jira reports by adding Insight custom fields, Insight objects, object attributes, and relationships.
In our team, I might be the last person involved in eazyBI product development. That gives me another perspective–to see behind the everyday business. We don’t just build a great Business Intelligence tool; we bring many other gifts to this world.
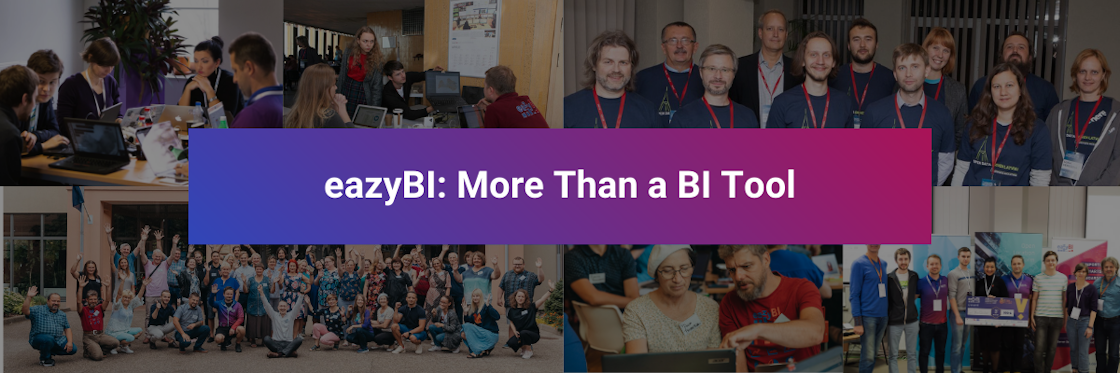
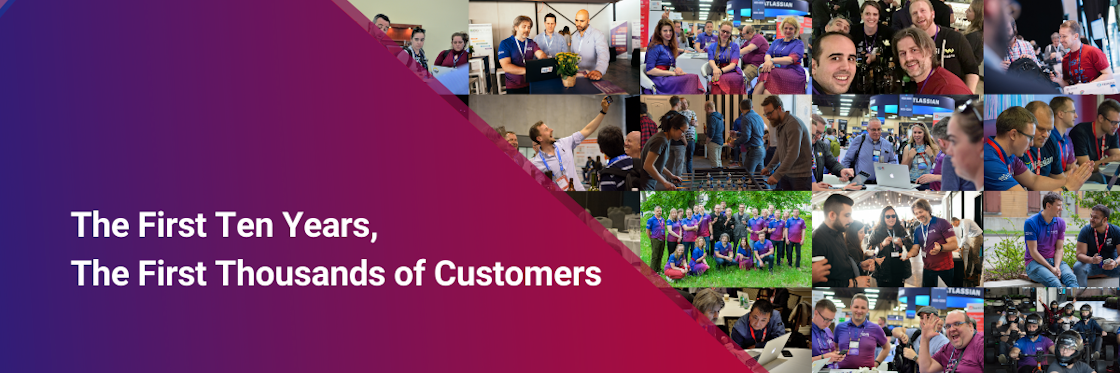
eazyBI as a company is turning ten years old today. Unfortunately, we cannot make big parties during this weird time. But we can reflect on what have we achieved, what has changed, and what has remained the same.
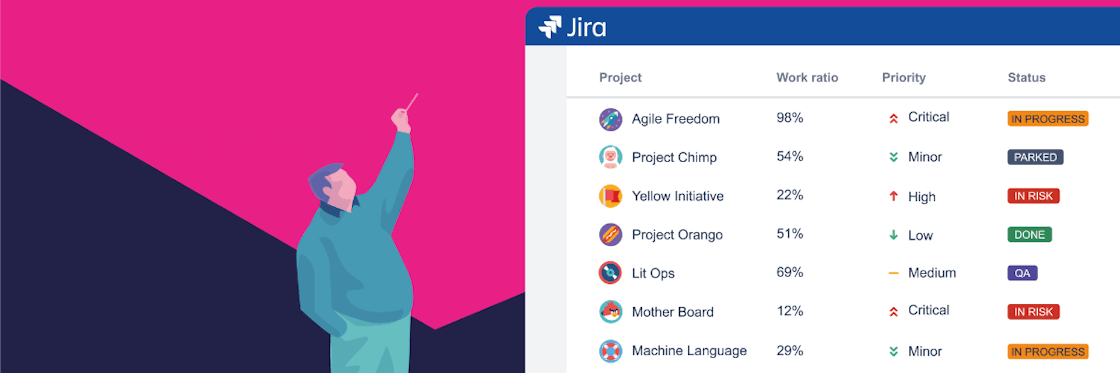
Custom Jira Reports: Build useful custom Jira reports with eazyBI in minutes. Learn how to create custom reports in Jira with eazyBI. You don’t need to be a programmer, an IT graduate, or a data analyst. Try it out.
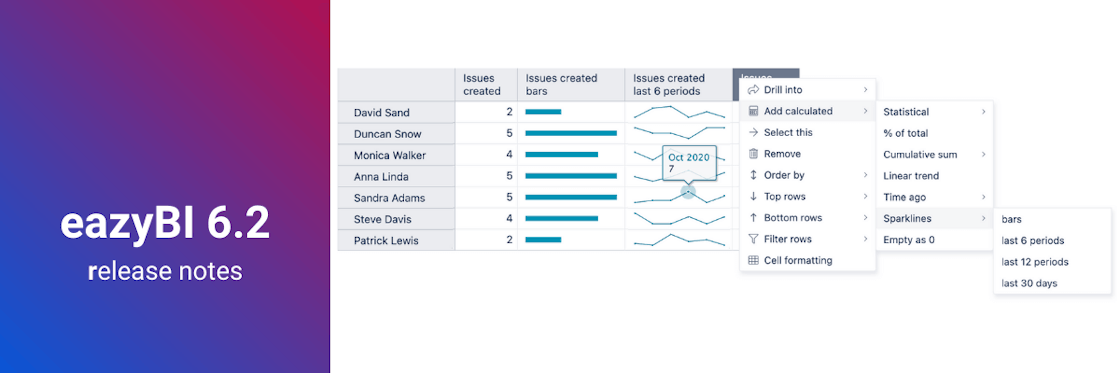
If you want to highlight a point or find a pattern, some visual aid helps a great deal. The latest eazyBI release includes several improvements for the table and gauge charts that will help you read your data so much easier.
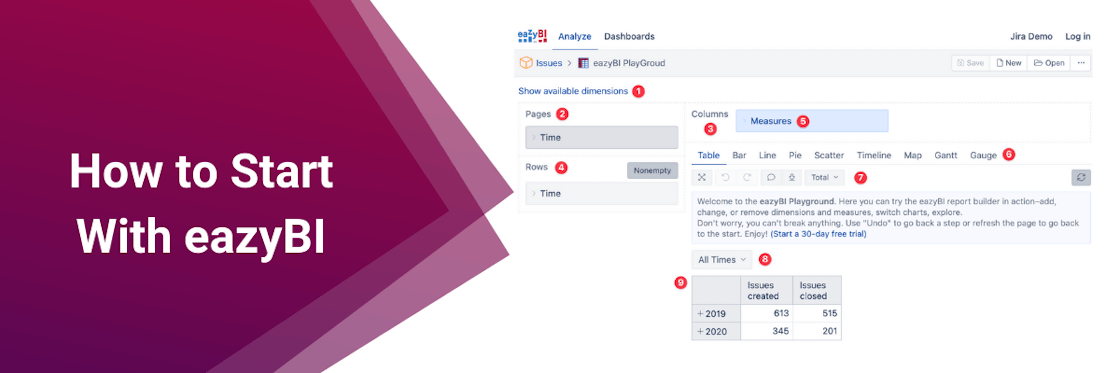
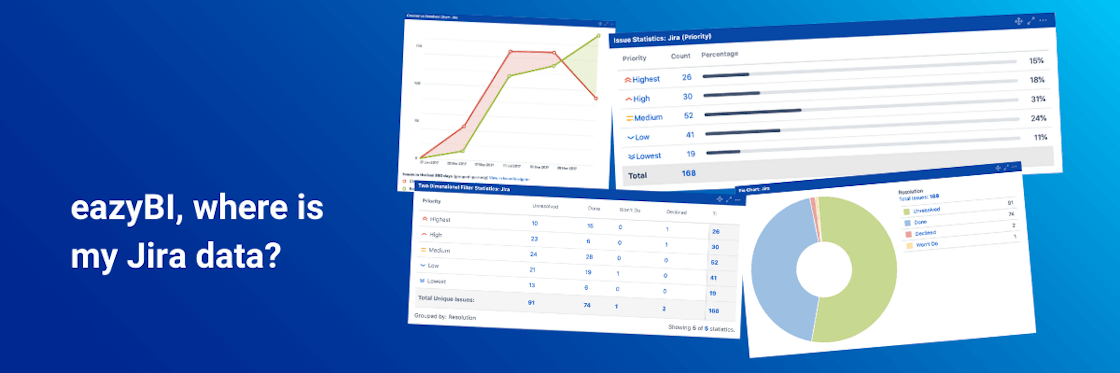
Sometimes new eazyBI users get confused about how Jira data are represented in eazyBI. While Jira users are being intimately familiar with the Jira issue layout, dashboard gadgets, and issue navigator, the re-structured analytical data set in eazyBI seems different.
eazyBI has had integrations with Tempo for a very long time. But since eazyBI version 6.1 you can now easily access data also from Tempo Planner on all platforms–Cloud, Server, and Data Center. How to keep track of your planned and logged Tempo hours more efficiently?
eazyBI version 6.1 comes with dozens of new features and bug fixes. From Tempo Planner updates, custom property hierarchies, and report specific calculated measures, to various administration, usability, and reporting improvements.
Agile organizations use data for better decision making and to move the business forward quickly. But with data scattered across multiple projects and teams, it can be a challenge to create a common reporting structure.
Humans are hard-wired to do most things automatically. We wanted to satisfy this core desire making the process of report creation as intuitive as possible. The new interface was rebuilt almost completely from scratch. We are proud to present it to you this spring.
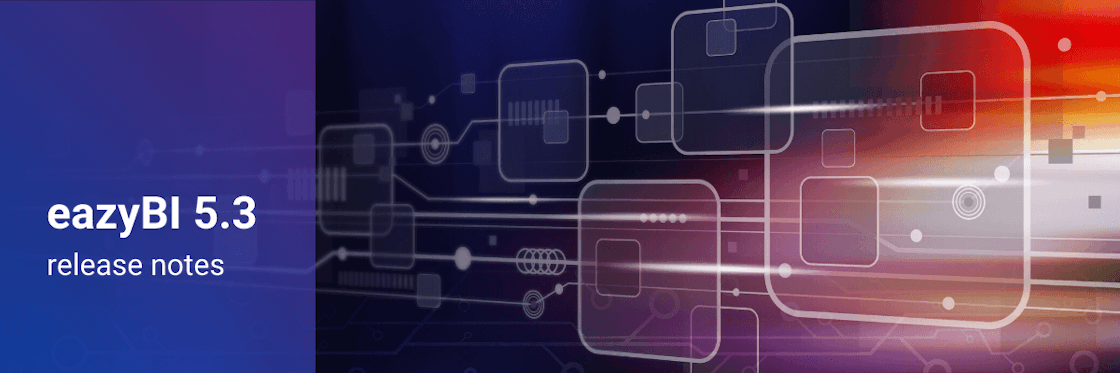
eazyBI version 5.3 is a significant update containing many frequently asked important new features and bug fixes, leading to the upcoming eazyBI version 6.0. While eazyBI 6.0 is still on the horizon, the 5.3 release is a welcome treat to all our customers. Enjoy!
You often told us that eazyBI is a powerful reporting tool, you use it and you love it, but it’s not that easy as the name “eazyBI” suggests. And it’s true — data analysis and reporting is never actually simple.
Just recently, eazyBI has released a couple of new versions—eazyBI 5.1 and eazyBI 5.2. Among many features and improvements, eazyBI is also jumping into the exciting cross-team analysis by adding a standard data import from Atlassian’s DevOps tools—Bitbucket and Bamboo.
I am happy to tell you that eazyBI has launched a new product on the Atlassian Marketplace—eazyBI for Confluence. Now you can analyze the Confluence content from the viewer’s and the author’s perspectives.
eazyBI continues supporting open data movement in Latvia by taking active participation in Open Data Hackathons. eazyBI was one of the sponsors of the event that took place in Valmiera, Latvia.
Please addThe Jira Project Reporting Academy has begun. Learn how to build dashboards of project reports in Jira using the integration between eazyBI and Profields to centralize your project data and visualize it.
From major platform and library updates to new standard calculations. From account administration, to user interface and usability improvements. Here’s what’s new in eazyBI 5.0.
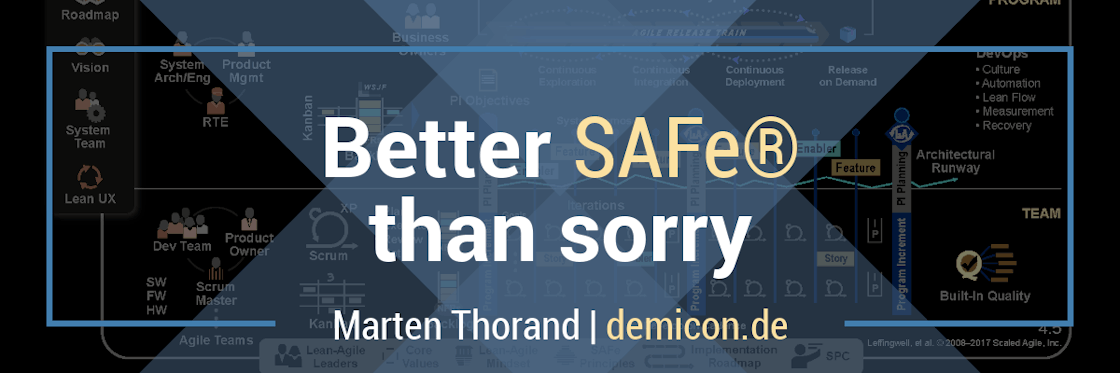
In this blog post, you will discover how to implement a scaled agile project management in Jira based on SAFe® – including value stream and program management.
Over the course of 2 days in Riga, we got the opportunity to hear practical use cases and gain insights from a range of partners and customers in the Atlassian and eazyBI ecosystem. So here’s our take on it.
It is a couple of minutes past 7AM. There is still a silence in the hotel. Soon several room doors open and eazyBI team members start gathering for their morning 5K run. Some eazyBI ladies have already left for their walk a quarter earlier, and they will all meet soon inevitably.
Do all the reports we create serve a purpose? Should they? What is a purpose of reporting anyway? How many times have you created a report that nobody cares about? There are several principles you should follow to make the reporting relevant and sustainable.
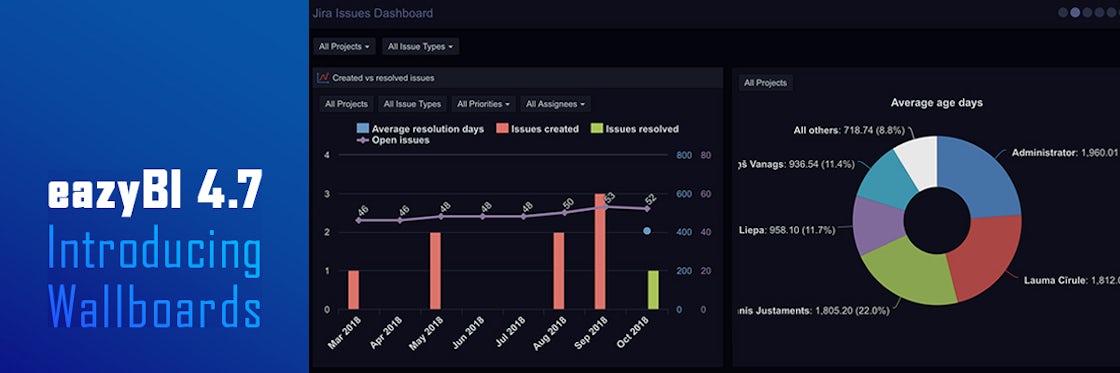
Among other updates, improvements, and bug fixes, eazyBI 4.7 now supports a frequently asked feature – wallboards. Now you can show rotating slideshows of dashboard reports on big-screen monitors in a black or white theme.
eazyBI was named the 2nd “Best Small Exporter” at the Export and Innovation Award 2018, organized by the Investment and Development Agency of Latvia and the Ministry of Economics of Latvia, celebrating the leading exporters and most innovative companies in Latvia.
eazyBI regularly attends Atlassian Solution Partner events to spread the word about our solutions and to interact with our clients and prospects. In this article I've listed my top five reasons why you should go to Atlassian Partner events too.
From Data Center improvements, incremental imports, and updated 3rd party app integrations, to updates in user interface, chart options, and troubleshooting. Here's what we've added in the recent eazyBI releases.
During the weekend of September 28th and 29th, eazyBI was represented in the Open Data Hackathon 2018 in Riga, Latvia organized by the Investment and Development Agency of Latvia (LIAA) and Latvian Open Technology Association (LATA).
eazyBI is ranked by Deloitte as one of the top 50 fastest growing technology companies in Central Europe for the second consecutive year thanks to a 442% revenue growth over the last 4 years.
After attending Atlassian events of two eazyBI partners last week, I came back home inspired both professionally and humanly. And a little bit in love, too.
When we hear a word documentation, we anticipate a long, boring, dry, and complex page full with hard-to-read text. Often it’s difficult to find what you need or understand what should you do next.
We admit our own flaws and want to make things better.
Assets are all around us - employees, customers, facilities, IT infrastructure, or something else entirely. How can you track and manage all your assets easily and in one place? How to get valuable insights about relative costs, usage, or assigned issues related to your assets?
We are excited to have Paul Hardaker from FinancialForce joining our speaker line up this year. We caught up with Paul before the event to learn more about his role at FinancialForce and what he plans to present to our community next week.
In advance of our eagerly awaited eazyBI Community days, we got the chance to catch up with one of our event speakers, Rodrigo Molinare, a Business Analyst from Adaptavist about his thoughts on using eazyBI to transform sales planning, reporting, and management.
Atlassian provides a powerful ecosystem of project management and collaboration tools. Many of those tools complement each other, delivering benefits far beyond each separate tool alone. A good example of complementary tools are tools for testing and data analysis.
eazyBI release notes highlight recent product improvements we’ve made. From new integrations with Adaptavist Test Management and Insight Asset Management to user access roles, public report sharing, performance improvements, and mobile user interface.
We are constantly adding integrations with other popular Jira add-ons. Many users have asked us to add the support for the Xray for Jira test management add-on. We've listened, and now, starting from eazyBI version 4.2, you can import and analyze data from Xray for Jira.
eazyBI Release Notes highlights recent product improvements we’ve made. From usability improvements and new dimension hierarchy members to Xray integration and built-in report usage statistics for server versions — this is what we’ve released in January.
eazyBI has never been a typical startup. We do not have a venture capital, we do not have a large team, we do not focus on high growth, and we don’t even have an office. So, how did we manage to build a company from $0 to $1 million in less than five years?
Information is a key in today’s software projects. Faster feedback loops and user data all come together to provide insights that lead to better quality and innovative improvements, yet this involves security threats. Keep test data secure with these 3 essential steps.
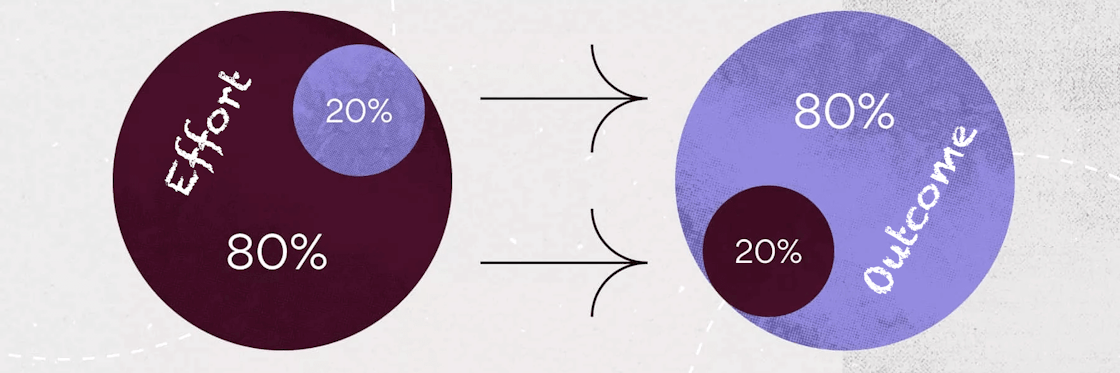
Time, money, supplies, energy — every business has to manage their resources. How can you reduce the waste and increase your return on investment? As it turns out, there is a simple but very powerful tool that can be applied to almost any aspect of your business and life.
Our world continues to move into the digital era. With the proliferation of devices capable of collecting data, we are experiencing a data explosion. Every Internet-connected-device, from a smartphone to a cash register, creates data.
We have some great news to share with you. For the past couple of months, we have been silently working on some visual and functional improvements.
Take a look at the changes we've made so far.
Making sense of facts, numbers, and measurements is a form of art – the art of data visualization. There is a load of data in the sea of noise. To turn your numbers into knowledge, your job is not only to separate noise from the data, but also to present it the right way.
There is so much data around us — but it’s mostly facts, numbers, measurements, and a common noise that does not convey any information. Making sense of these facts and numbers require some understanding of analytical methods.
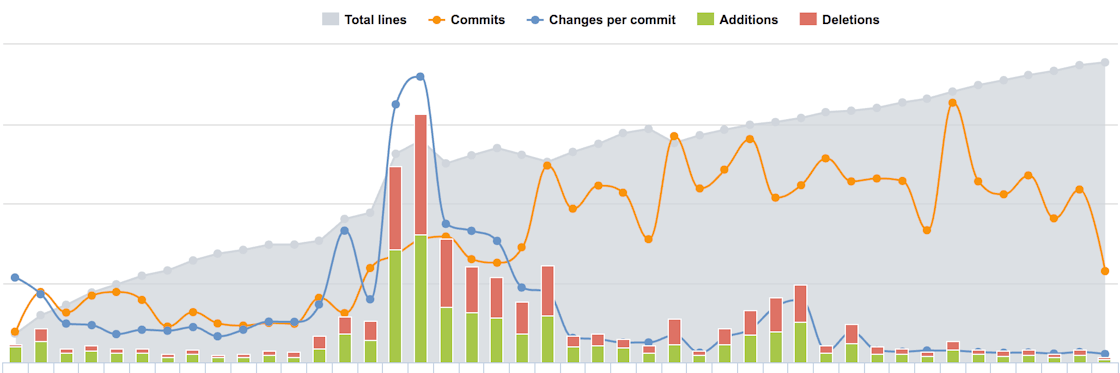
We tend to use a lot of code analysis tools to find out what’s bad with our code. But have you ever looked at your Git logs lately? Git commit logs contain a lot of analytical information. You can visualize and analyze logs and Git commit statistics to see how the code evolves.
eazyBI is a small company and we don’t hide that fact. I see many small companies that try to pretend that they are much bigger than they are. I believe that these companies should not be ashamed that they are small.
This year our company was a gold sponsor of the Summit, and six of us came to the conference. As we do not have an office and we work fully remotely, joint trips to the conferences are our on-site company meetings as well.