
From Overview to Detail: Interactive Xray Reporting in eazyBI
eazyBI integrates with several testing apps in Jira, but the most popular among eazyBI customers is Xray. Xray is well integrated into Jira and uses issue types and custom fields to manage testing, giving eazyBI more flexibility to gain a different perspective on testing data.
How Xray Data Are Organized in eazyBI
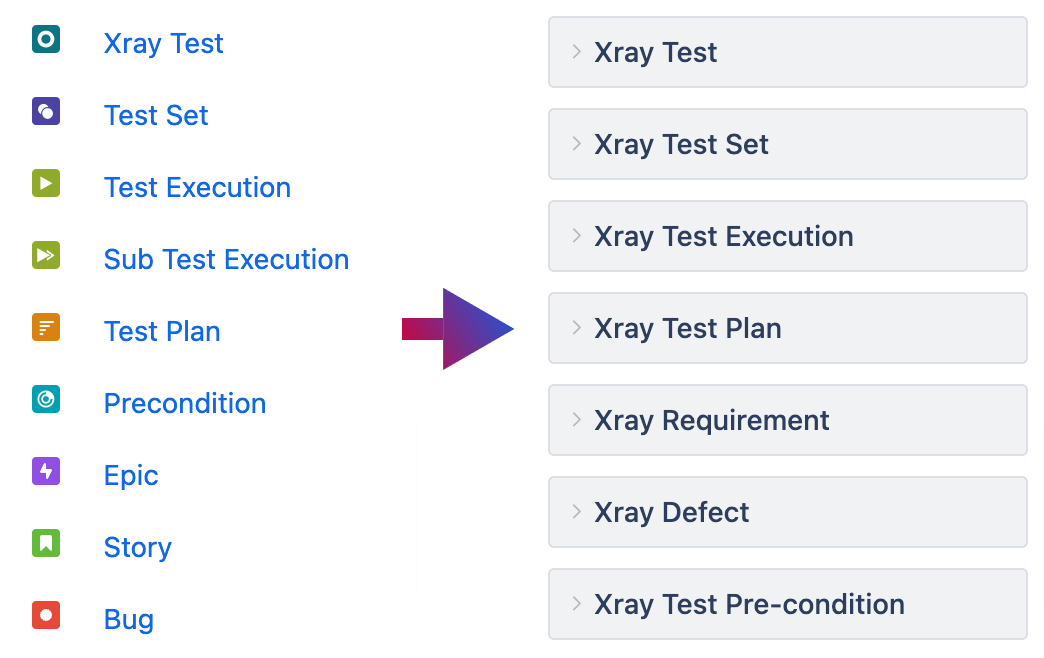
- The testing data model itself is tangled and has many-to-many relations. For instance, one Test can cover multiple Stories (requirements) and be executed several times for different application versions, while one Test Execution usually has many Tests in it. To support this, eazyBI creates a separate Xray-specific dimension for each set of issues related to testing: Xray Test, Xray Test Execution, Xray Requirement, Xray Defect, and a few more. These are the same issues you have in the "Issue" dimension but are organized to better suit testing reports.
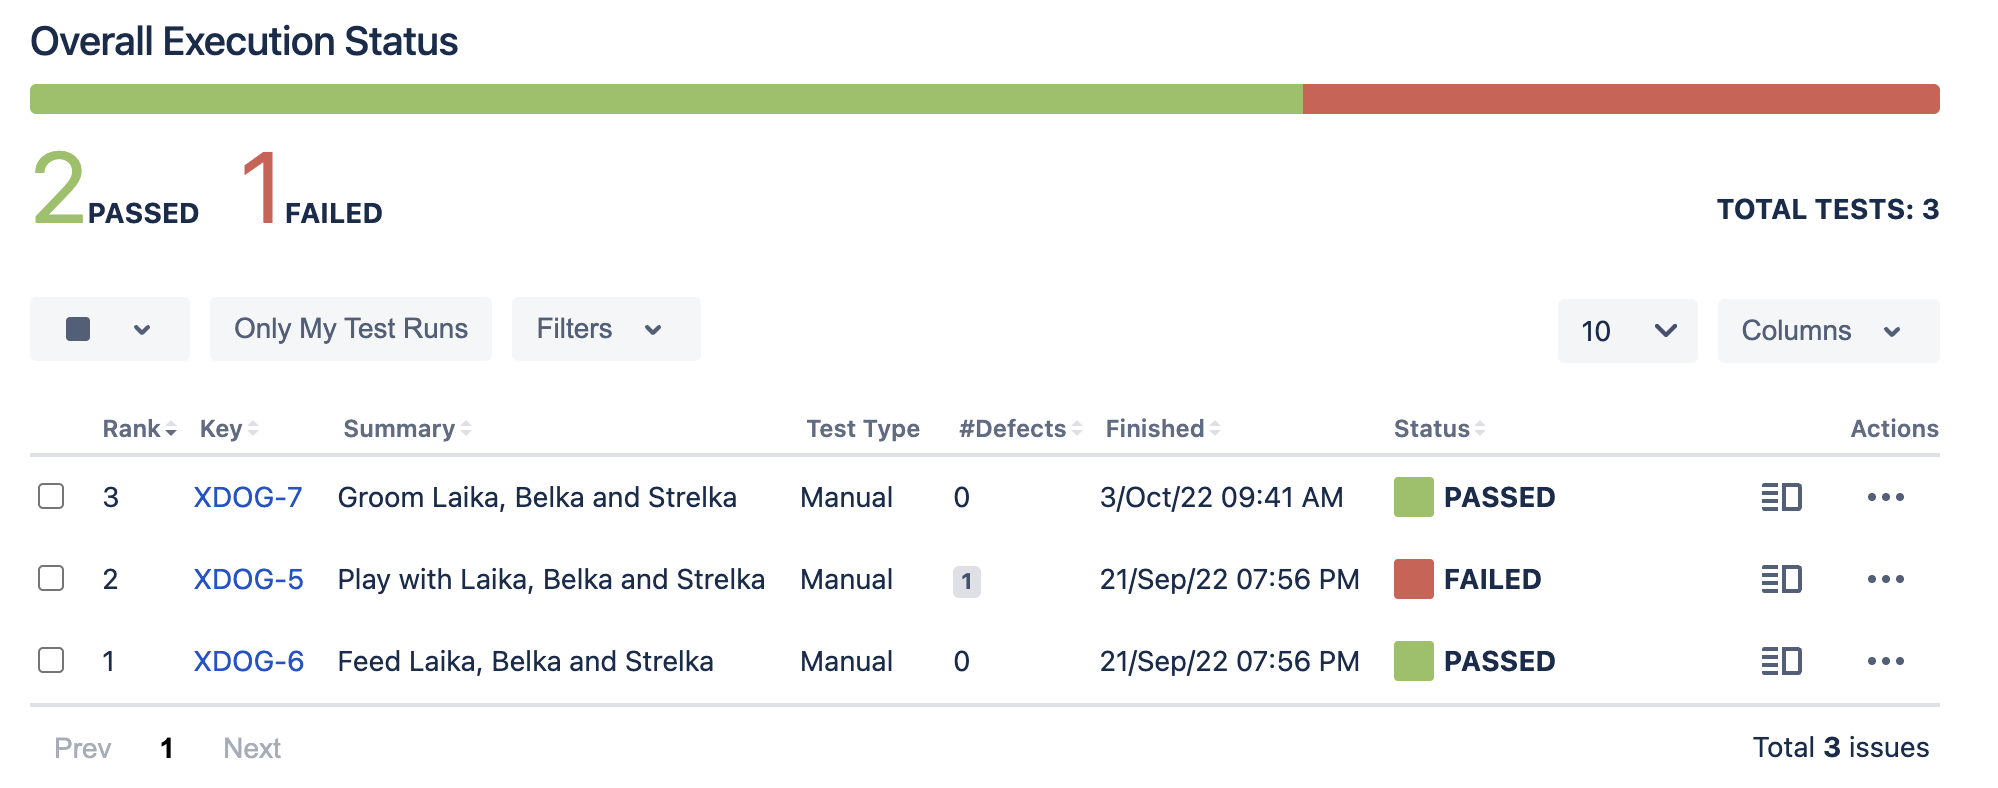
- A Test Run is often abused and mixed with a term execution. When you add a Test to a Test Execution, it creates a single Test Run. It is a unique combination of a Test and Test Execution that always has a status like TO DO, IN PROGRESS, PASS, FAIL, etc. For example, the Test Execution in the picture below has three Tests, which results in three Test runs..
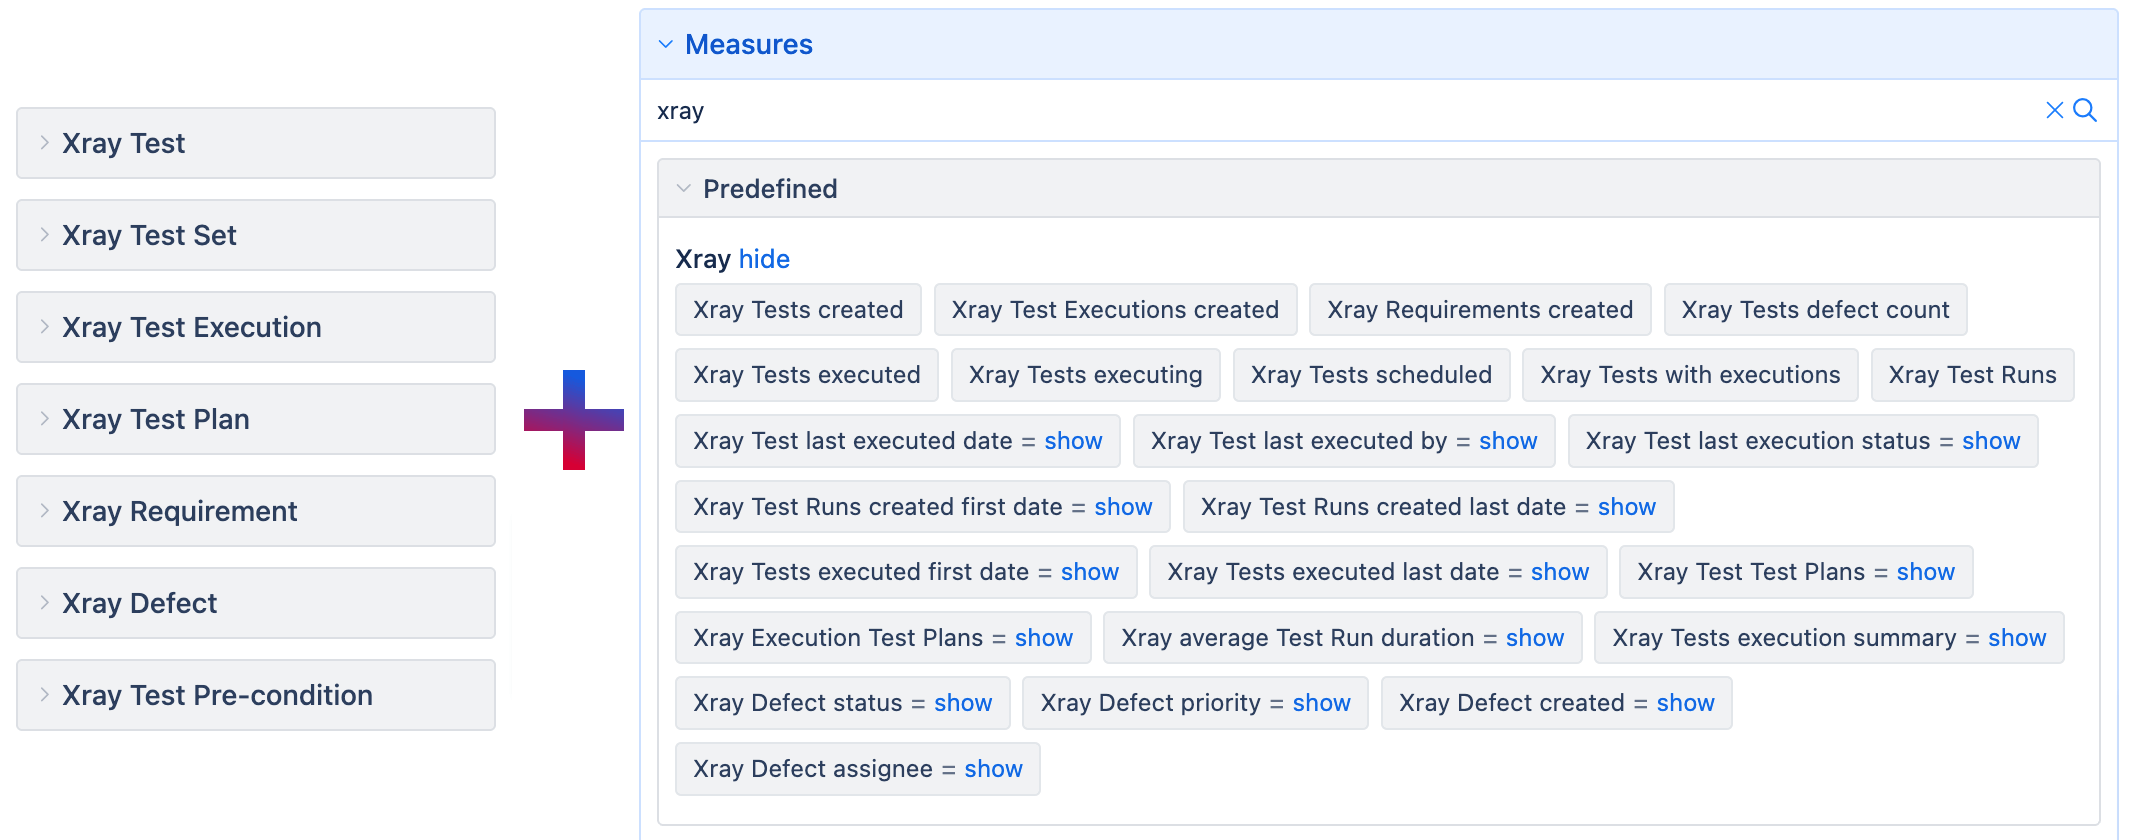
- Measure is the treasure! When creating testing reports, use Xray-specific measures and dimensions. The chosen measure would define if the dimensions group data by Test, Test Execution, or Requirement perspective. When in doubt about what the measure does or how it reacts to the filters in your report, please refer to the documentation.
Building Xray Reports in eazyBI
For inexperienced or confused customers, my advice is to start with Sample Xray reports generated by eazyBI during data import. Either use them to see how your testing data resembles those in eazyBI or as a base for a new report–you can modify them and then "Save as" new reports.
However, the true power of the reporting tool lies in its ability to generate reports that support your development and quality process helping you to focus on what truly matters.
1. Requirement Coverage Report
Requirement coverage is one of the most interesting and valuable reports to create, as each customer has a unique development process, organization of work (by Sprints or Version), and criteria of what is considered tested. In eazyBI, issues matching the requirement issue types, like Stories, Features, Improvements, etc. (as configured in your Xray) are imported in the "Xray Requirement" dimension.
You can start with an overview report that shows each Requirement's development status, testing readiness, and overall testing results. The requirements and tests might be in separate Jira projects. Therefore, you should use the "Xray Requirement" dimension on report pages to filter data by requirement project instead of the "Project" dimension. Another benefit is that you can group requirements by the same issues hierarchies, like Epic or Plans (Parent for Data Center), thus getting an overview of bigger features.
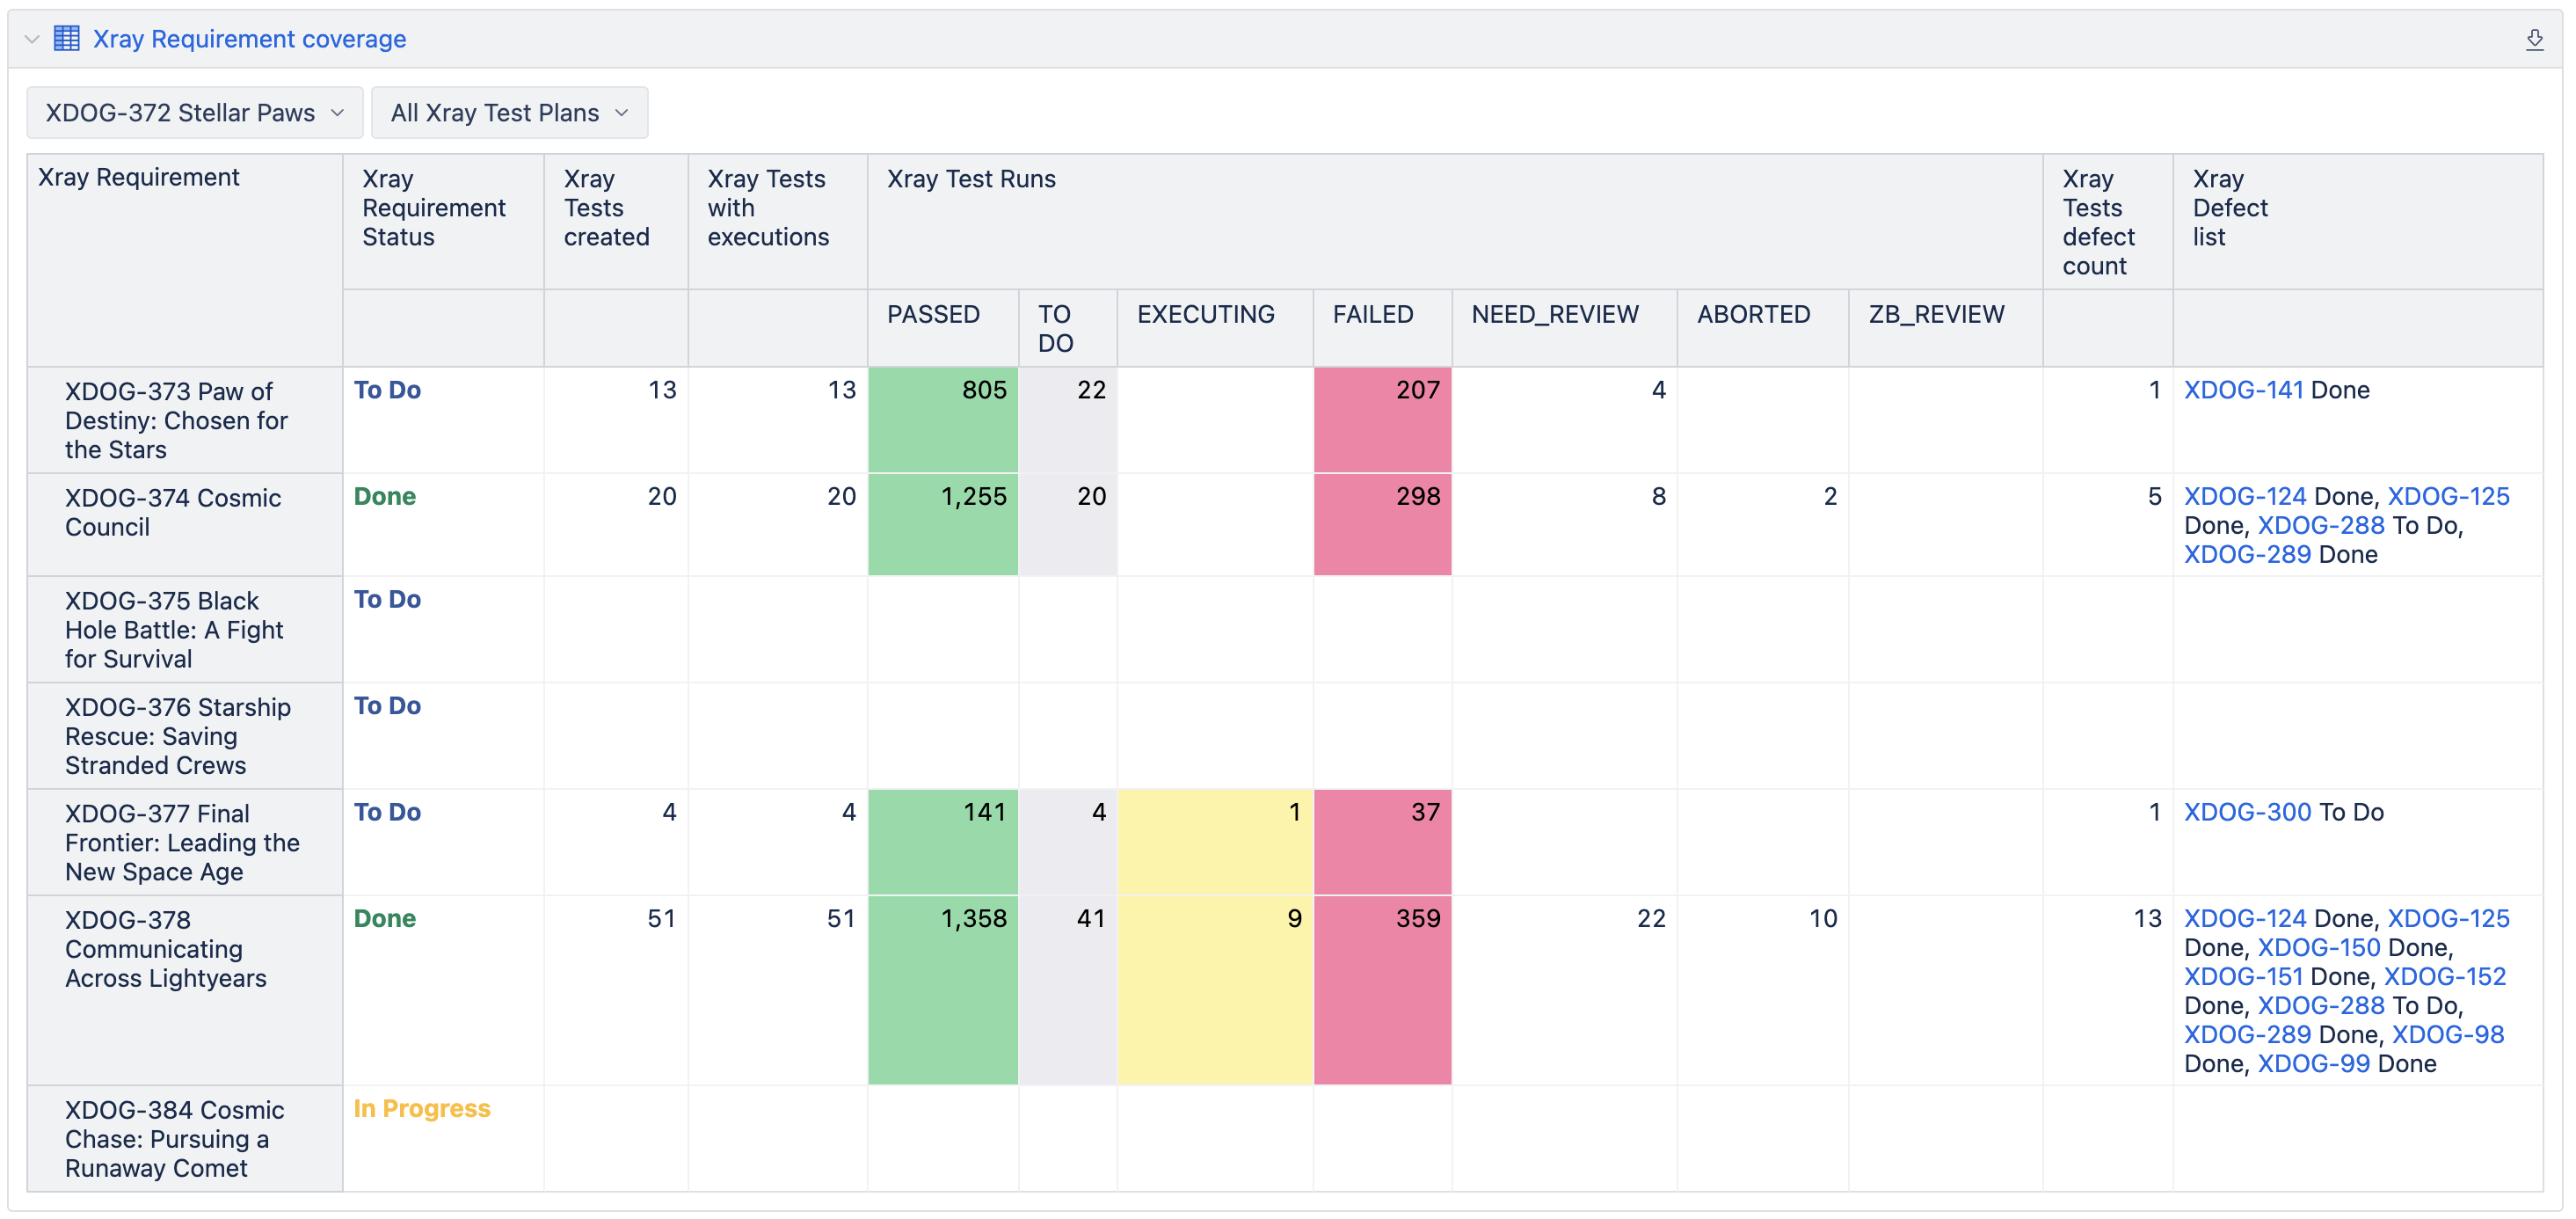
A detailed description of how to build such a report is in the documentation.
2. Test Plan burnup
Test plans are a popular approach to planning and organizing the testing process; they allow you to see the testing's total scope and compare it to the actual results across Sprints, Versions, and Projects.
You can make a burndown report to see the total scope of Tests in a Test Plan and how they are gradually executed. The main intention of this report is to see if there are any lags in testing in general, but for detailed testing results, you can make other reports incorporating more aspects, like Test types, found defect statuses, and others.
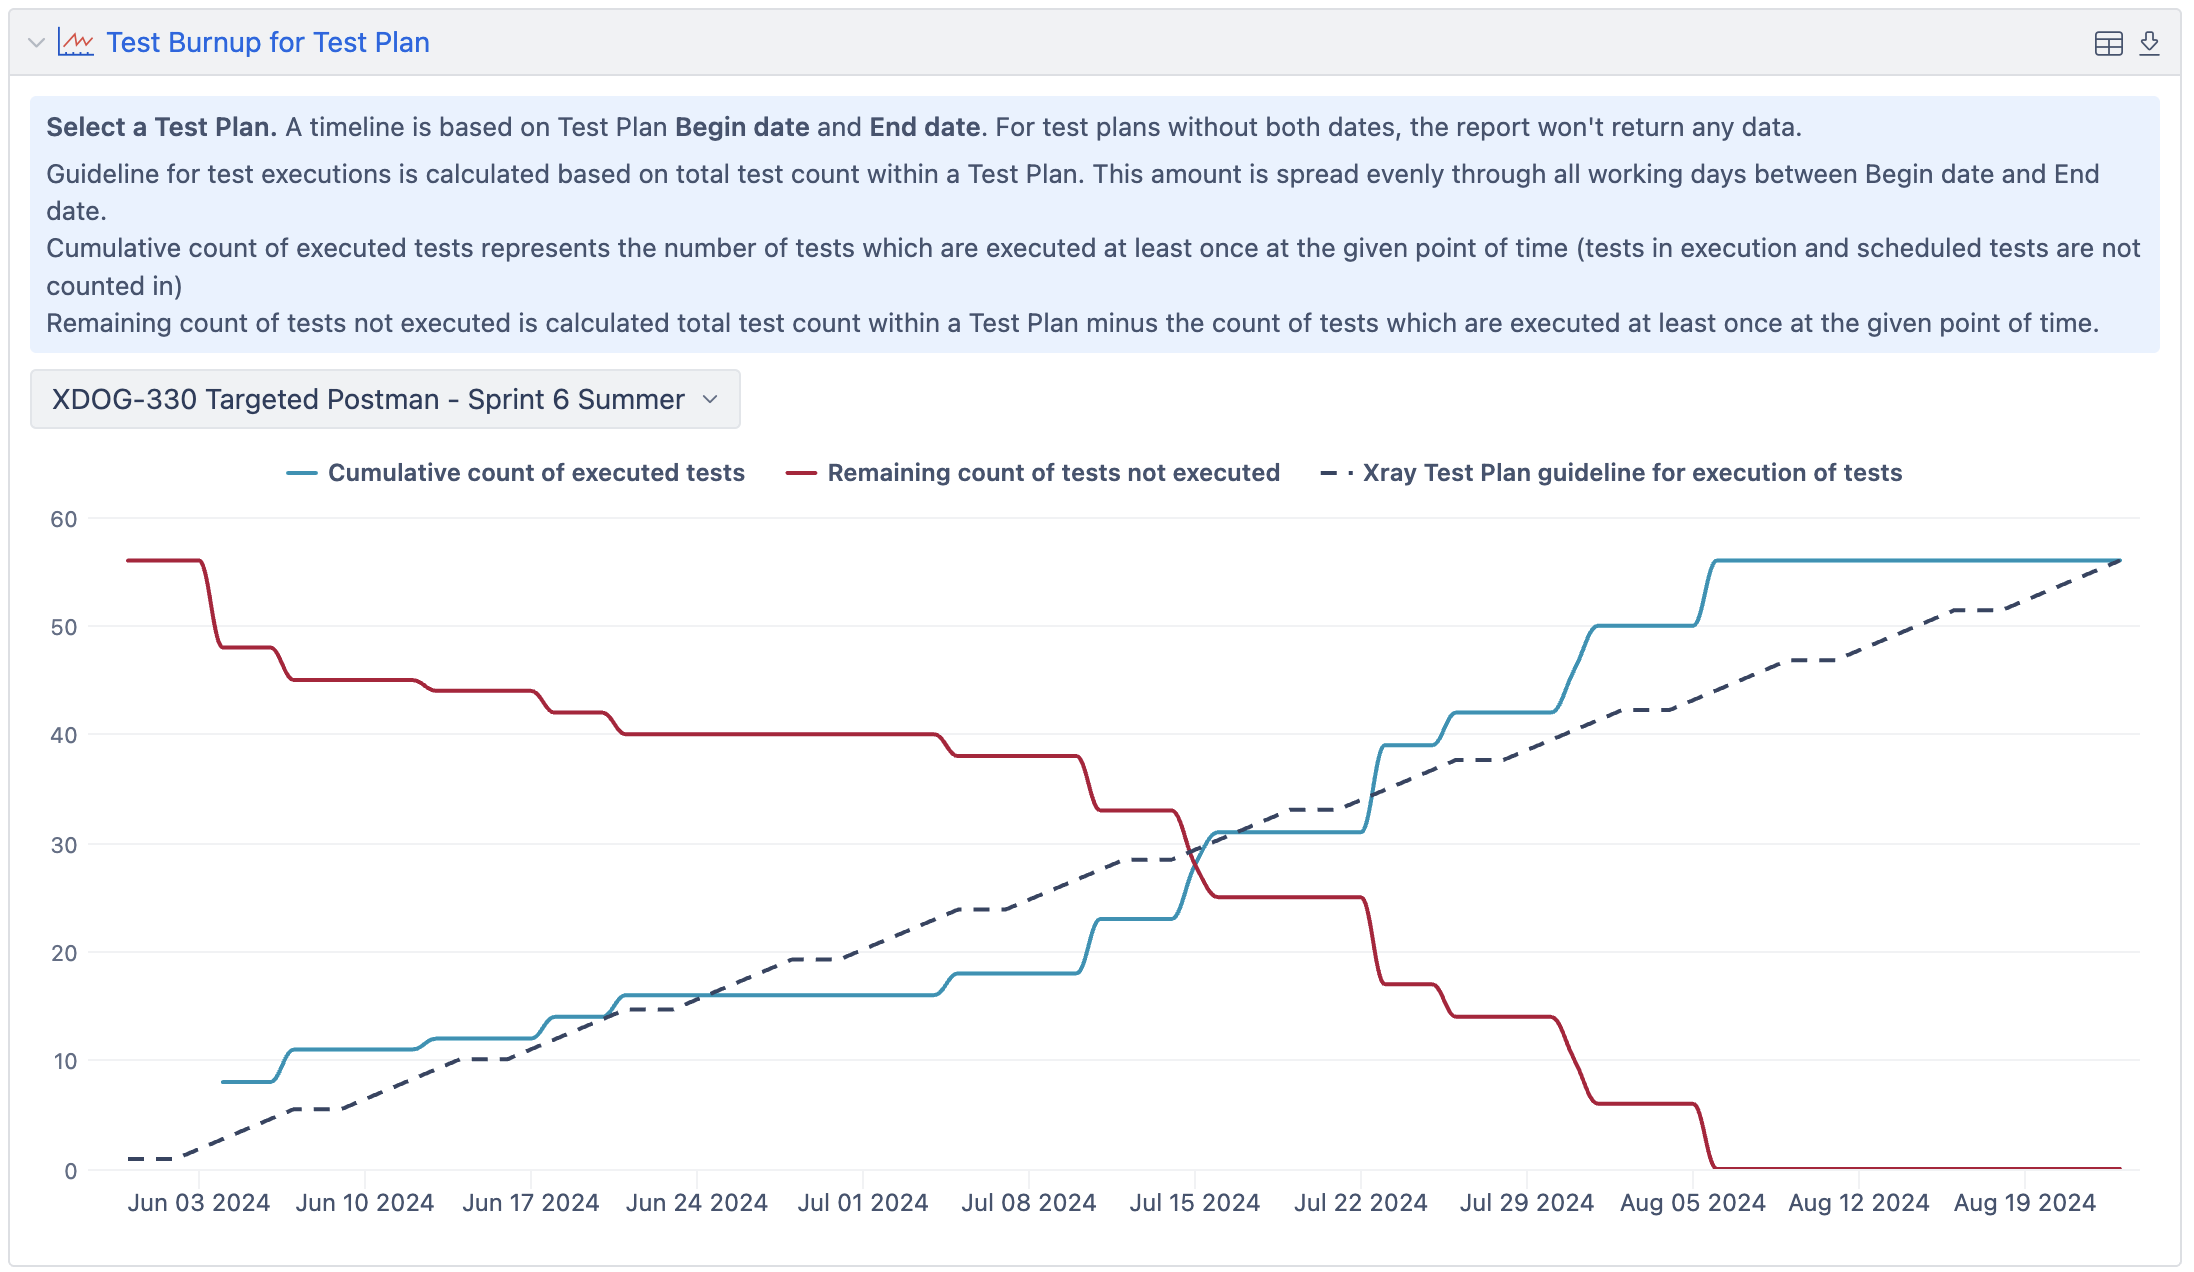
Detailed description on how to build a test plan burndown report is described in the documentation.
3. Test Plan overview matrix
eazyBI can be used for both detailed and overview analytics. The Test Plan overview matrix provides fundamental information on the Test Plan, the coverage by test types (how much is automated or left to manual testing), and testing progress. The report shows defects identified during testing and groups them by their status—potentially highlighting risks that still need to be addressed. While this is an overview report, users can interact with it and view the specific Tests or Test Executions behind each number using the Drill through option.
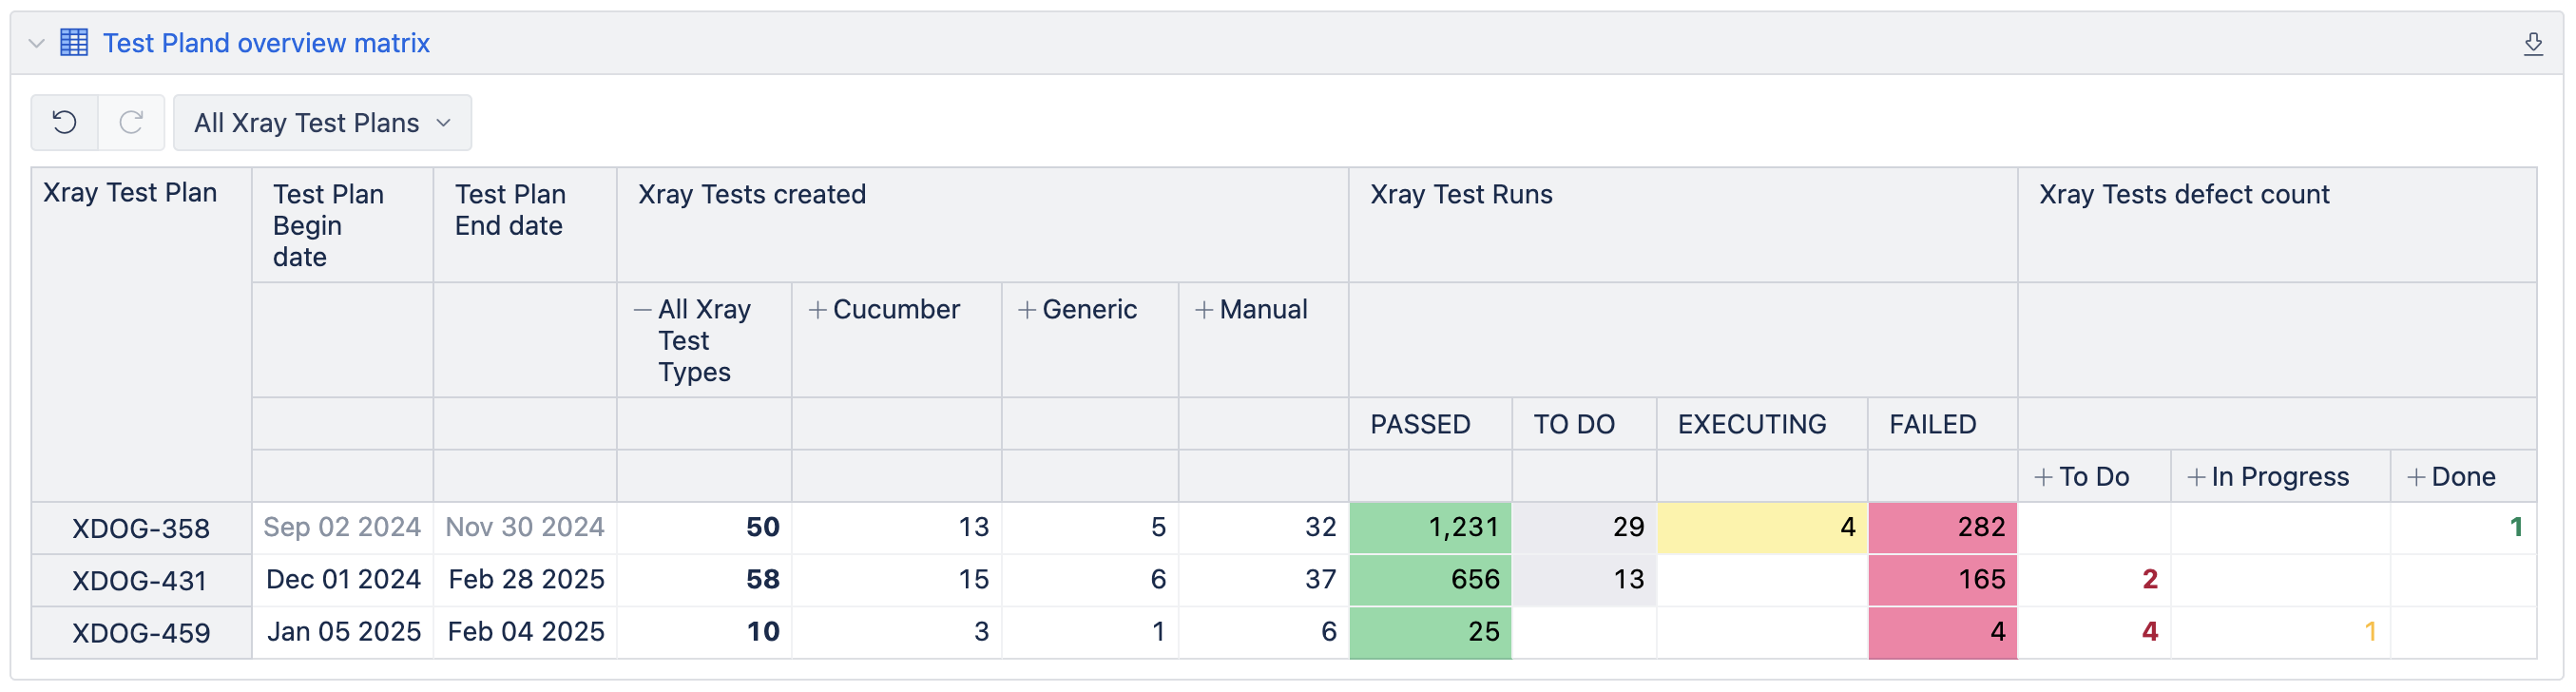
Detailed description on how to build a test plan burndown report is described in the documentation.
Useful Features to Know
- eazyBI provides predefined Xray measures, making it easy to analyze testing key metrics. From them, you can use different options (Drill through test executions, Drill through Test, Drill through Execution) to view detailed information about individual test runs contributing to the overall numbers.
- Create a hierarchical structure for the Requirements, such as organizing them under Epics or Parent issues, to visualize the progress of related stories or see the readiness of a larger epic or feature.
- By default, measures shown in testing results are grouped by Test Execution fields (like labels and components). However, some characteristics are added to Tests, not Test Executions. To analyze data by them, you can add custom Test field dimensions, such as Test Components or Test Labels, and use in your reports for grouping or filtering. This feature enables you to break down testing results based on specific field values assigned to the tests.