
Release Notes – eazyBI 4.5 and 4.6
From Data Center improvements, incremental imports, and updated 3rd party app integrations, to updates in user interface, chart options, and troubleshooting.
Here's what we've added in the recent eazyBI releases.
Improvements for Jira Data Center
The eazyBI team worked together with the Atlassian team during the AppWeek in Amsterdam to improve and provide a better support on how eazyBI works in Jira Data Center.
The new and improved eazyBI for Jira Data Center supports dedicated cluster nodes for eazyBI tasks. Background processes and Child process work on dedicated nodes while all user requests are distributed to cluster nodes via the load balancer.
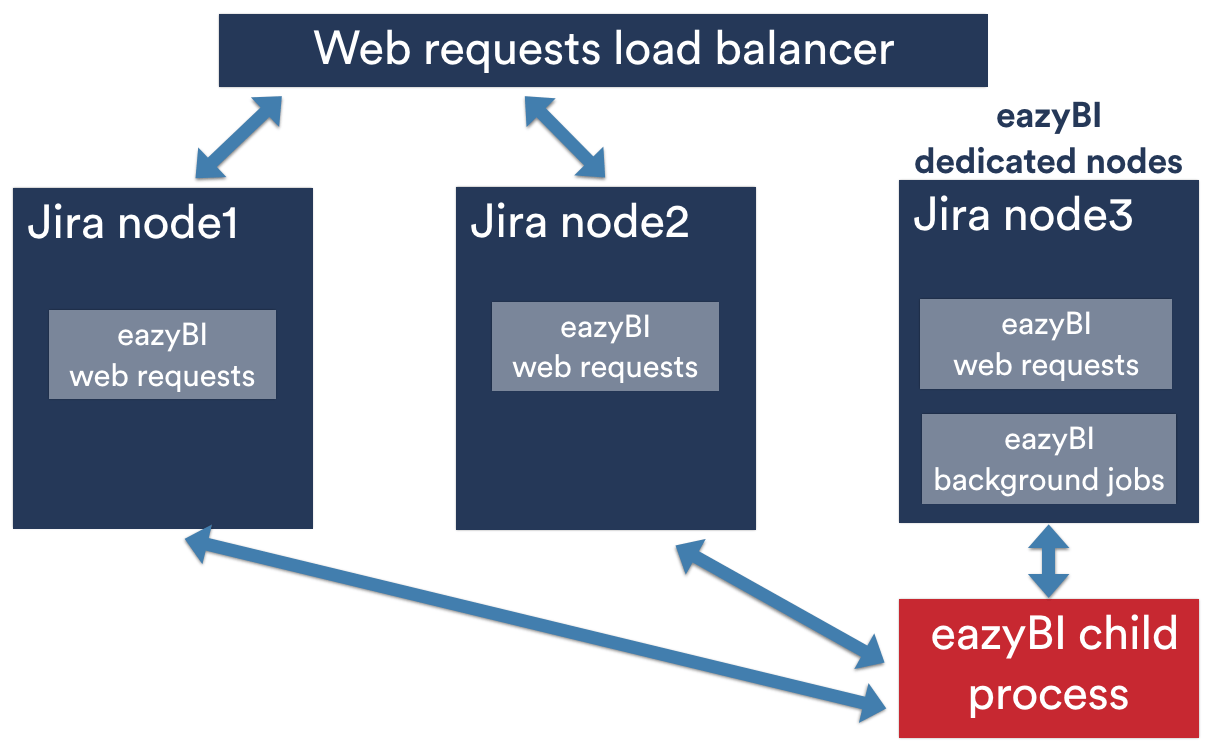
Read more about Data Center in eazyBI documentation.
Zephyr Test Management Data Import
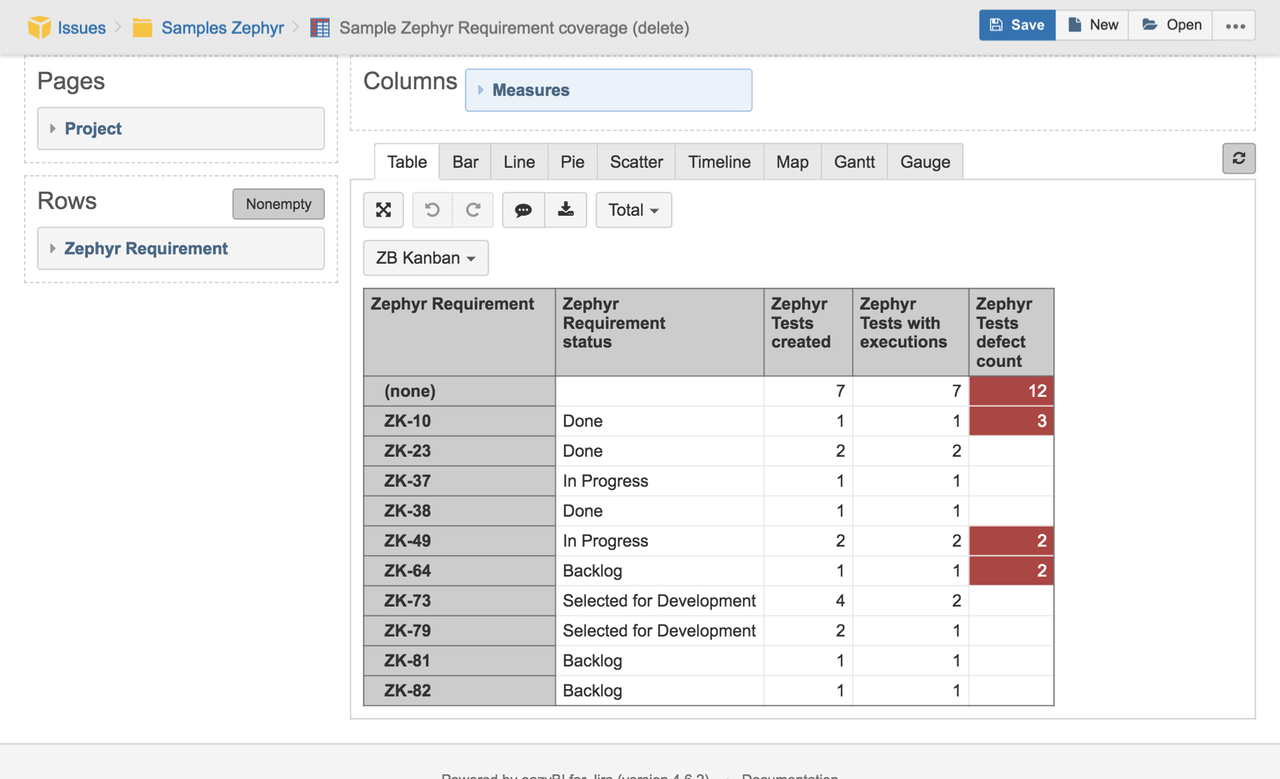
Zephyr for Jira – Test Management is one of the first 3rd party apps supported by eazyBI. From the eazyBI version 4.5, Zephyr for Jira data import into eazyBI is updated and now provides better import performance.
We also added a few new dimensions and measures for data analysis, providing better tracking for test processes, requirements, and defects.
You can also analyze tests by persons involved in the testing.
Mora about Zephyr for Jira integration in the eazyBI documentation.
Report and Chart Improvements
There are several improvements for reports and charts in the latest eazyBI versions:
- Now you can show only key or summary of the issue in the report, add headers in Table reports for dimensions.
- The CSV and Excel result export has been improved.
- Since the eazyBI 4.6., Measures are always used in all reports and cannot be removed.
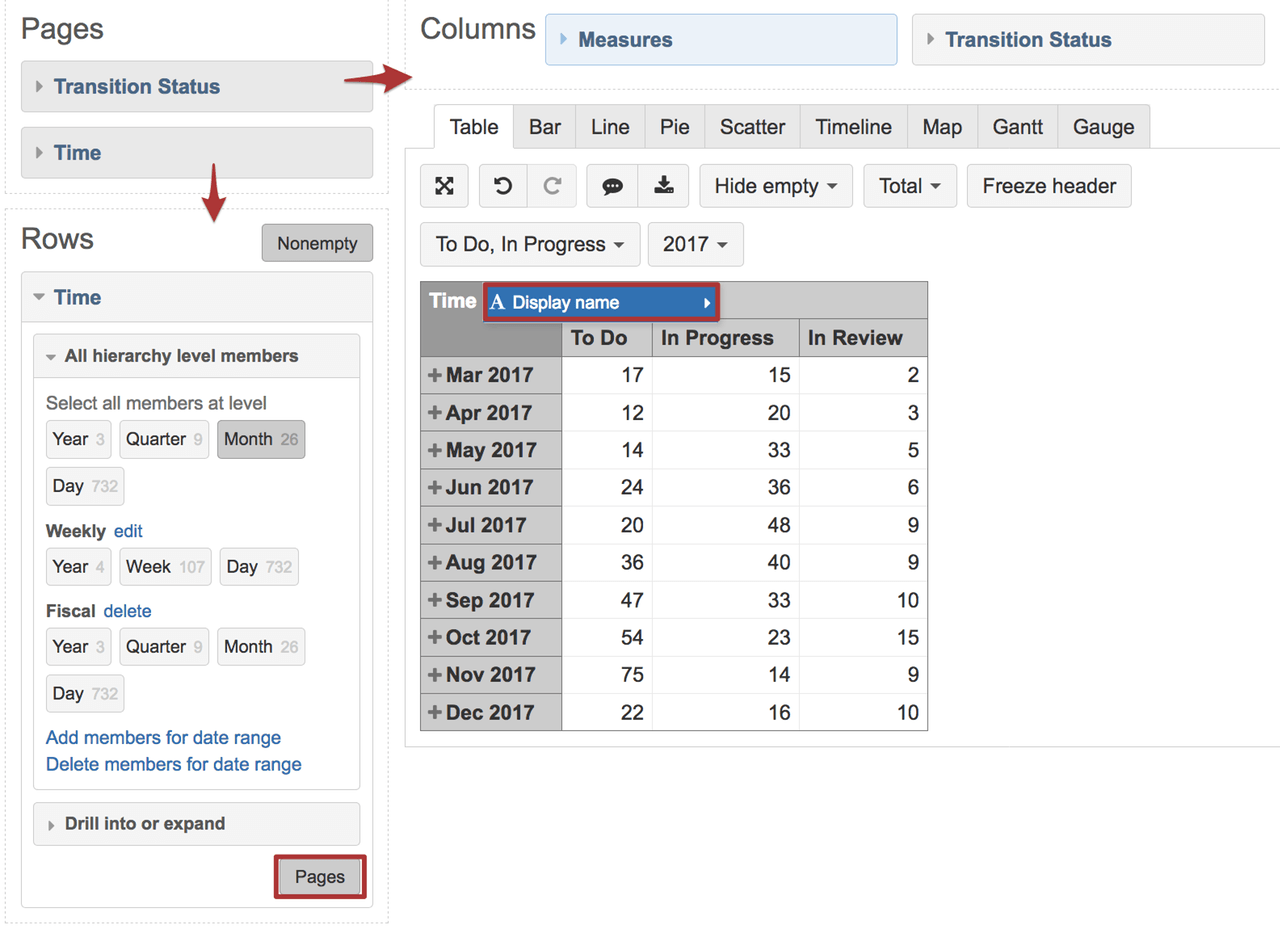
Previously, If users didn't select a measure, reports still displayed the default measure "Issues created". It was confusing because it wasn't clear what data are displayed and how to add more measures. - Analyzing changes over time is a very commonly used report type. Many of you have asked us for an easy option to filter the time period used in Time reports.
Now you can use the Time dimension both in Pages as a filter (Year/Month/Week) as well as in Rows or Columns.
This was one of the most requested features that allows you to create a Time based chart and quickly apply a filter to narrow down to specific members (quarter, month, week, or day).
This option is available since the version 4.6 and it is not limited to Time dimension only. You can use any dimension both in Rows/Columns and in Pages for filtering.
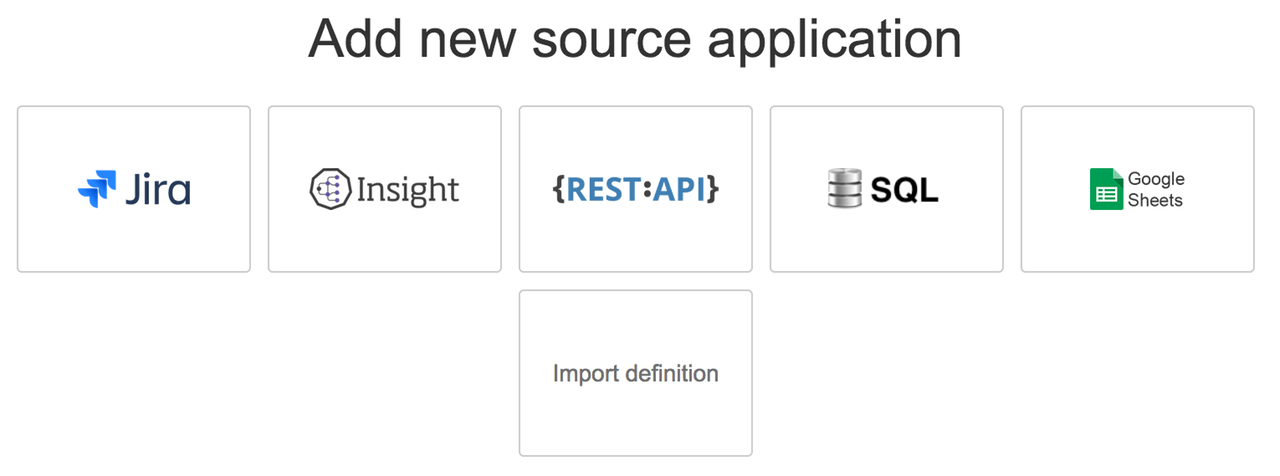
Source Data and Import Options Selection
-
We have redesigned our import screens. You can either select a data source or import using a predefined definition.
-
We reorganized Jira import options screen with several tabs to group and simplify your options. Now you'll find all the basic import options in the first screen and access any additional option in other tabs.
You can pick particular projects or select project import by project category. All 3rd party app import options are now in the same place. If you are looking for import options and custom fields for Tempo, Profields, or other supported apps, you will find them all grouped in the Add-ons tab.
REST API and SQL Incremental Imports
Since version 4.6, eazyBI now supports incremental data imports from REST API and SQL data sources. You can define additional import options both for REST API and SQL to identify changes in your data and then import only updates instead of performing a full data reimport.
Read more about REST API Incremental import or SQL Incremental import in eazyBI documentation.
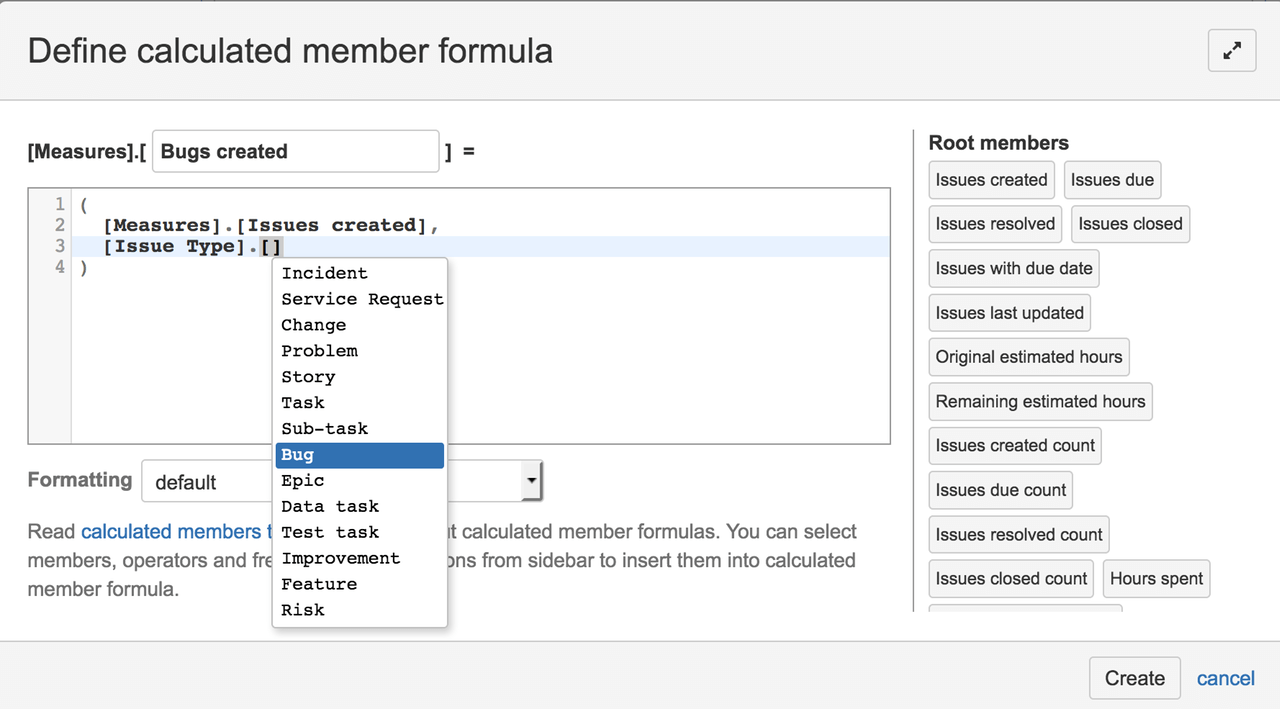
Autocomplete for Calculated Members
eazyBI introduced an autocomplete for the calculated member editor in version 4.6.0. Now you can see available functions and their parameters while writing the MDX.
Just start typing measures, member names, functions and eazyBI will provide autocomplete options. For functions, we will show both name and all parameters.
You can access both the default as well as user-defined measures. You can get any member names there as well. This will allow you to write your formulas faster, easier and with fewer errors.
Portfolio for Jira
Since version 4.6.0, eazyBI supports Portfolio for Jira data import. eazyBI will automatically detect Portfolio custom fields and issue properties. Also, eazyBI will create a new Issue Portfolio hierarchy based on your Portfolio hierarchy configuration.
Read more about integration with Portfolio for Jira in the eazyBI documentation.
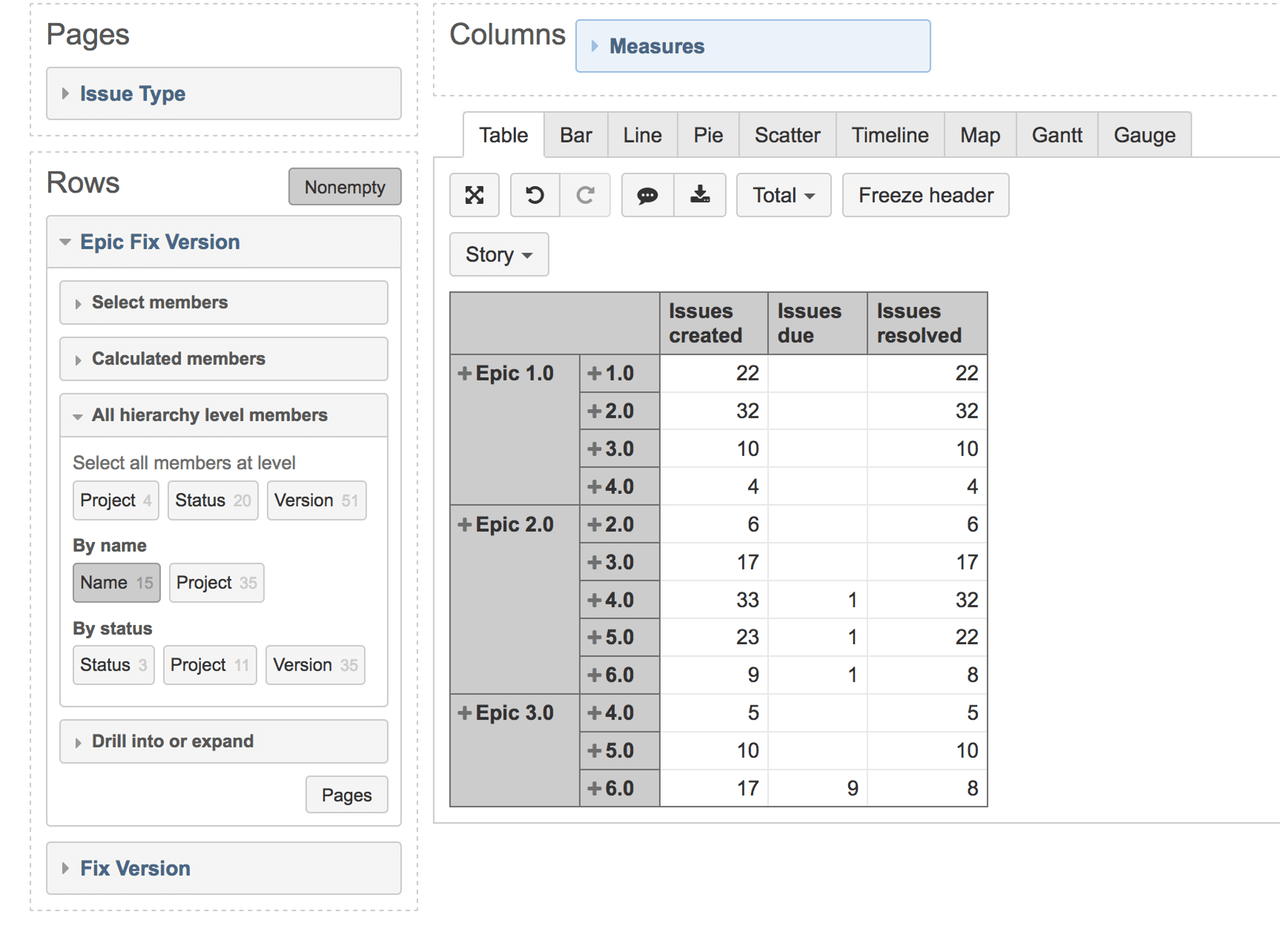
Link Field Dimensions
eazyBI extends issue link and hierarchy data analysis by supporting new dimensions based on linked Jira default field values. You can create new dimensions based on any default Jira field and any single value link field.
For example, you can create Epic Fix version dimension and analyze how Stories are released by Fix version within Epic Fix version. Linked field dimensions have the same dimension structure and properties as default field dimensions.
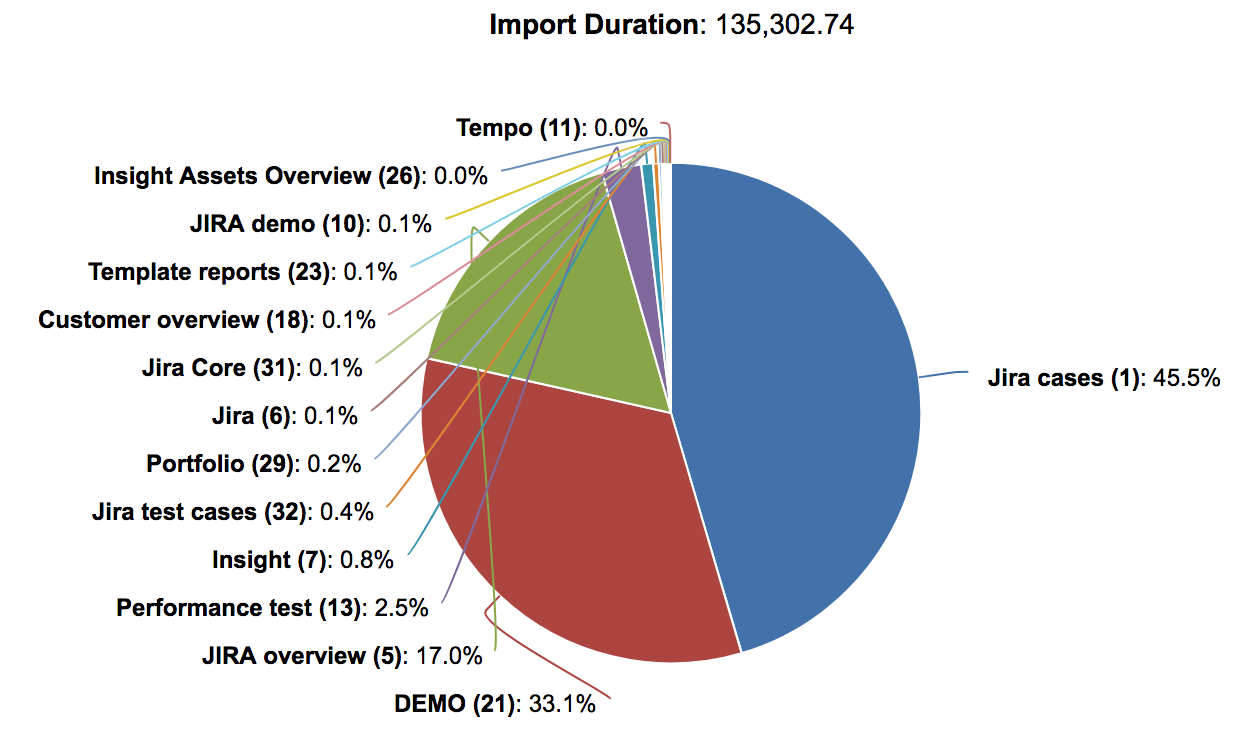
Usage Statistics for Source Data Import
Usage statistics for Source Data Import now provide eazyBI import data analysis. You can monitor imports of all eazyBI accounts. You can analyze the total time of imports, imports by type, see details by steps and source types.
For example, you can see which accounts take the most time for the import time and require more resources.