
Control Reports: Building Trust in Data
During eazyBI Community Days 2024, Stefan Krooshof, a passionate Atlassian expert from Prepend with eight years of using eazyBI, shared his experience building and using various control charts to ensure data integrity and reliability.
What are control reports?
Let's dive into the topic of control reporting. You might wonder, "Aren't all reports about control?" In a way, yes, but control reporting has a specific focus that sets it apart from other types of reports.
To clarify, let's break down reports into three categories:
-
Current State Reports: These tell the company where it stands right now. They provide a snapshot of current performance and metrics.
-
Forecasting Reports: These predict where the company is heading, assess whether it's on target, and what to expect in the future.
-
Control Reports: This is where control reporting comes in. These reports focus on the integrity of the data. They check whether the data is complete, identify duplicates, and highlight exceptions and outliers.
Purpose of Control Reporting
Control reports serve a specific purpose. They ensure the data's accuracy and reliability, which is crucial for making informed business decisions. This focus on data integrity helps organizations maintain trust in their information systems and processes.
Think about how important it is to have accurate data. Control reports help you identify any discrepancies or issues, ensuring that decisions are based on solid information. Consider the purpose of these reports and how they can benefit your organization.
Why are Control Reports Important?
Beyond just believing in the accuracy of our data, we need to explore how we can ensure that the data we rely on is truly correct.
Control reports are not the most frequently accessed reports, but their role is crucial. They enhance trust in the primary reports that users are most interested in. Control reports increase confidence in the main reports by validating data accuracy and highlighting any discrepancies.
Let’s dive into three use cases. Each one will focus on a different type of control report, and each one will show a different technique used to get through such a control report. All those reports are about time registration or, in Jira language, registration of hours or time spent.
Use Case #1: Data Integrity
In this first use case, we'll explore how to allocate hours to a specific budget and ensure data integrity.
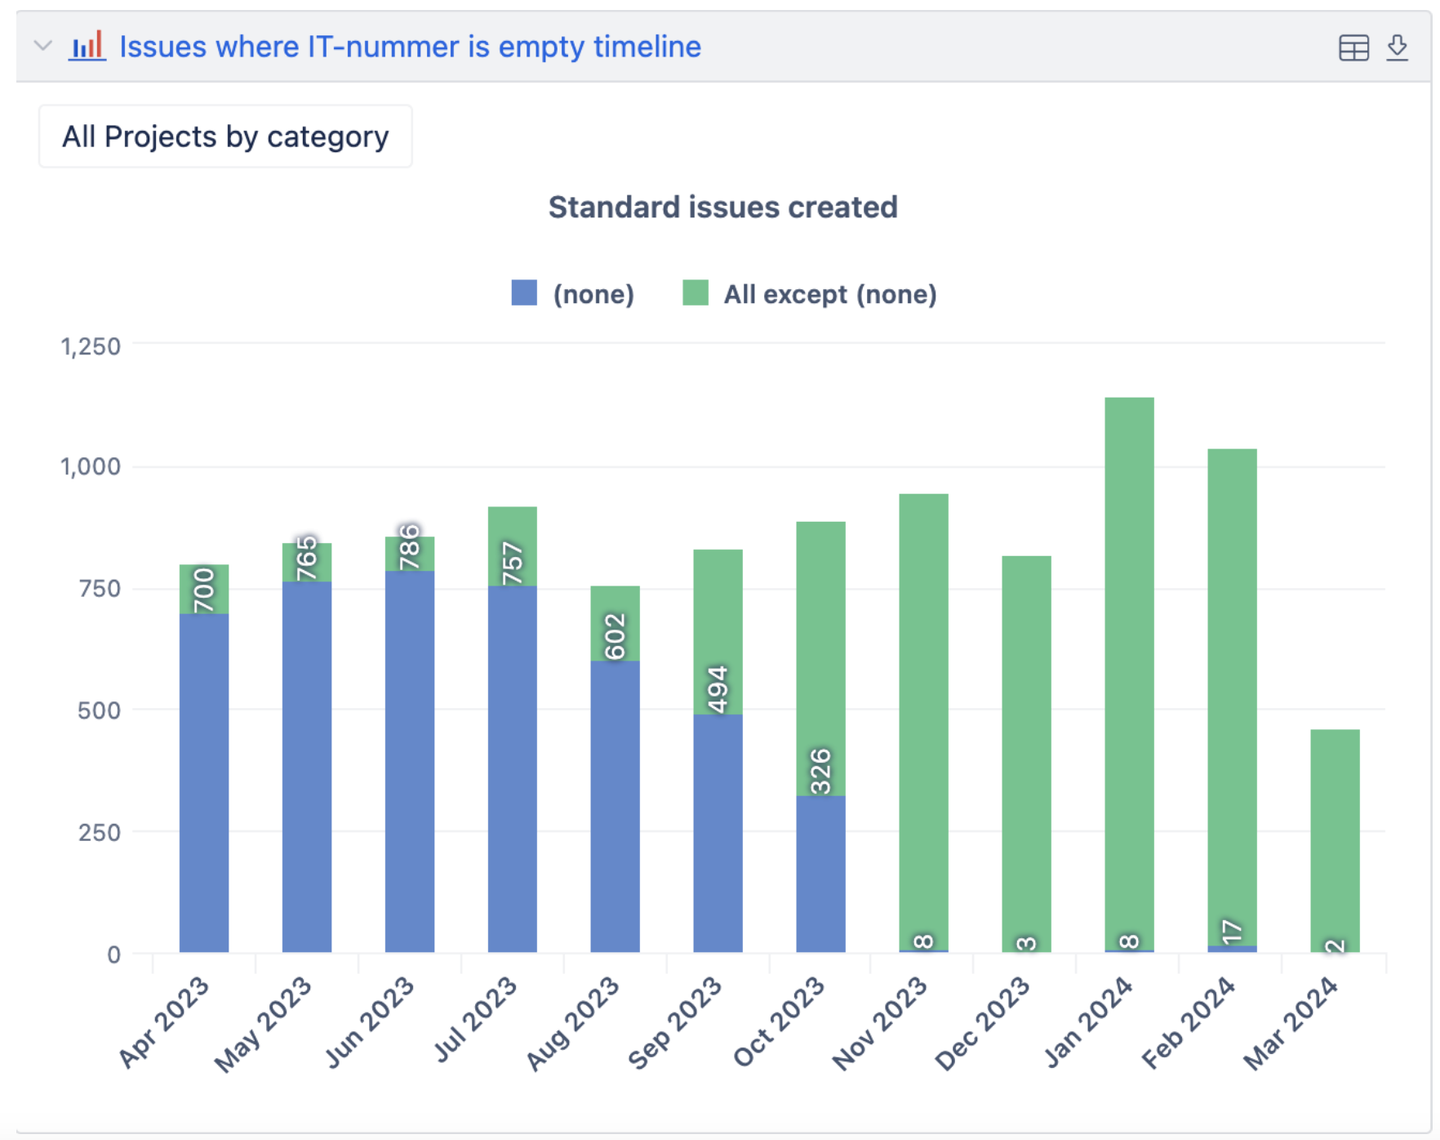
We use a method called "none-checks" or "empty checks." A customer wanted to track which hours belong to which budget, categorizing them as capital or operational expenditures. They noticed that 60% of their budget went to capital expenditures, but the real picture was incomplete, with missing data.
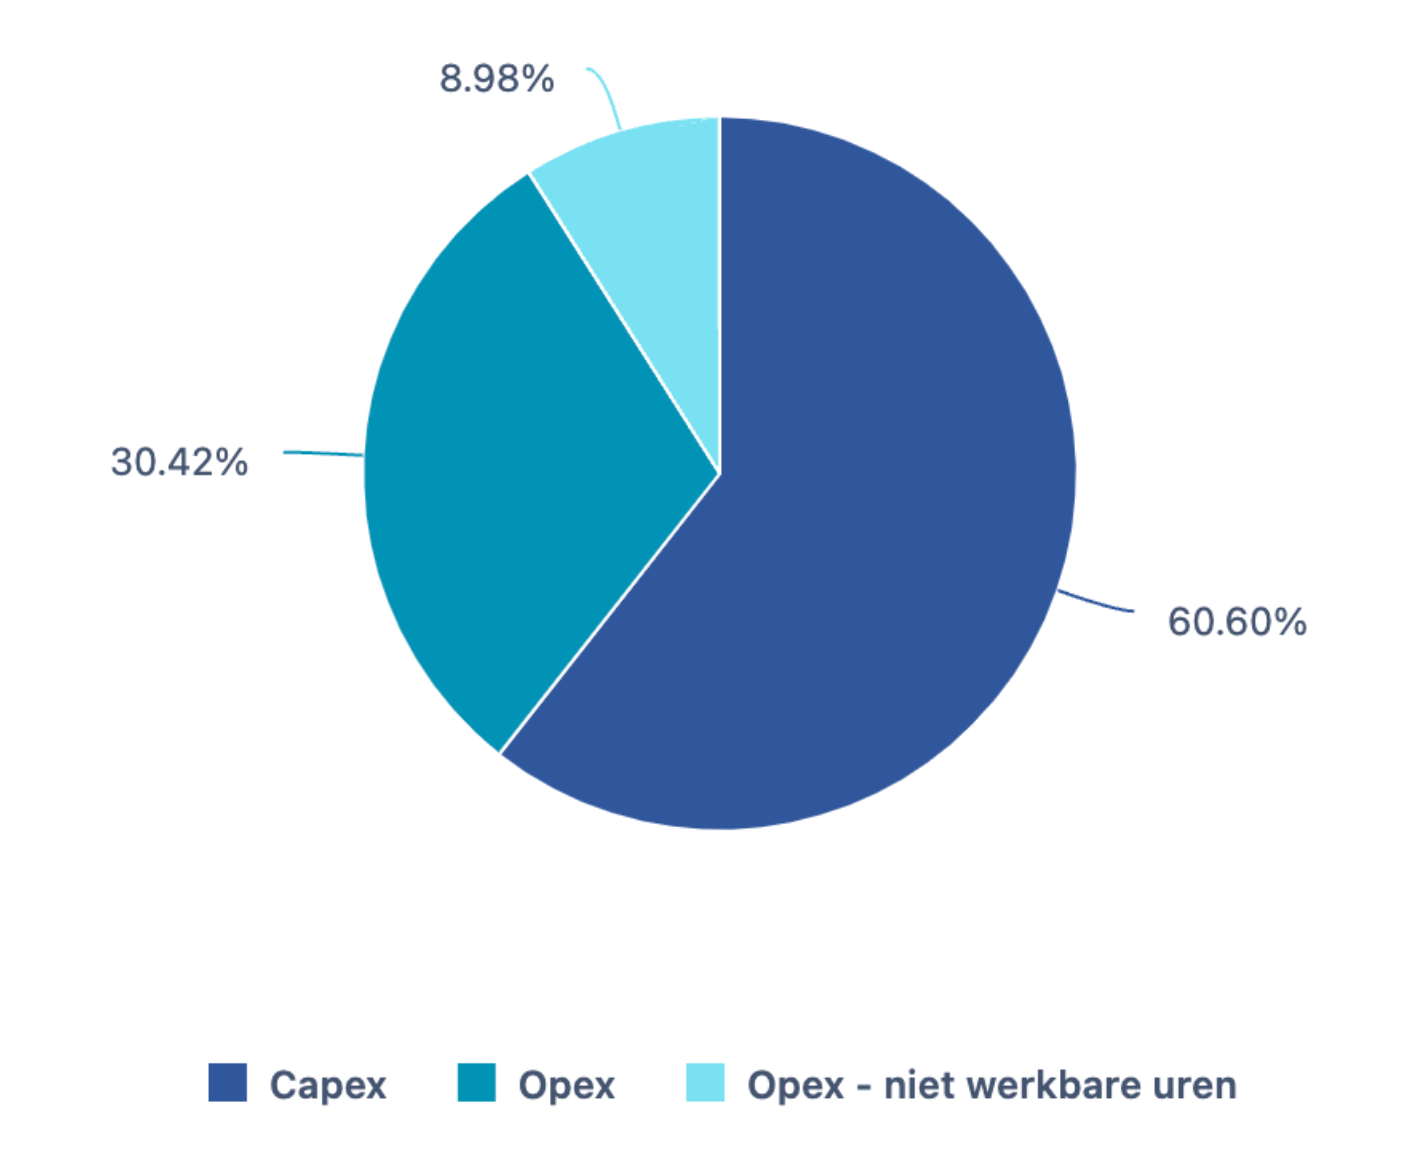
To address this, we examined the underlying data, which includes a custom field called the “IT number”. Many customers use a custom field in Jira issues to label which budget time spent on an issue belongs to. Our focus was on issues with missing values (indicated as "none" in the system).
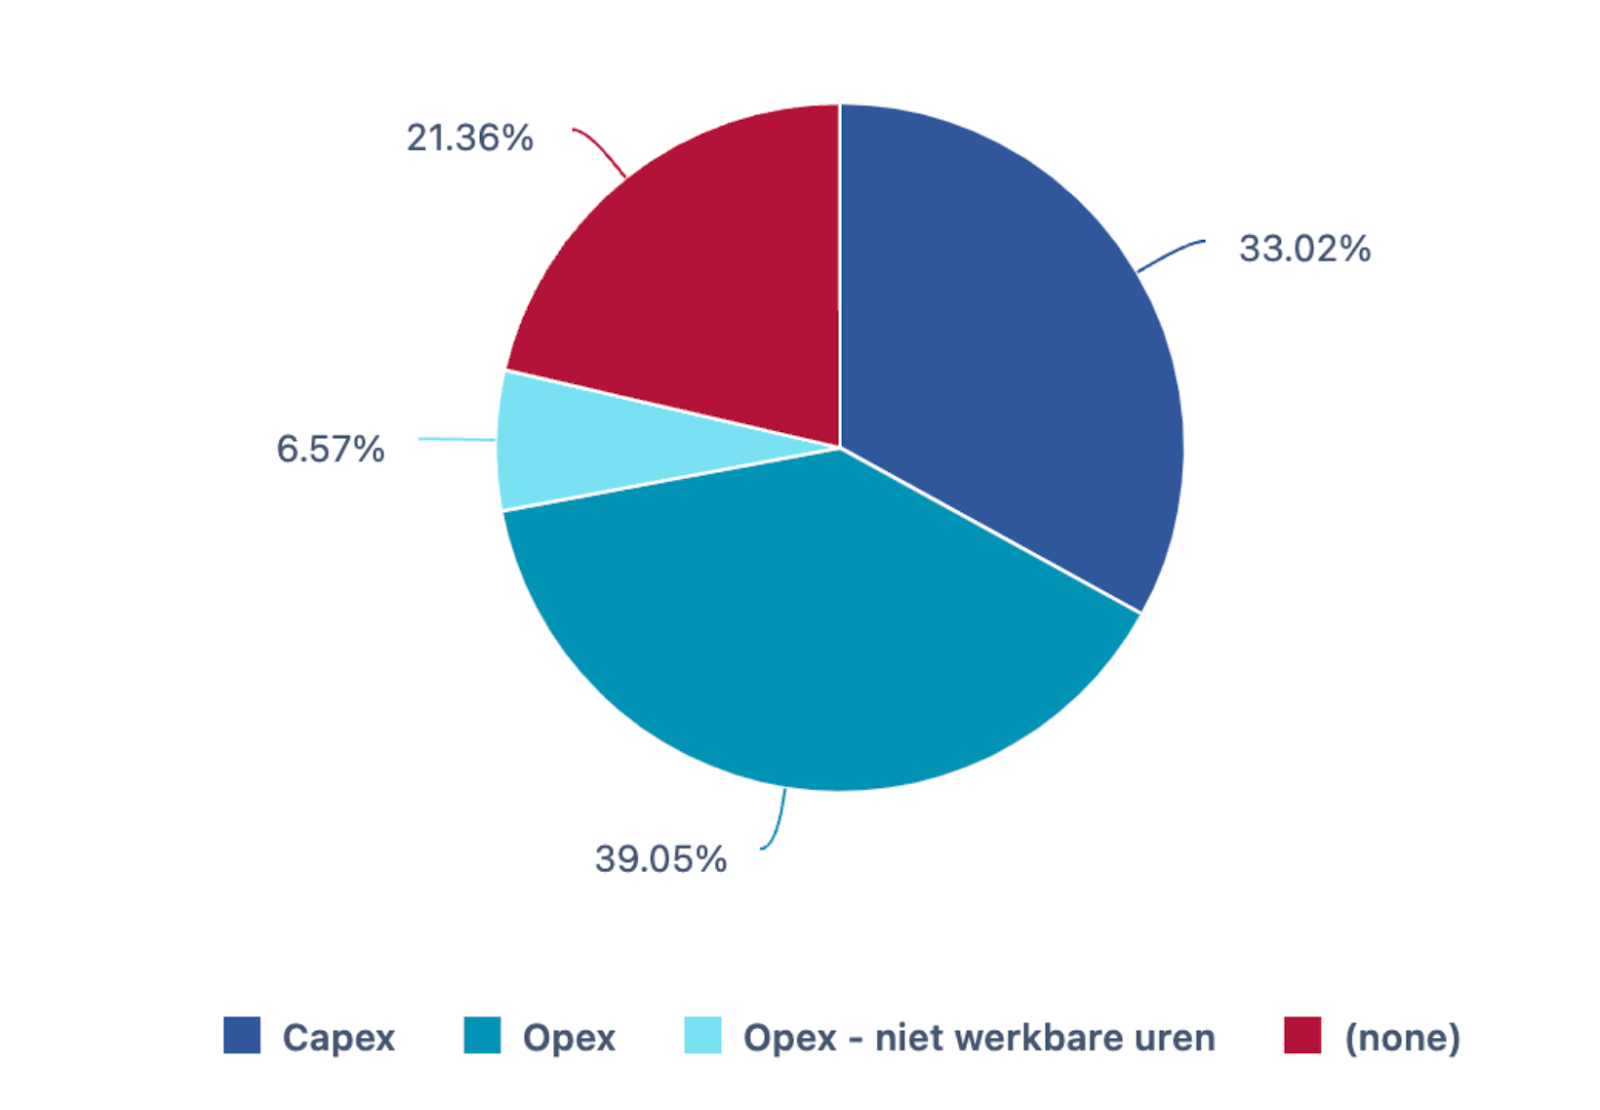
By identifying these "none" values, users can pinpoint issues lacking budget allocation data, correct them in Jira, and enhance data accuracy.
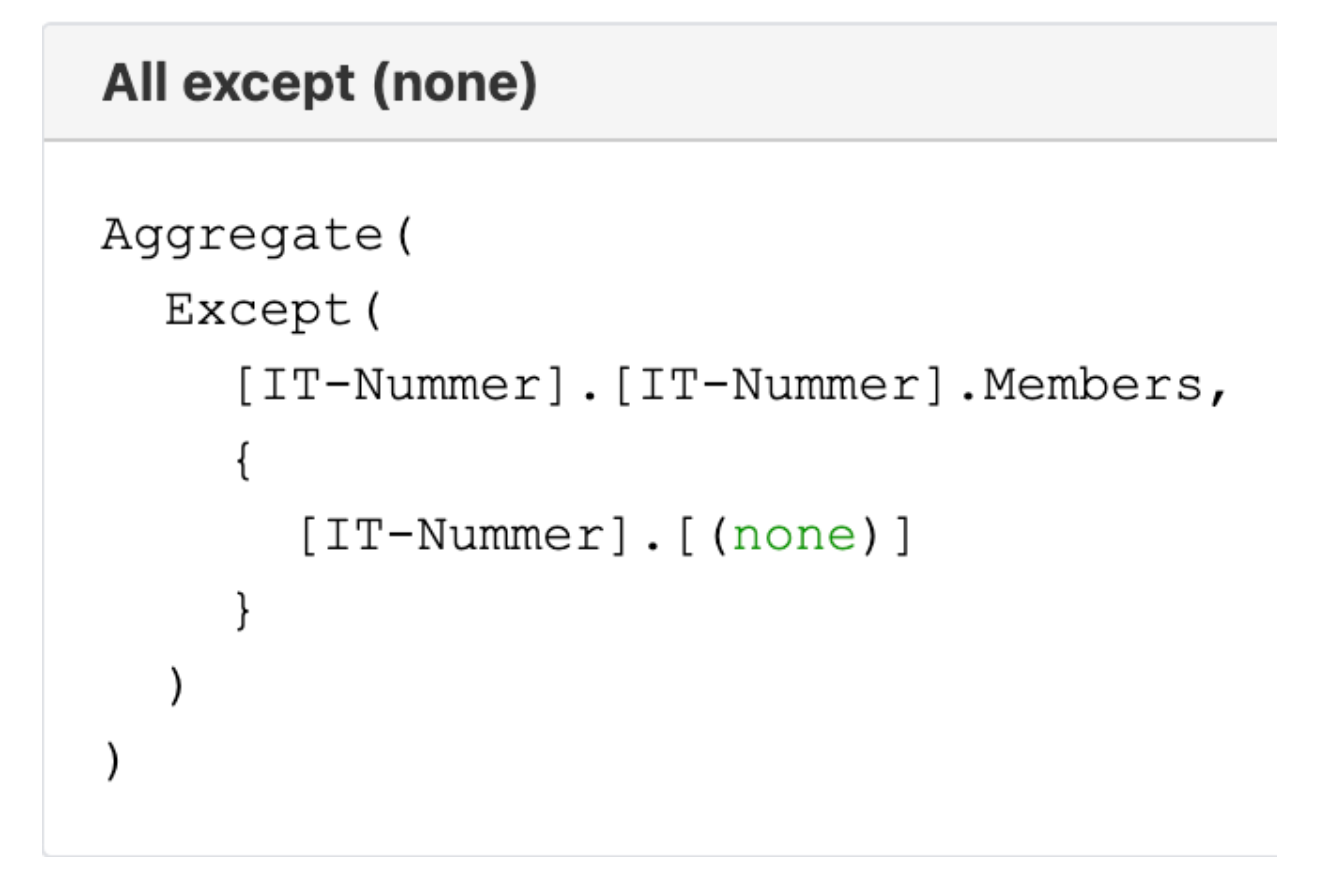
Once we identified missing values, we generated a report showing issues both with and without values. For that, a simple custom calculation grouped all other values (or all except “none” values).
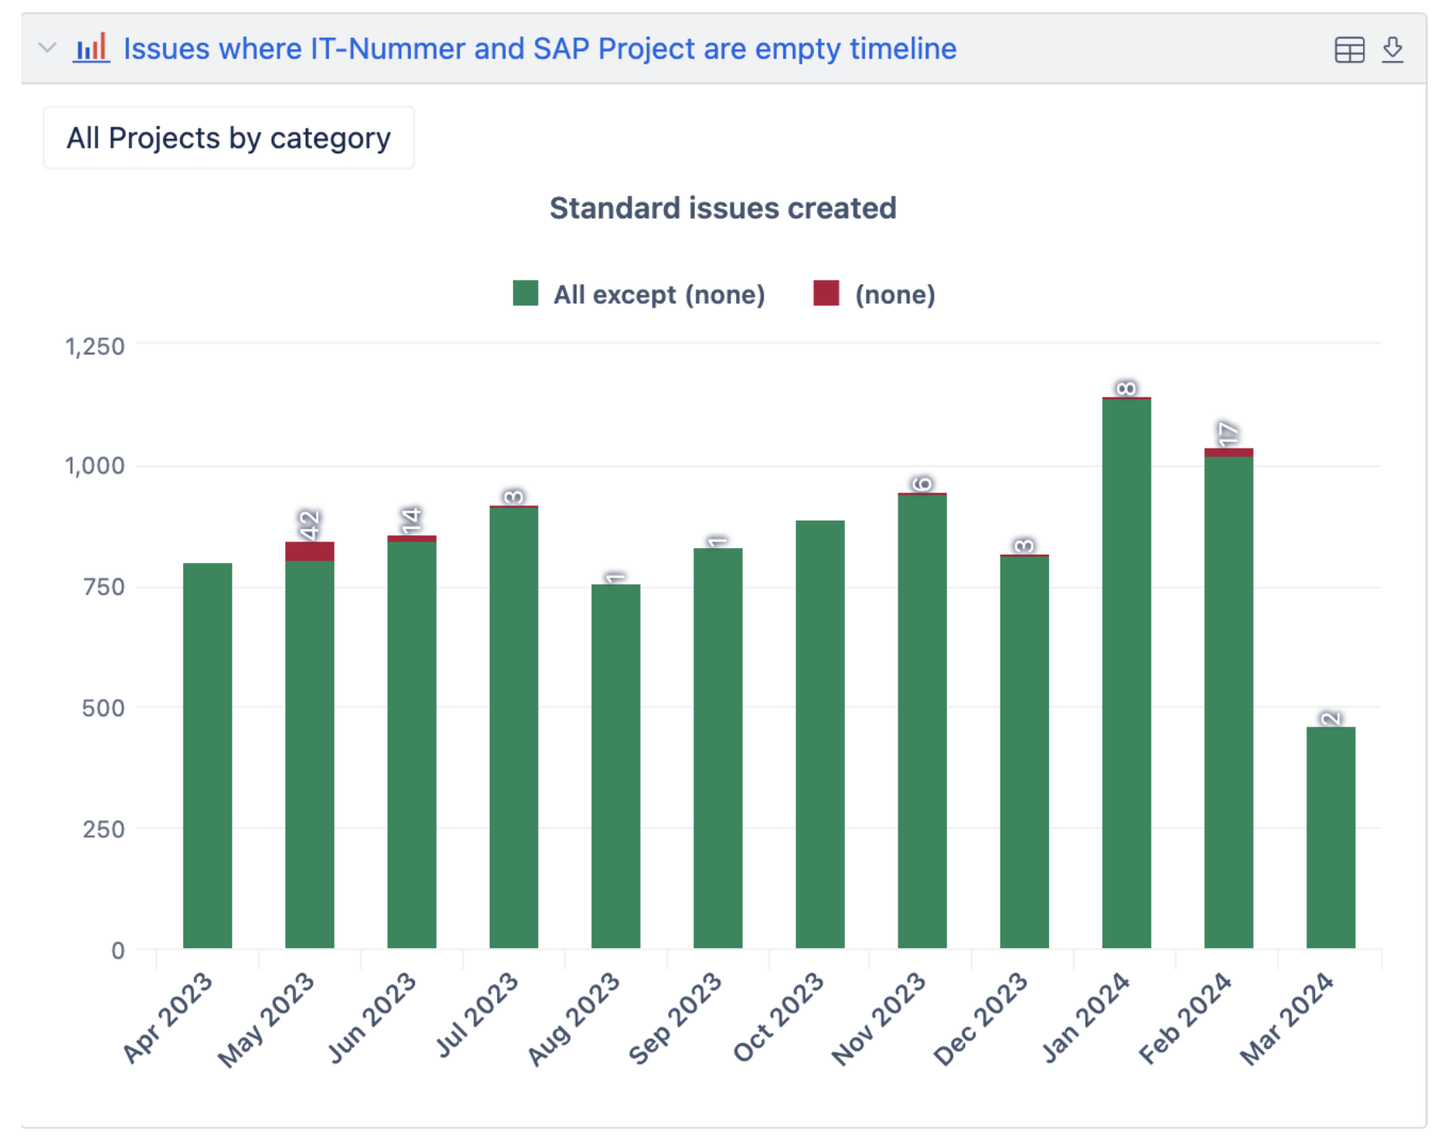
This overview helped the customer understand changes over time. Notably, around November, they switched from using the "Subproject" field to the "IT number" field, formalizing this transition
To streamline the process, we combined the “IT number” and “Subproject” fields into a single custom field using JavaScript. This improved performance and simplified reporting. Now, customers can quickly identify issues without budget allocation by clicking on the relevant sections in the report.
Through this process, the customer learned several key lessons:
-
Some issues lacked budget allocation due to external partners not using the correct field.
-
Projects closed with the old field were not updated to the new system, leading to gaps in data.
-
Organizational changes affected data allocation.
By using control reports to ensure data integrity, the customer could confidently make informed decisions and accurately track budget allocations.
Use Case #2: Handling Exceptions in Data
In the second use case, we focus on identifying exceptions in data, specifically regarding how employees log their hours. The task was to prevent employees from logging hours on projects or issues in Jira that were already closed. While it seems straightforward to implement a rule in Jira to prevent time logging on closed issues, the reality is more complex.
The workflow uses about 51 different statuses, but none of them are explicitly labeled as "closed." Instead, various terms like "Done," "Deployed," "Implemented," and even misspelled ones like "Canceled" are used.
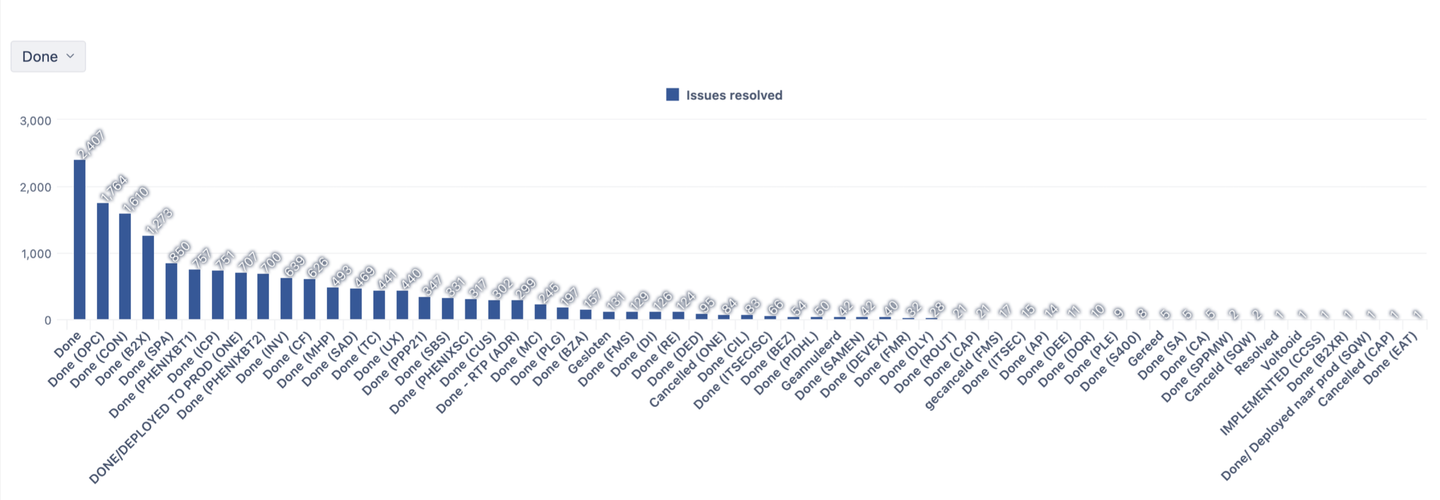
To tackle this, we used eazyBI and the concept of "tuples." A tuple allows you to quickly slice through your dataset by identifying where two dimensions intersect, focusing on the relevant data. Here, we used the "Transition status” category “Done" to find issues considered closed in the workflow.
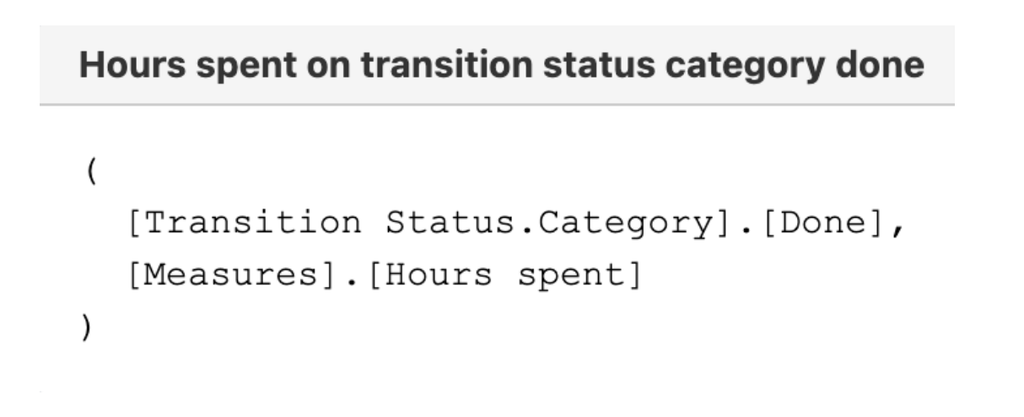
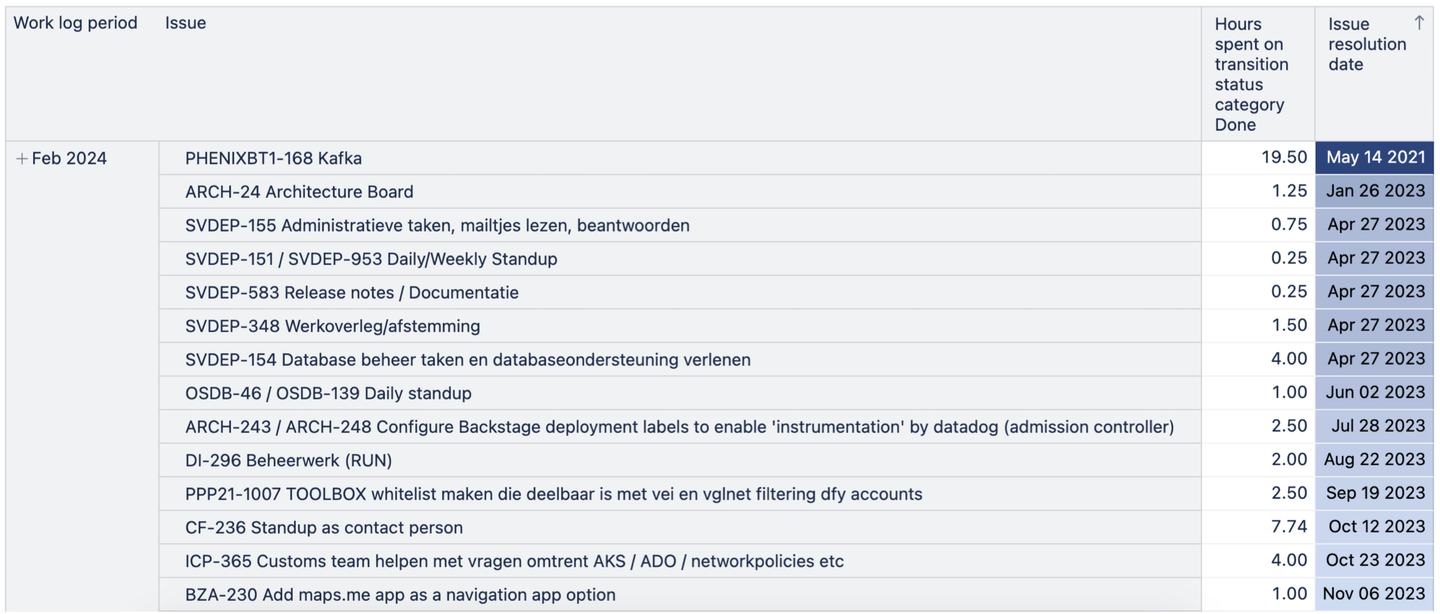
We created a report for February 2024, listing Jira issues where time was logged after they reached a closed status. We added a column to show the resolution date to highlight discrepancies between the logging date and the issue's closure date.
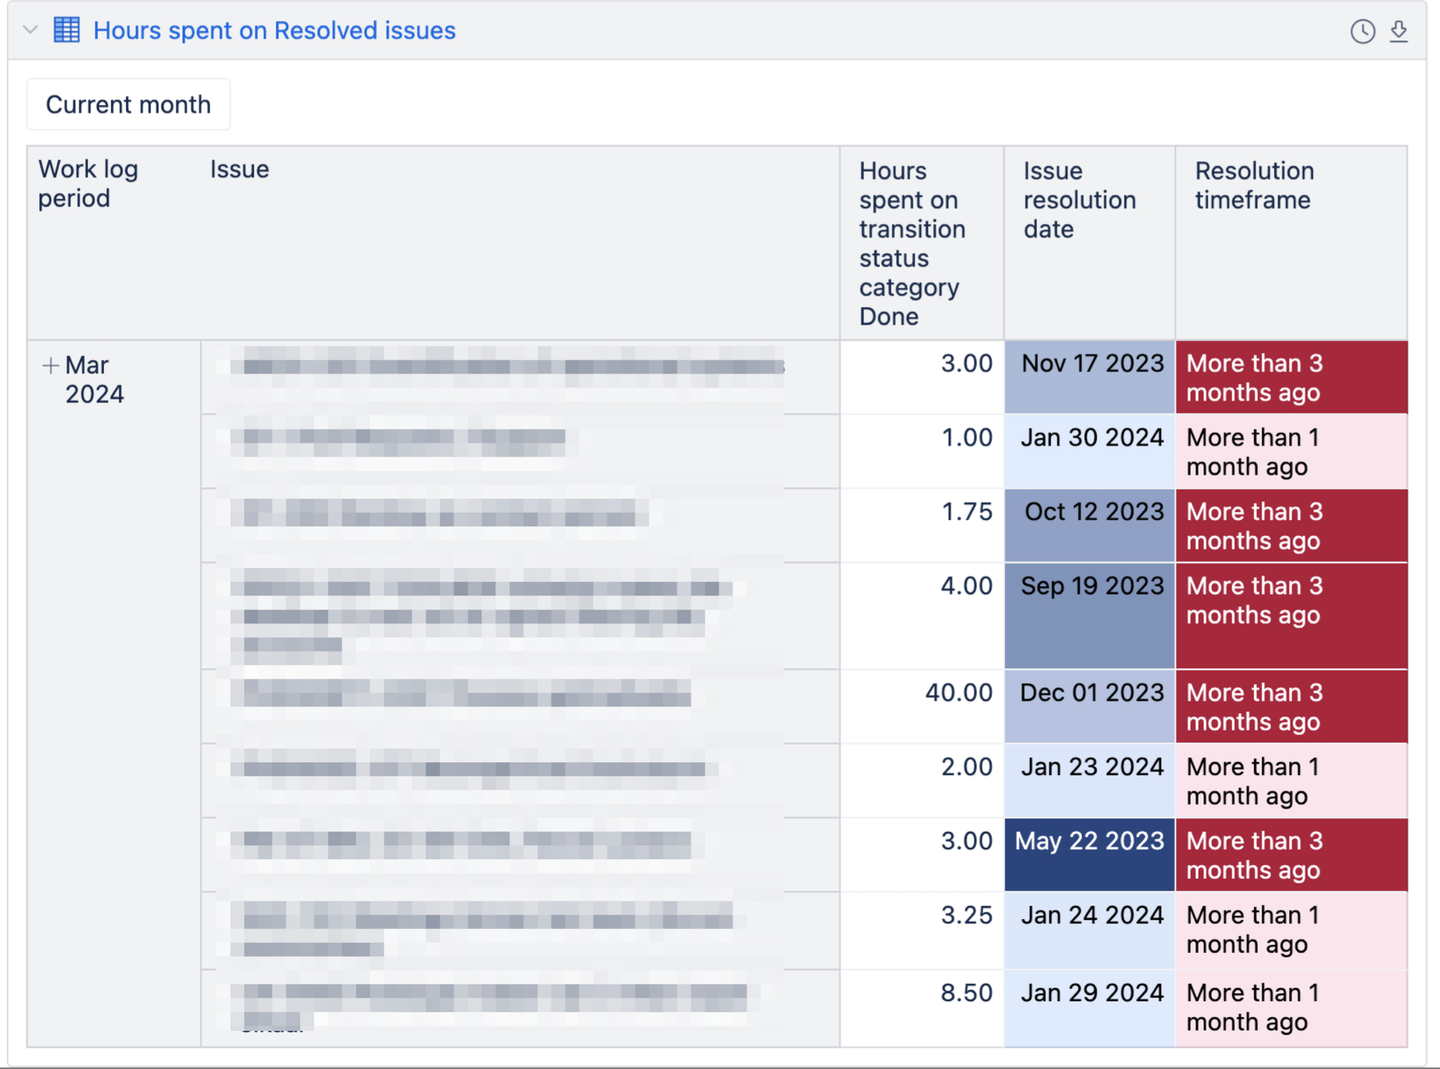
To make the report more user-friendly, we mapped the resolution timeframe with simple language interpretations, using MDX custom calculations. Displaying results in “human language” made it easier for users to understand at a glance. Adding colors helped key information stand out.
The client appreciated the clear overview and no longer needed to enforce strict rules in Jira to prevent logging time on closed issues. This approach effectively managed exceptions without complicating the workflow, providing a practical solution to a common problem.
Use Case #3: Deviations
In the final use case, let's tackle deviations in time registration, specifically focusing on leave registration. This scenario is complex because it involves data from multiple sources, including Jira, legacy systems, and external data sources for contract hours. We combine data from these different sources to get a comprehensive view of leave registration.
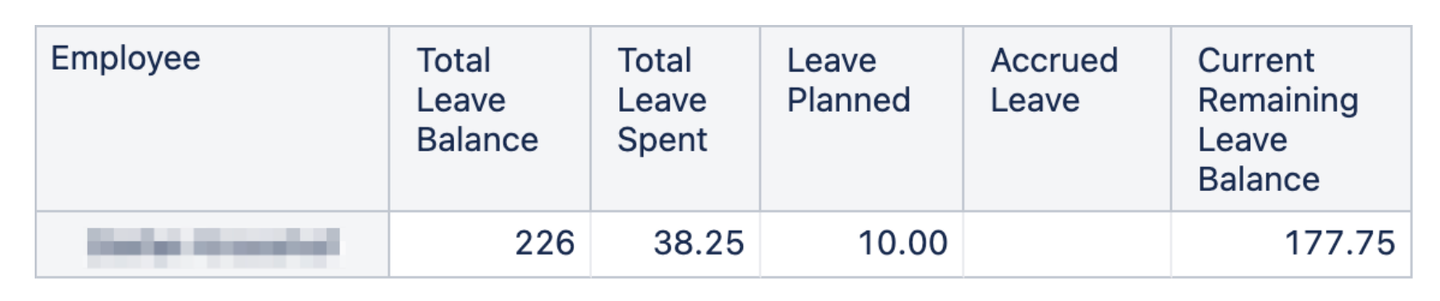
The report for end users shows the amount of leave each employee has for the year, how much has been spent, how much is planned, and the remaining balance. This helps employees track their leave usage throughout the year.
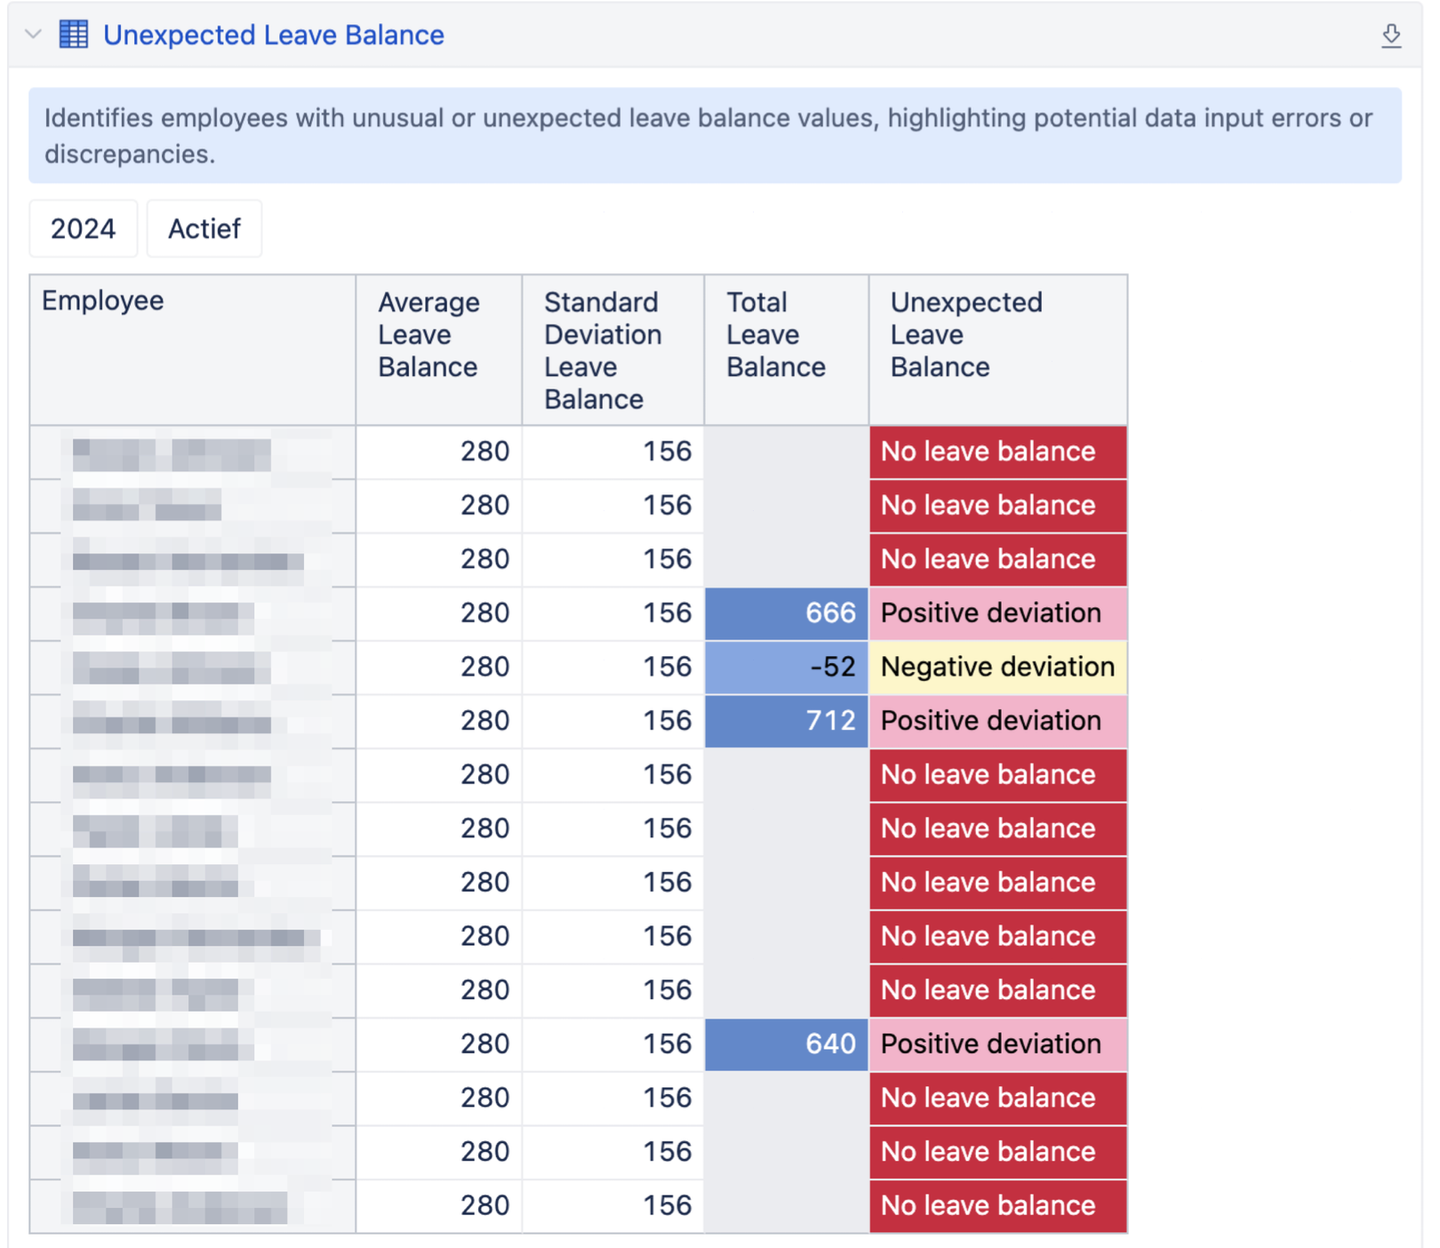
For HR managers, the challenge is to monitor leave balances for potentially hundreds of employees, each with different agreements and leave balances. Some employees plan meticulously, while others might be more spontaneous. This variability makes it difficult to assess the overall situation at a glance.
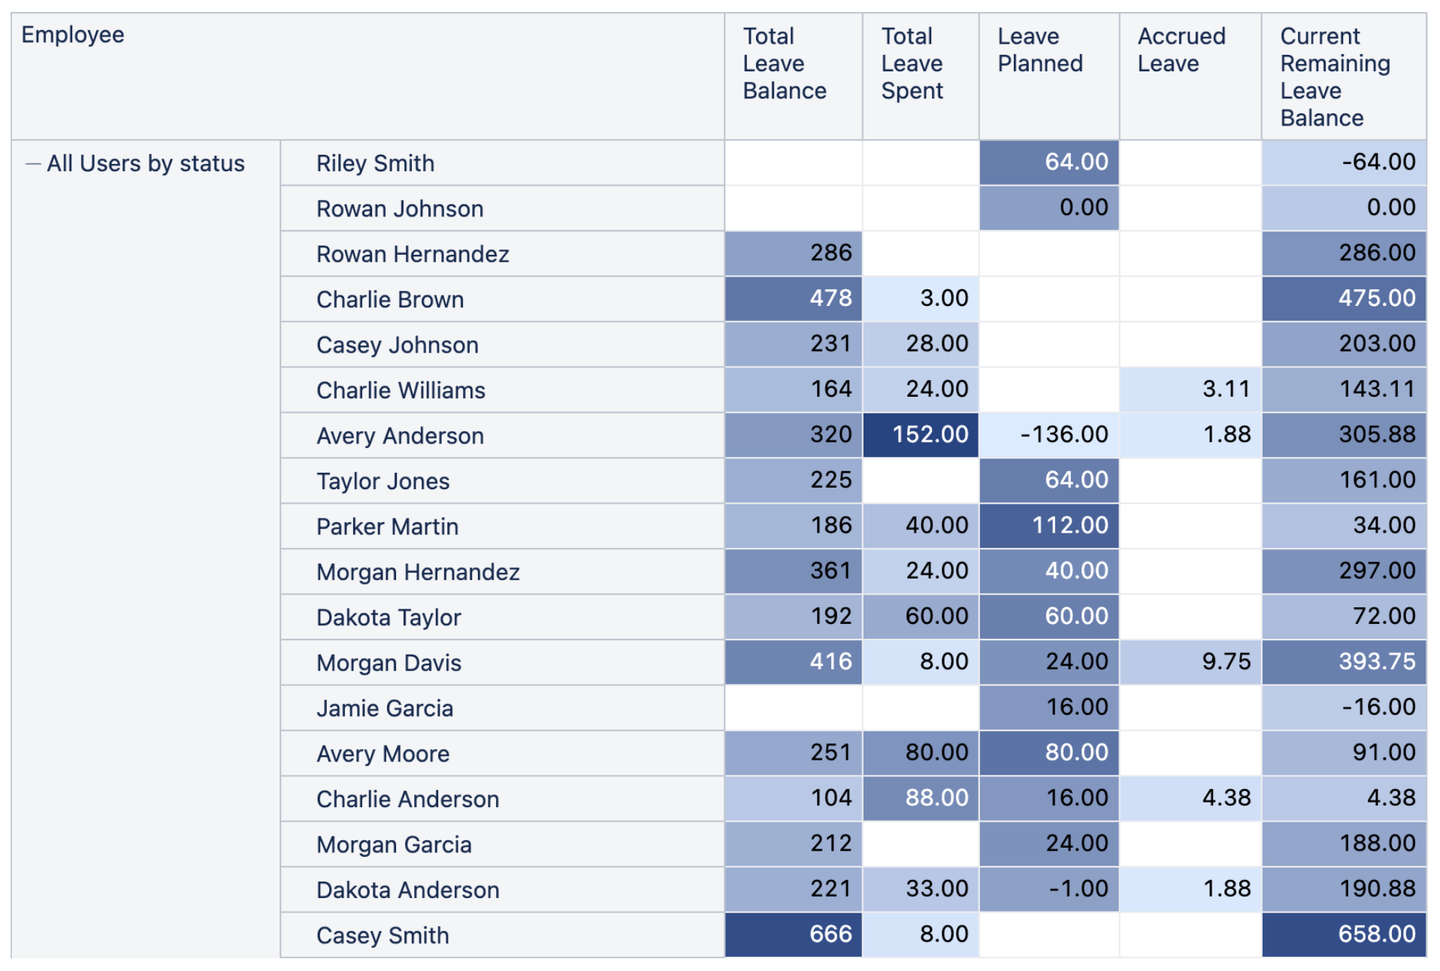
To simplify this process, we use averages and standard deviations to highlight outliers in the dataset.
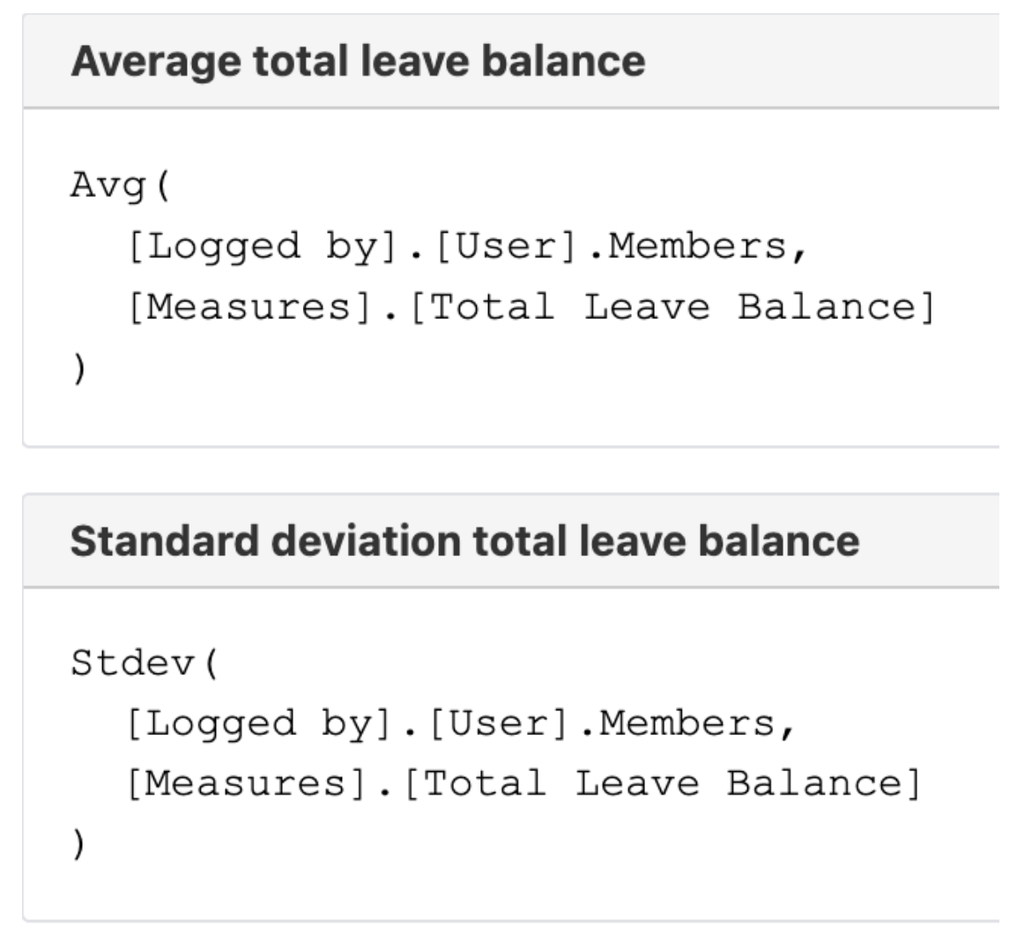
An additional column with human-readable language provides immediate context, indicating whether leave balances are above or below the expected baseline.
One key feature of this report is its ability to evolve over time. As averages and standard deviations change throughout the year, the report updates automatically, providing a real-time view of leave balances.
In addition to this report, HR managers have access to a comprehensive dashboard combining various reports. This allows them to quickly identify action points, such as updating leave balances for the current year or entering contract hours for new employees.
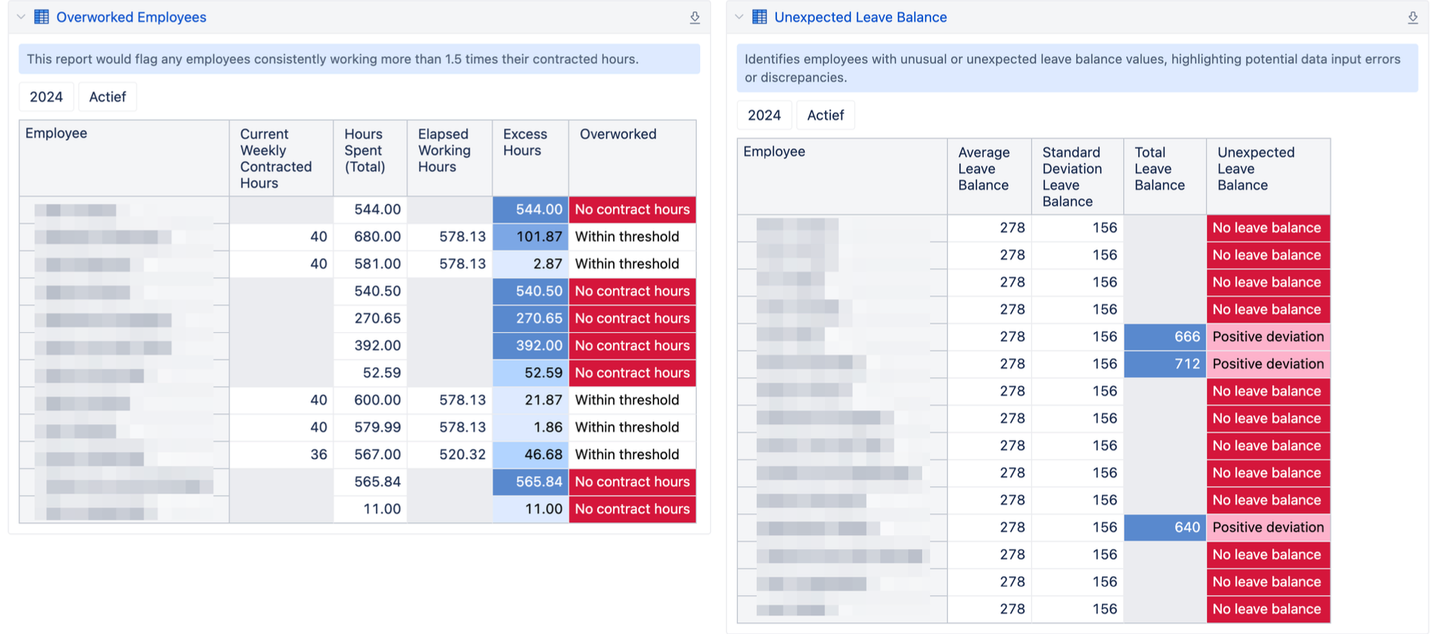
The goal is to make the reporting process intuitive and effective, even for those hesitant to use new tools. By providing clear insights and actionable data, HR managers can better manage leave registration and promptly address discrepancies.
Summary and Key Takeaways
While control reports use different techniques, the underlying concepts are straightforward. The focus is on adding context to reports, making them more understandable. Simple actions, like indicating whether a result is positive or negative, help users quickly grasp the information. Using colors can further enhance clarity, preventing users from feeling overwhelmed by numbers.
From these experiences, we've learned that reality is often messy, and control can seem elusive. However, by zooming in on the chaos and explaining it clearly, we can achieve a sense of control and peace of mind and regain trust in the data. Control reporting plays a crucial role in this process, helping to clarify and manage data and representing our complex realities in an understandable and meaningful way.
If you’re more of a video person, feel free to watch the recording of Stefan's presentation from eazyBI Community Days 2024.
Join us for eazyBI Community Days 2025 in Riga on May 22-23. Two days full of expert talks, product news, case studies, networking and much more. Register now to secure the best deal on your event pass!