
Tracking SAFe Progress with Easy Agile and eazyBI
A program increment dashboard for product managers, release engineers, and teams working in SAFe (Scaled Agile Framework) is essential to plan, track, and analyze their work.
Easy Agile is an Australian company that helps organizations adopt SAFe practices more easily. Data from Easy Agile app Programs, a tool designed to help with planning and tracking work in an Agile way, can be used together with eazyBI Reports and Charts for Jira to create easy-to-access, interactive dashboards for SAFe.
What is Easy Agile Programs?
Easy Agile Programs is an app that helps teams plan and manage their work more effectively, especially for those following the SAFe method. It’s built directly into Jira, making it easy for teams to use without needing to switch between different tools.
Here’s how Easy Agile Programs works, broken down into three main views:
- Roadmap view: get a high-level overview of your work, dependencies, and timelines. This is great for keeping stakeholders informed and aligning teams around what needs to be done.
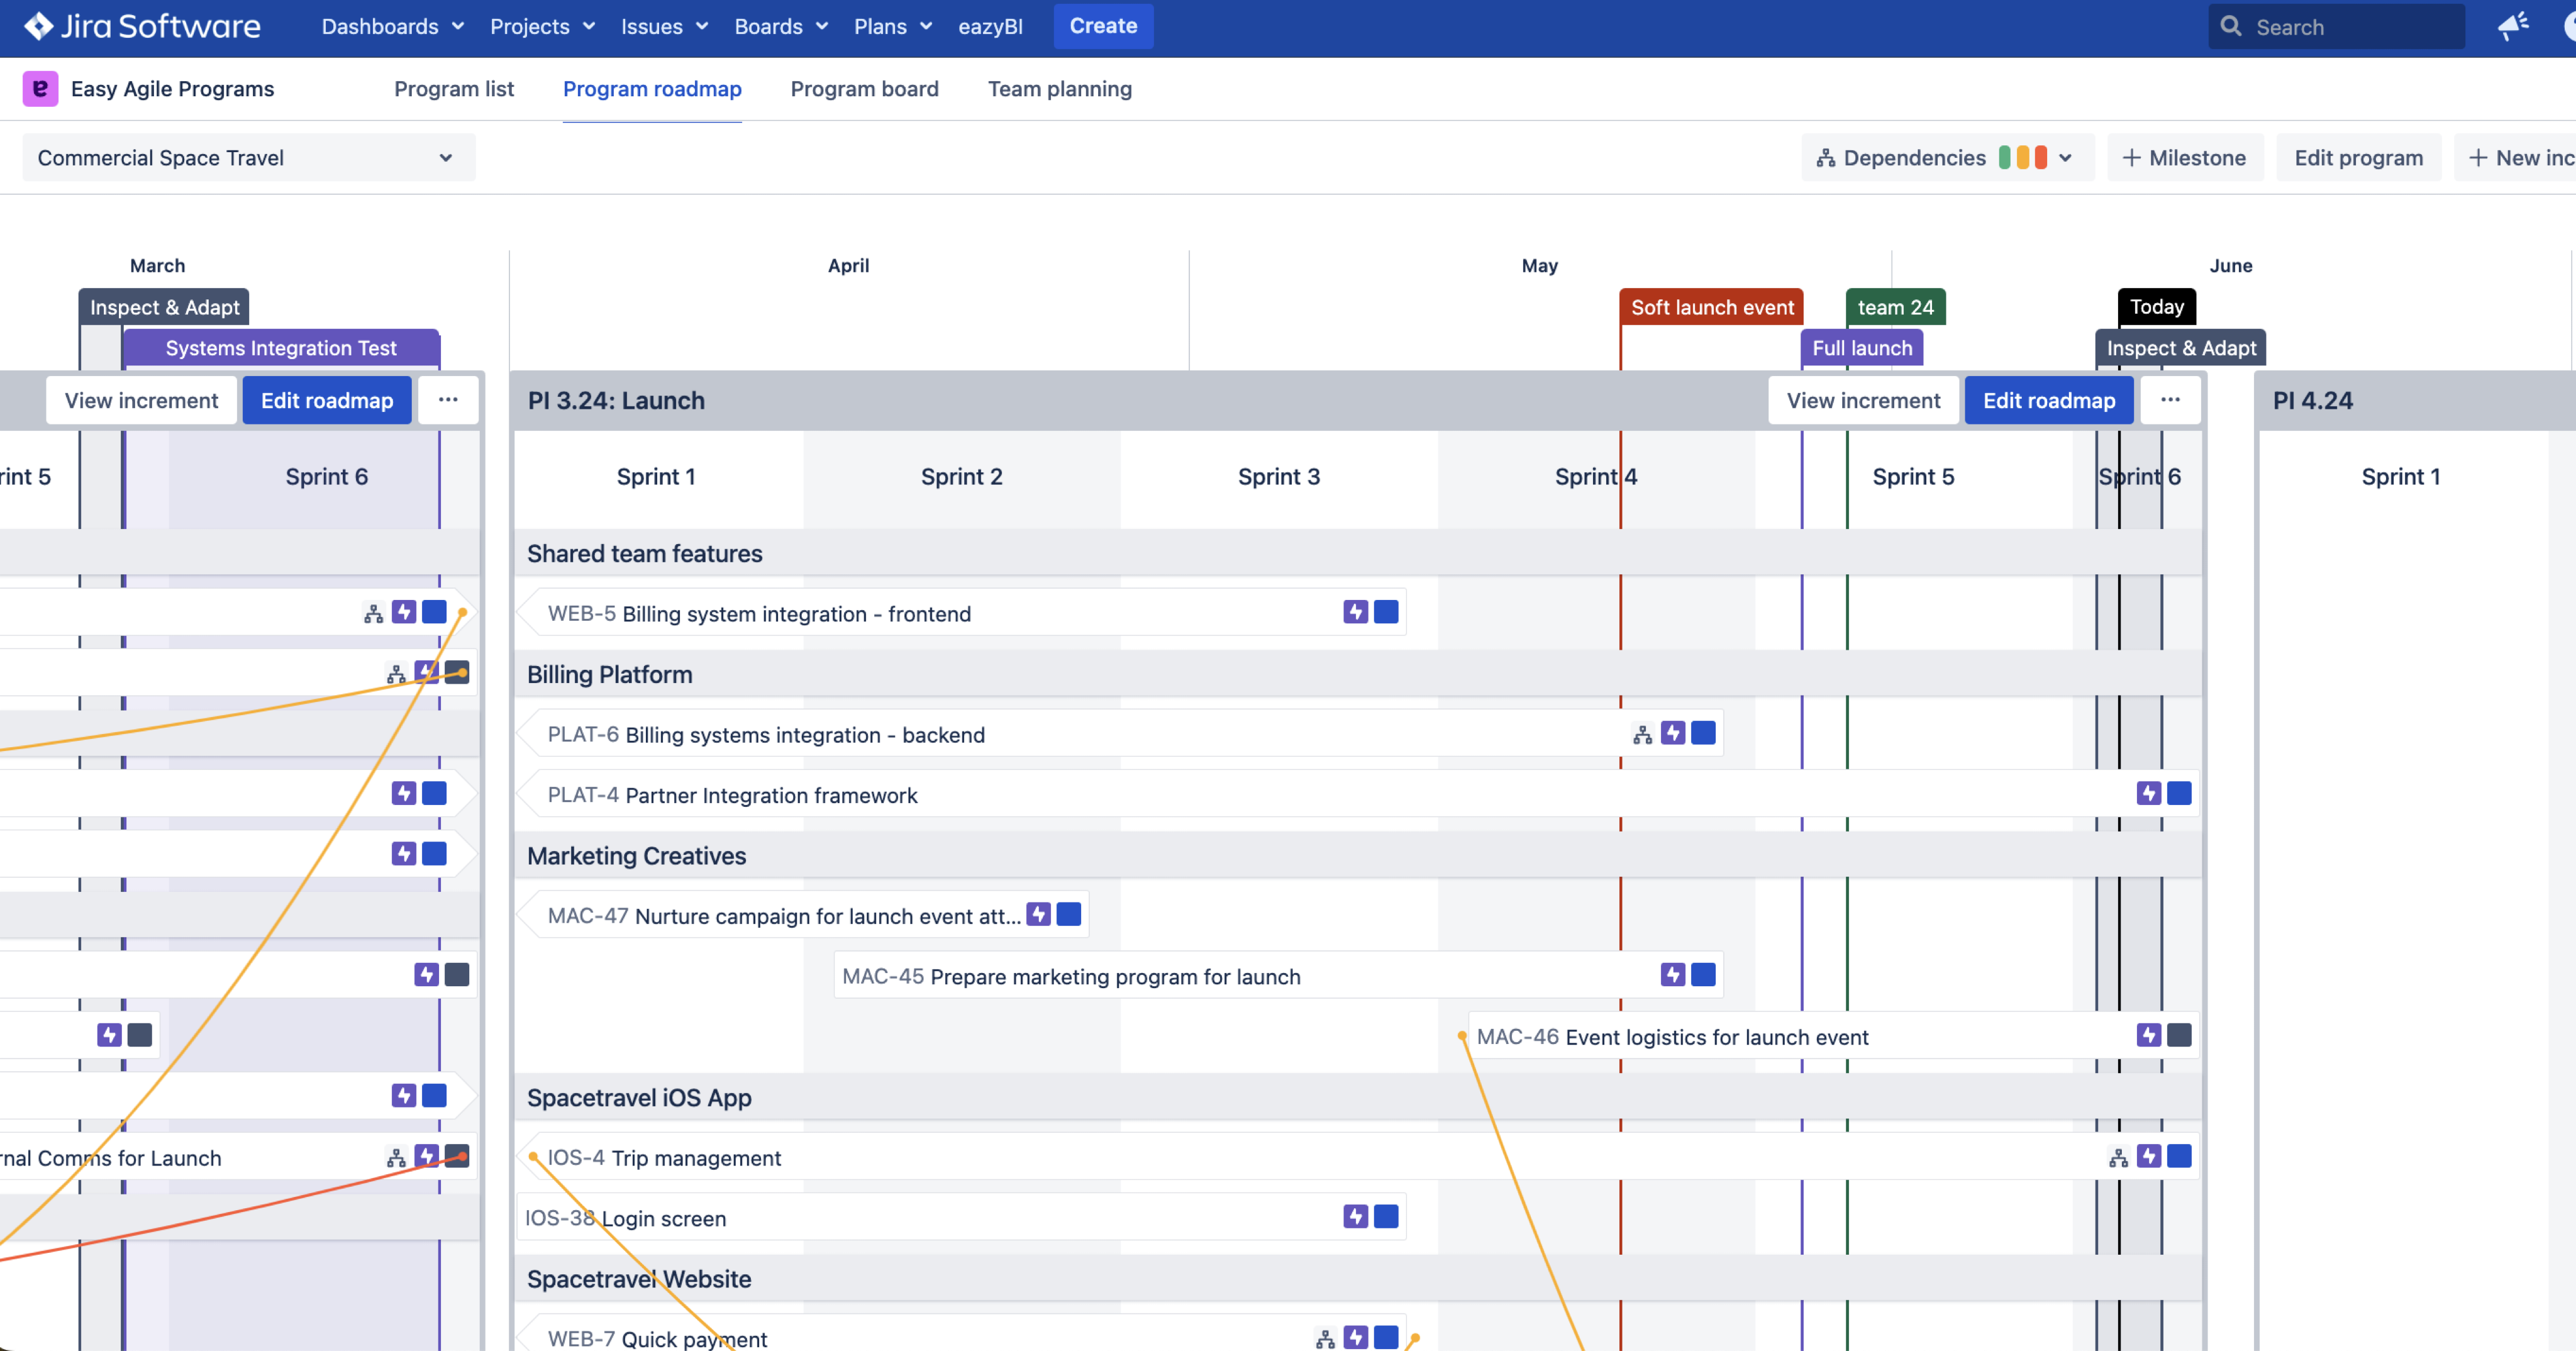
- Program board: this is where detailed planning takes place. It helps you organize work for upcoming releases, resolve dependencies, and adjust plans as needed.
- Team planning: teams can plan and adjust their tasks collaboratively, all while keeping everything synced in Jira, so everyone stays on the same page.
Keeping Track of Progress
For release train engineers and product managers, data from the Easy Agile Programs app can be integrated with the eazyBI Reports and Charts app to create a dashboard for Program Increment (PI). This dashboard helps answer important questions like “Are we on track?” “What capacity do we have?” or “How do we move things around?” and is useful for weekly meetings or progress reports for stakeholders.
Data Collection and Integration
eazyBI integrates seamlessly not only with Jira, but also with various Marketplace apps, making it easy to gather the data you need to track your team’s progress. It allows to pull data from apps like Easy Agile Program.
In Jira, Easy Agile Program app creates two custom fields: "Program Increment", which is multi-value field, and "Program". These fields can later be used as filters on your dashboard, enabling better segmentation and a more granular view of the reports.
To prepare these custom fields for analysis, you need to configure them in eazyBI’s advanced settings so the tool knows how to treat them—as dimensions, in this case.
Once that’s done, these fields can be used in various reports and filters on your dashboard.
Another crucial aspect of PI reporting is limiting the reports to reflect the accurate timeframe, from the start of the first sprint to the end of the last sprint in the Program Increment. For this, you can leverage the REST API to import start and end dates for each Program Increment based on sprint dates.
The data import from the Program app can be set up and defined once; the changes will be imported incrementally and automatically, so your dashboard is always up to date.
The PI Dashboard Setup
The Program Increment dashboard will consist of several key reports that give a comprehensive overview of progress across your Agile initiatives.
Program and Program Increment, as well as Sprints, are set as filters in this dashboard; for instance, when selecting a specific Program Increment, data about this PI is displayed instantly.
- Program Increment Overview contains several key performance indicators as bare numbers (using the Gauge chart option).
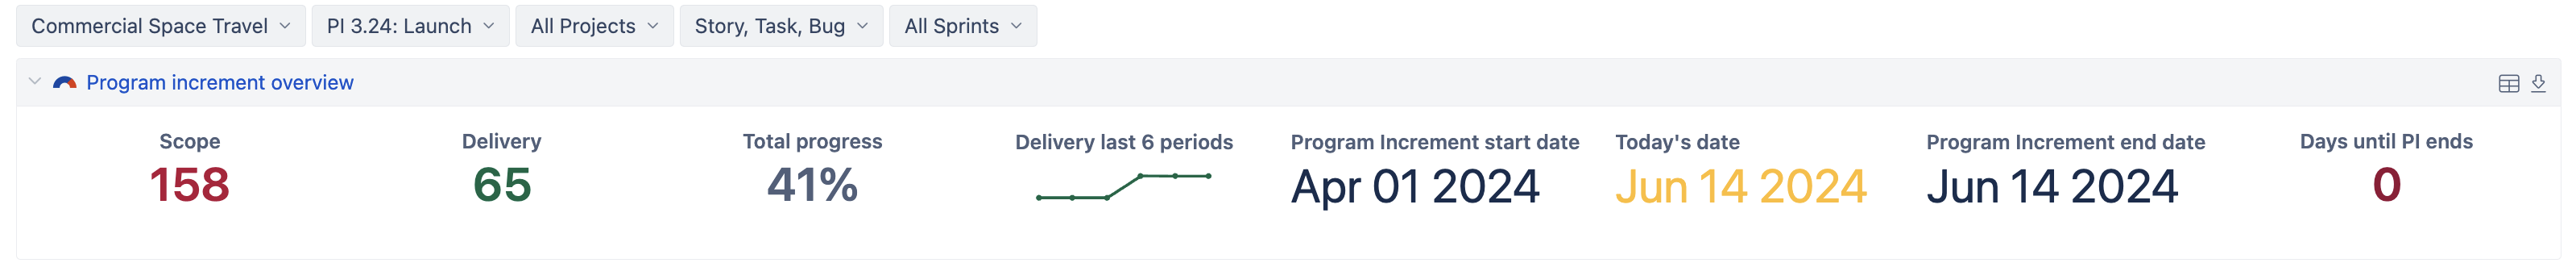
Scope tracks the total number of issues in the Program Increment. Delivery reflects the number of resolved issues, giving a sense of how much work has been completed. Total progress is a ratio that compares delivery versus the total scope, giving you a high-level view of the overall completion percentage. A small, automatically generated chart shows delivery trends over time. The added PI timeframe allows to display Start and End Dates of the PI. Days until PI ends is a countdown of how much time is left until the PI ends so you can focus more when the release date is approaching.
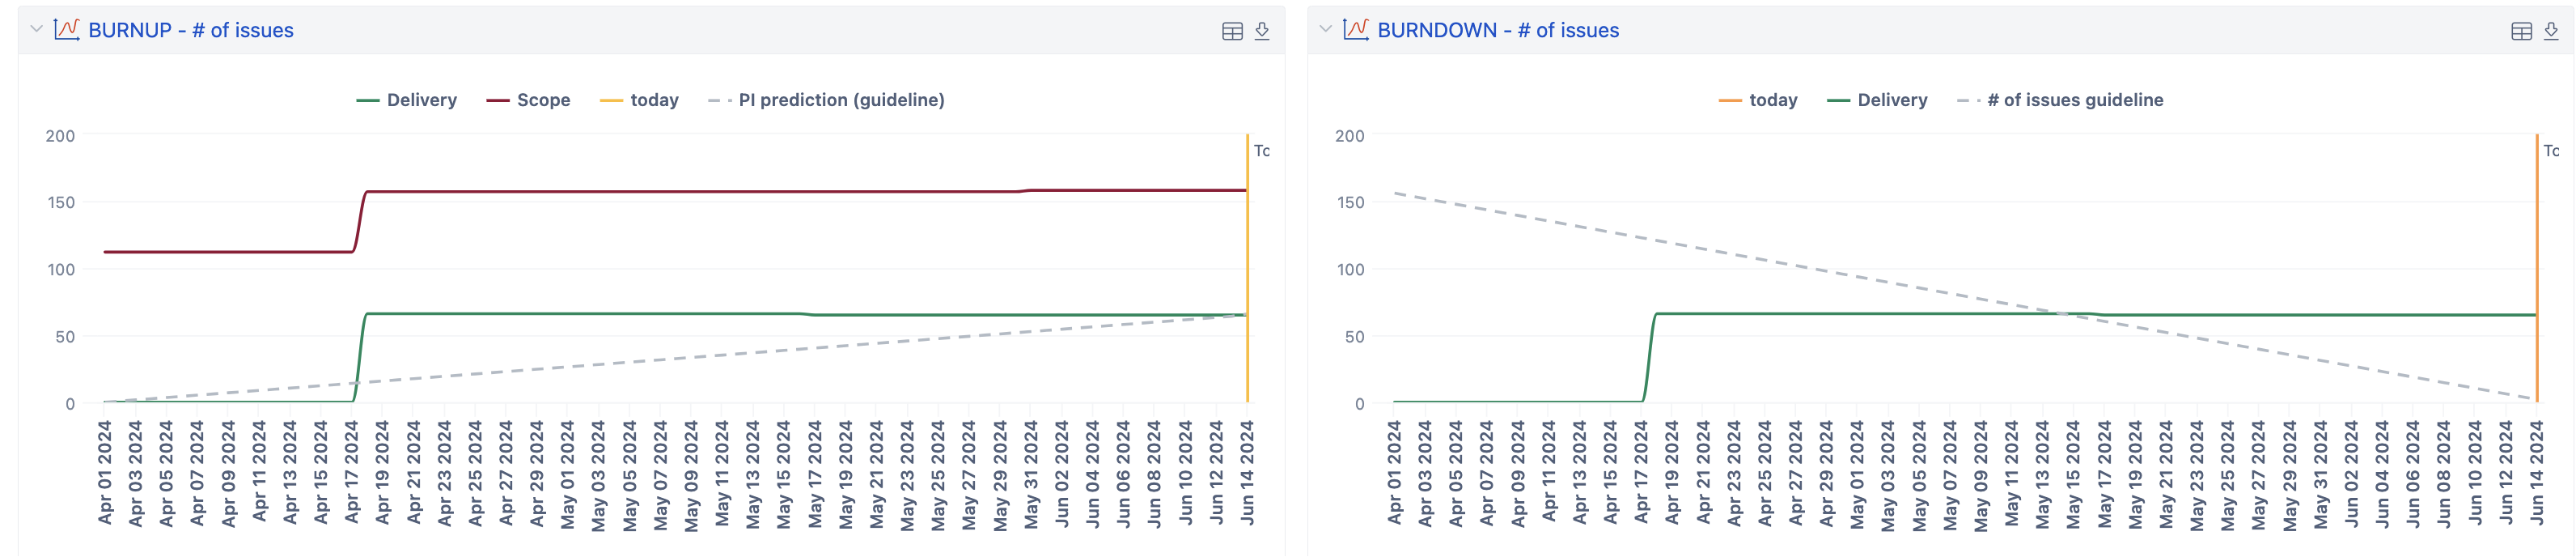
- Program Increment Burn-up and Burn-down reports provide a day-by-day breakdown of scope and delivery. They highlight the current date to give a real-time view of where you stand versus your planned milestones. PI timeframes allow you to display guidelines, and these charts can show whether you’re on track or lagging behind schedule.
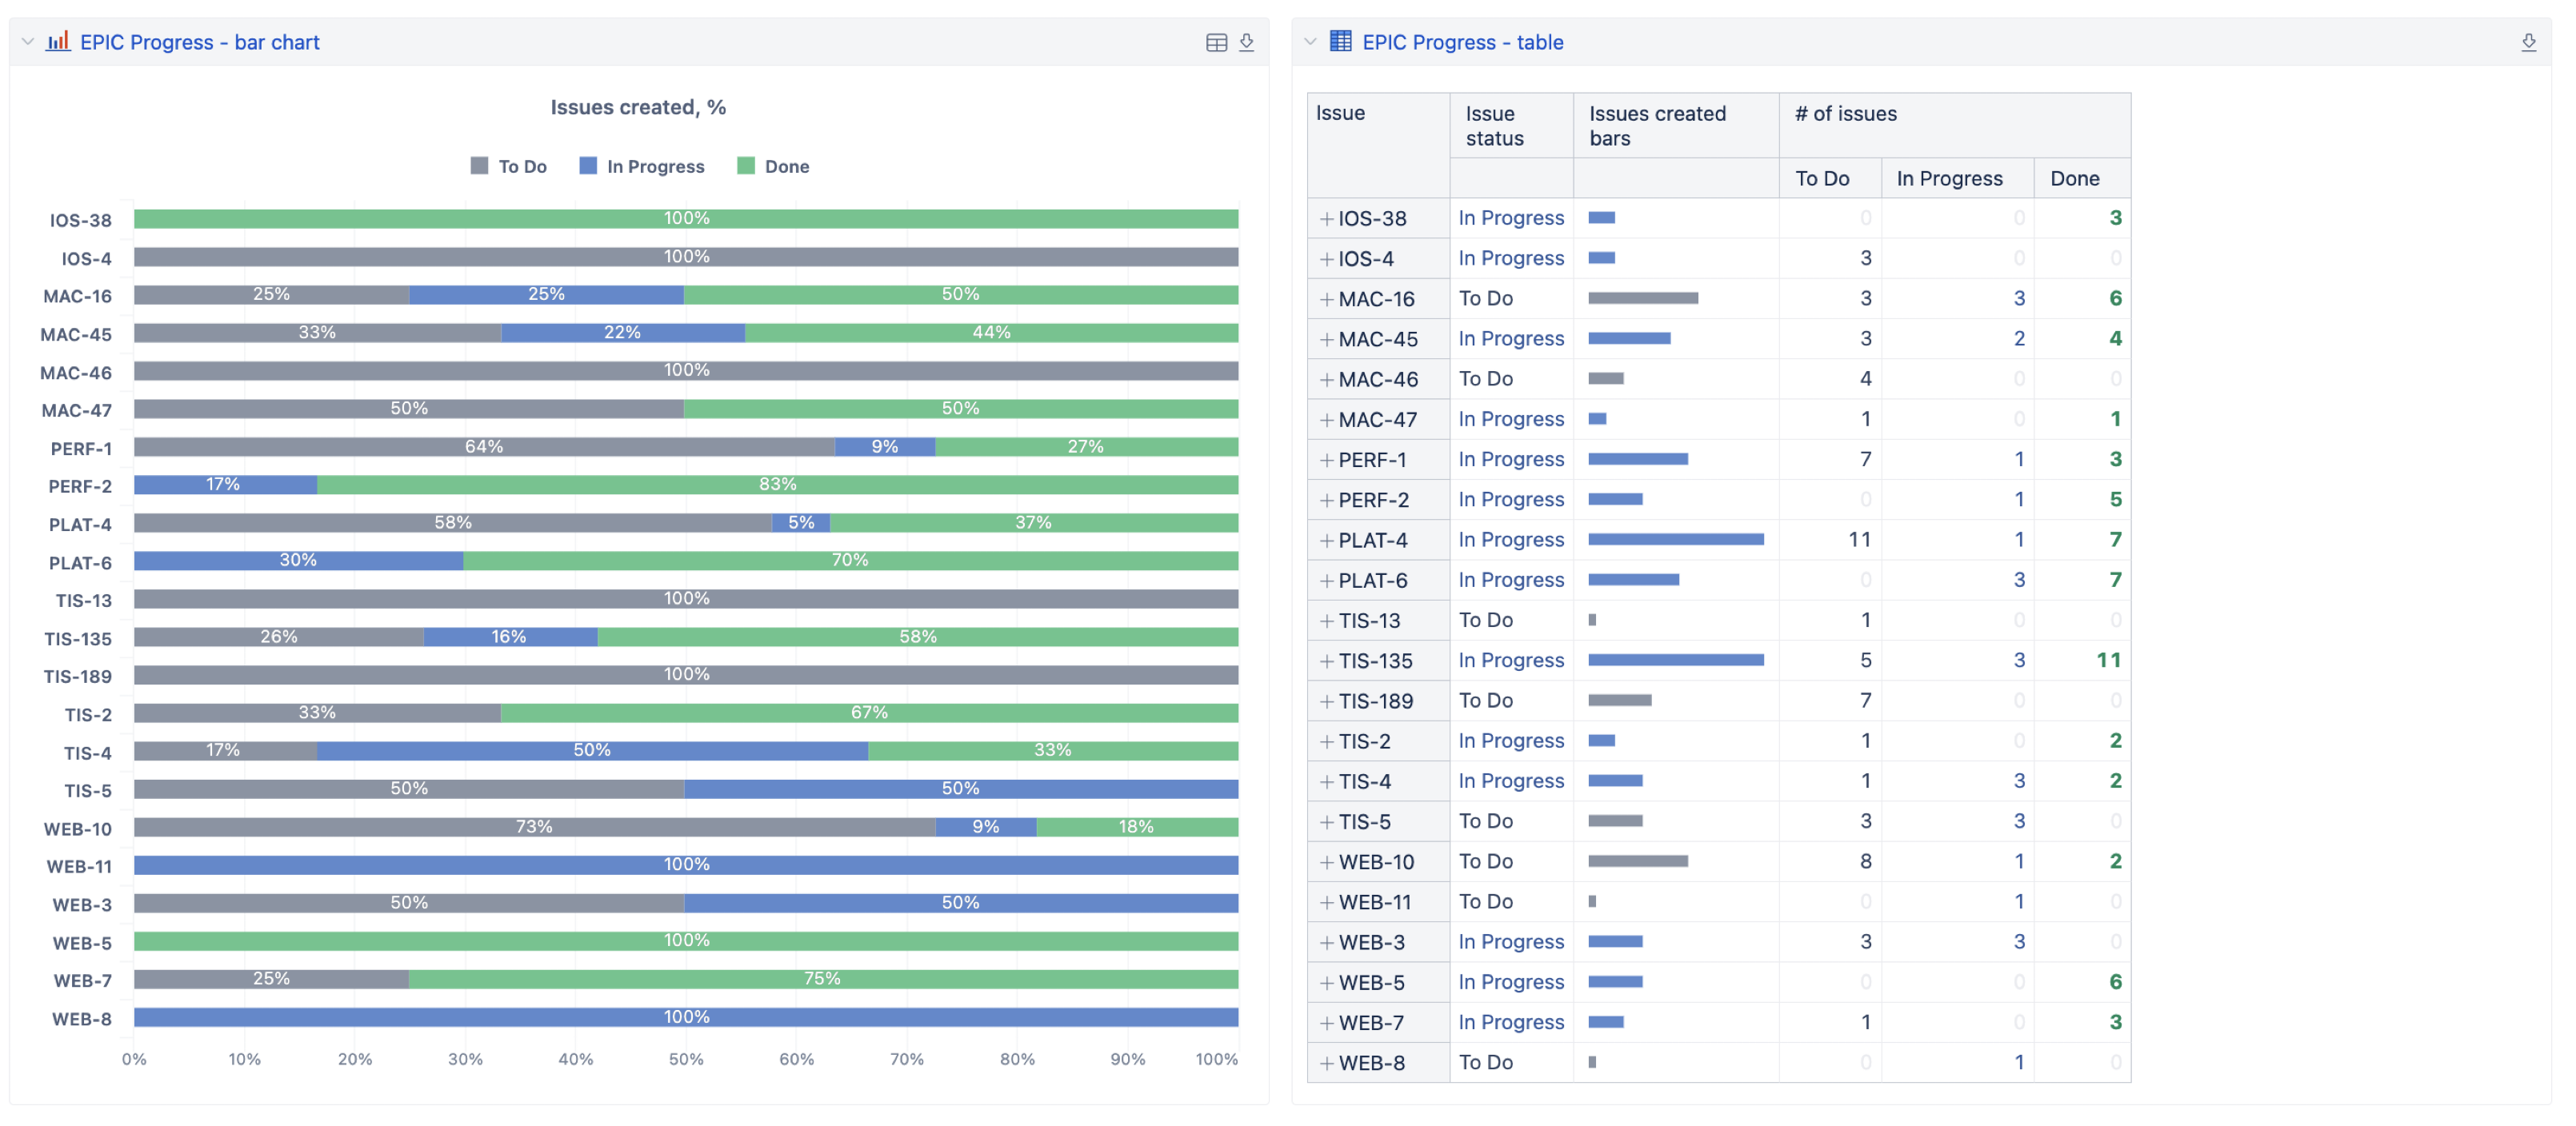
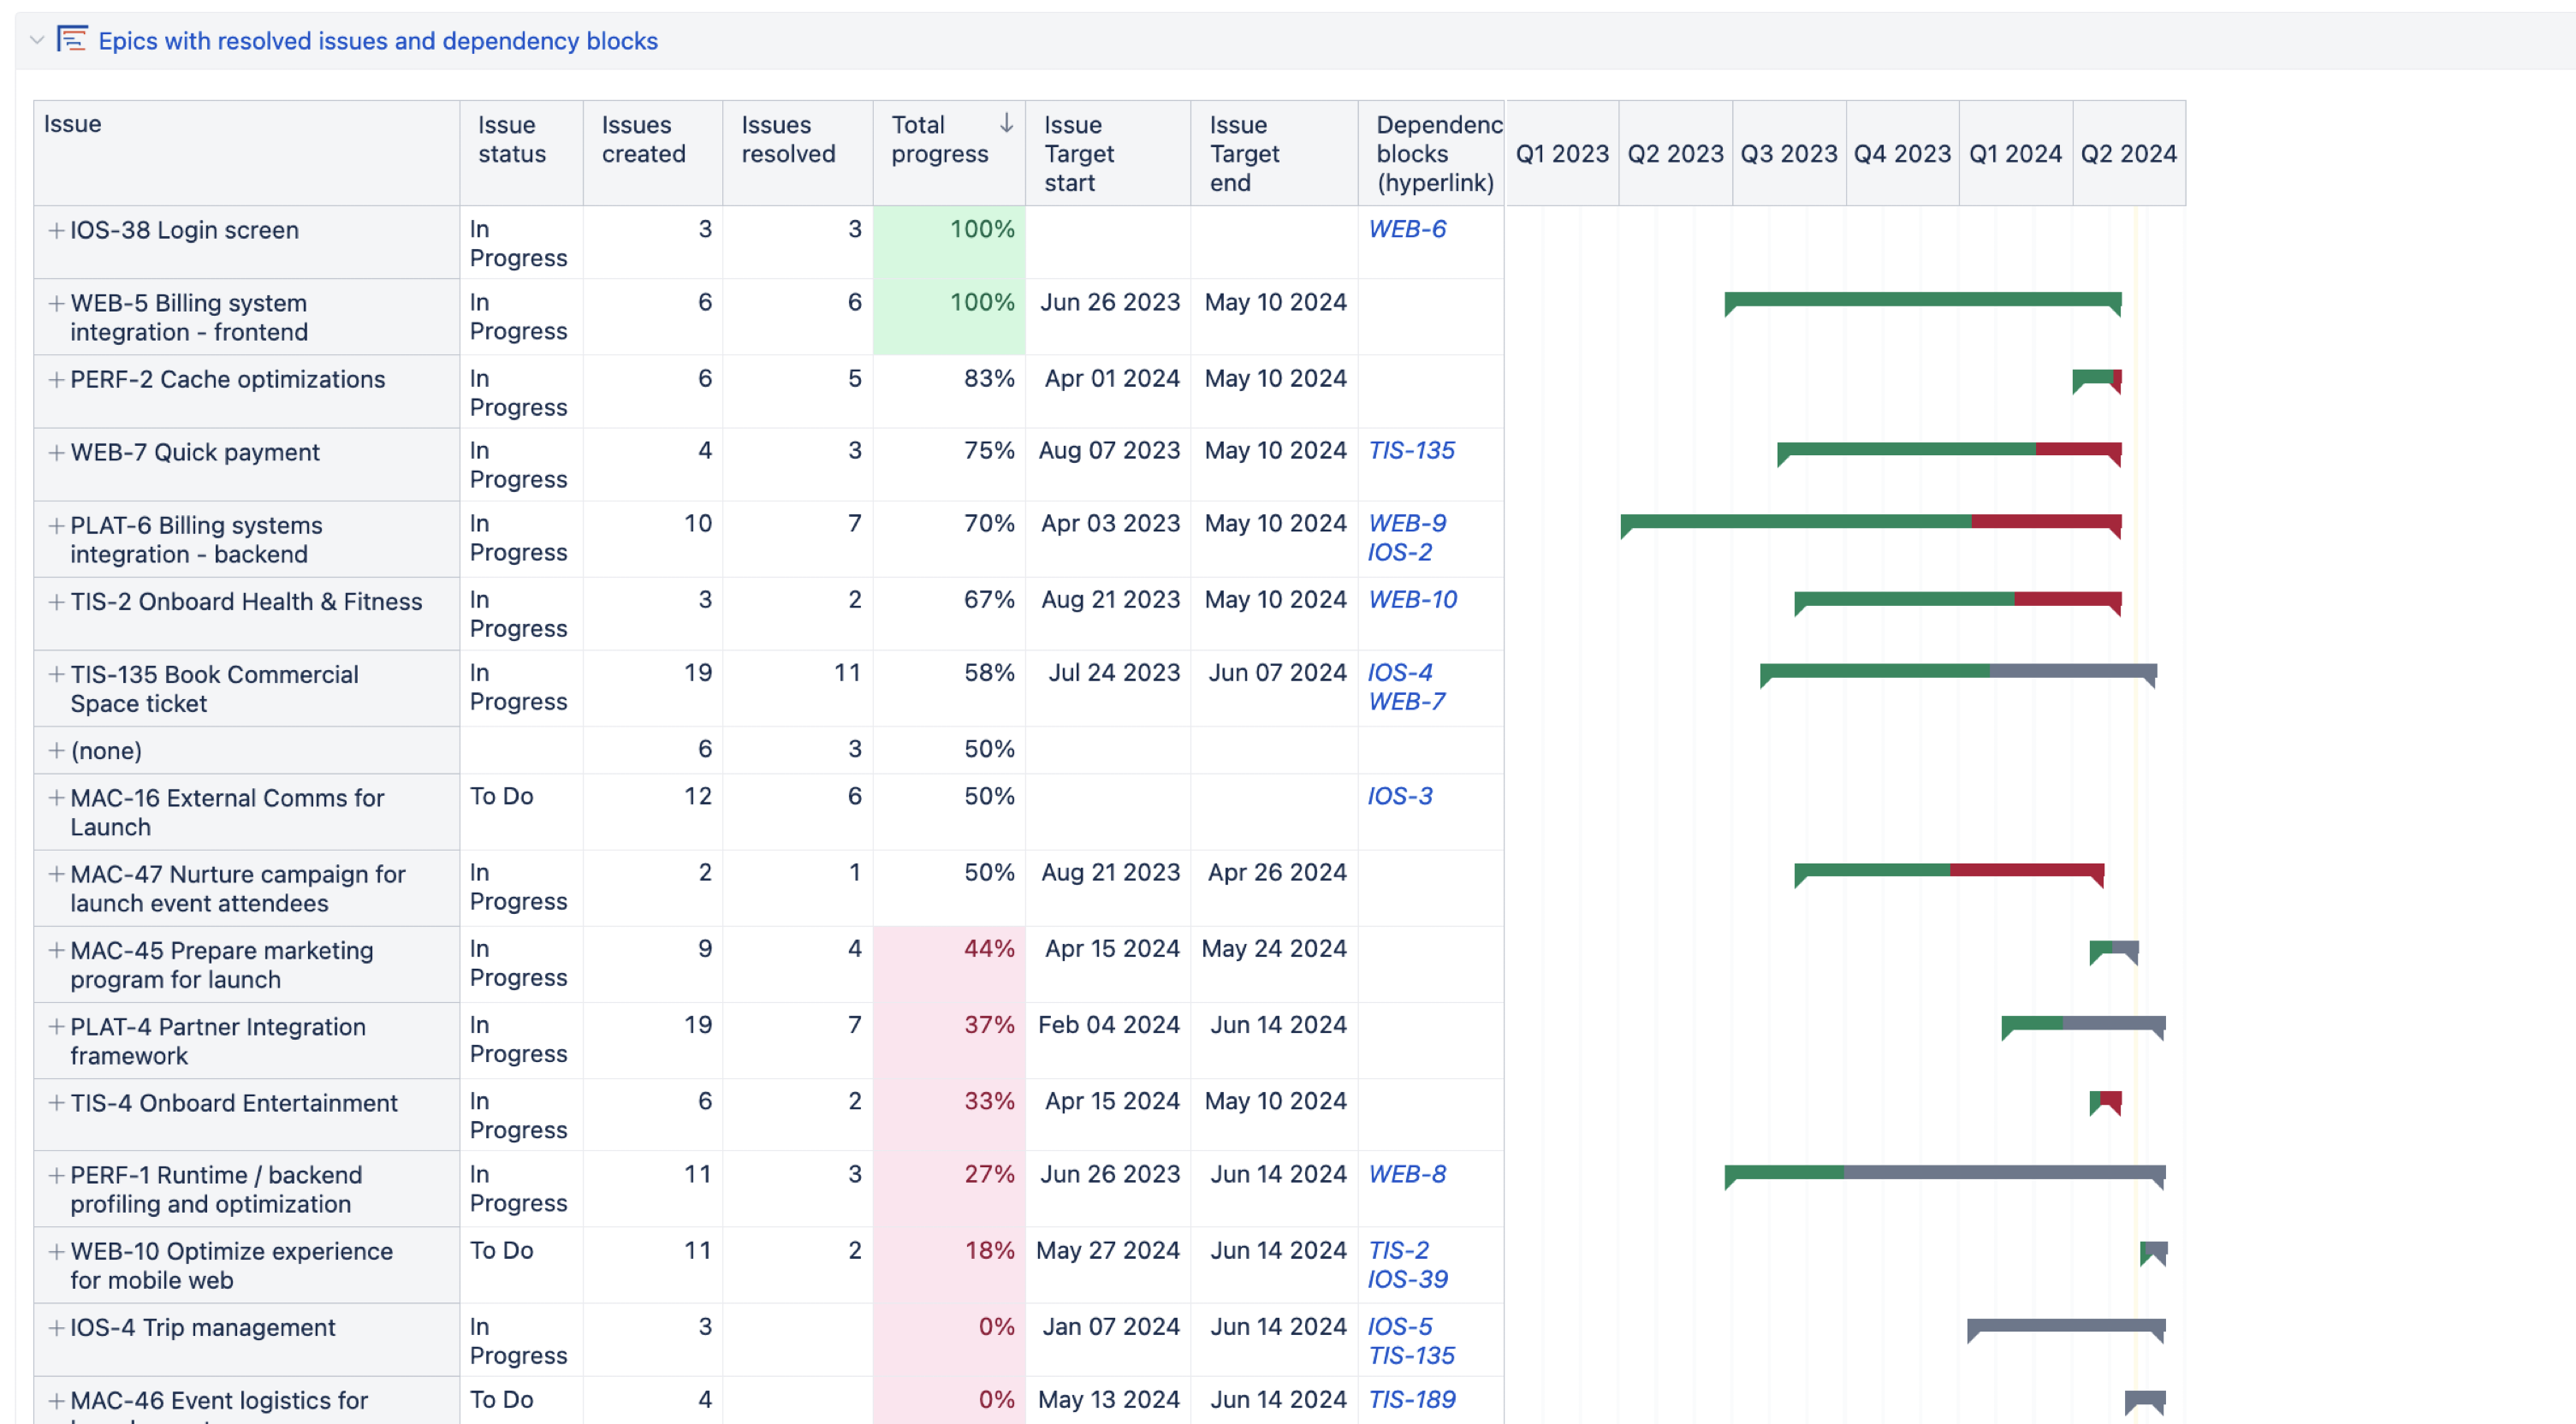
- Epic Progress Reports show issue counts as a percentage, broken down by epics and status categories. The same epic data is also presented in a table format for a detailed view.
Managing Dependencies and Linked Issues
Another important aspect of Agile planning is managing dependencies. In the Program app, those dependencies are represented by lines between issues, meanwhile, in Jira, they are stored as linked issues.
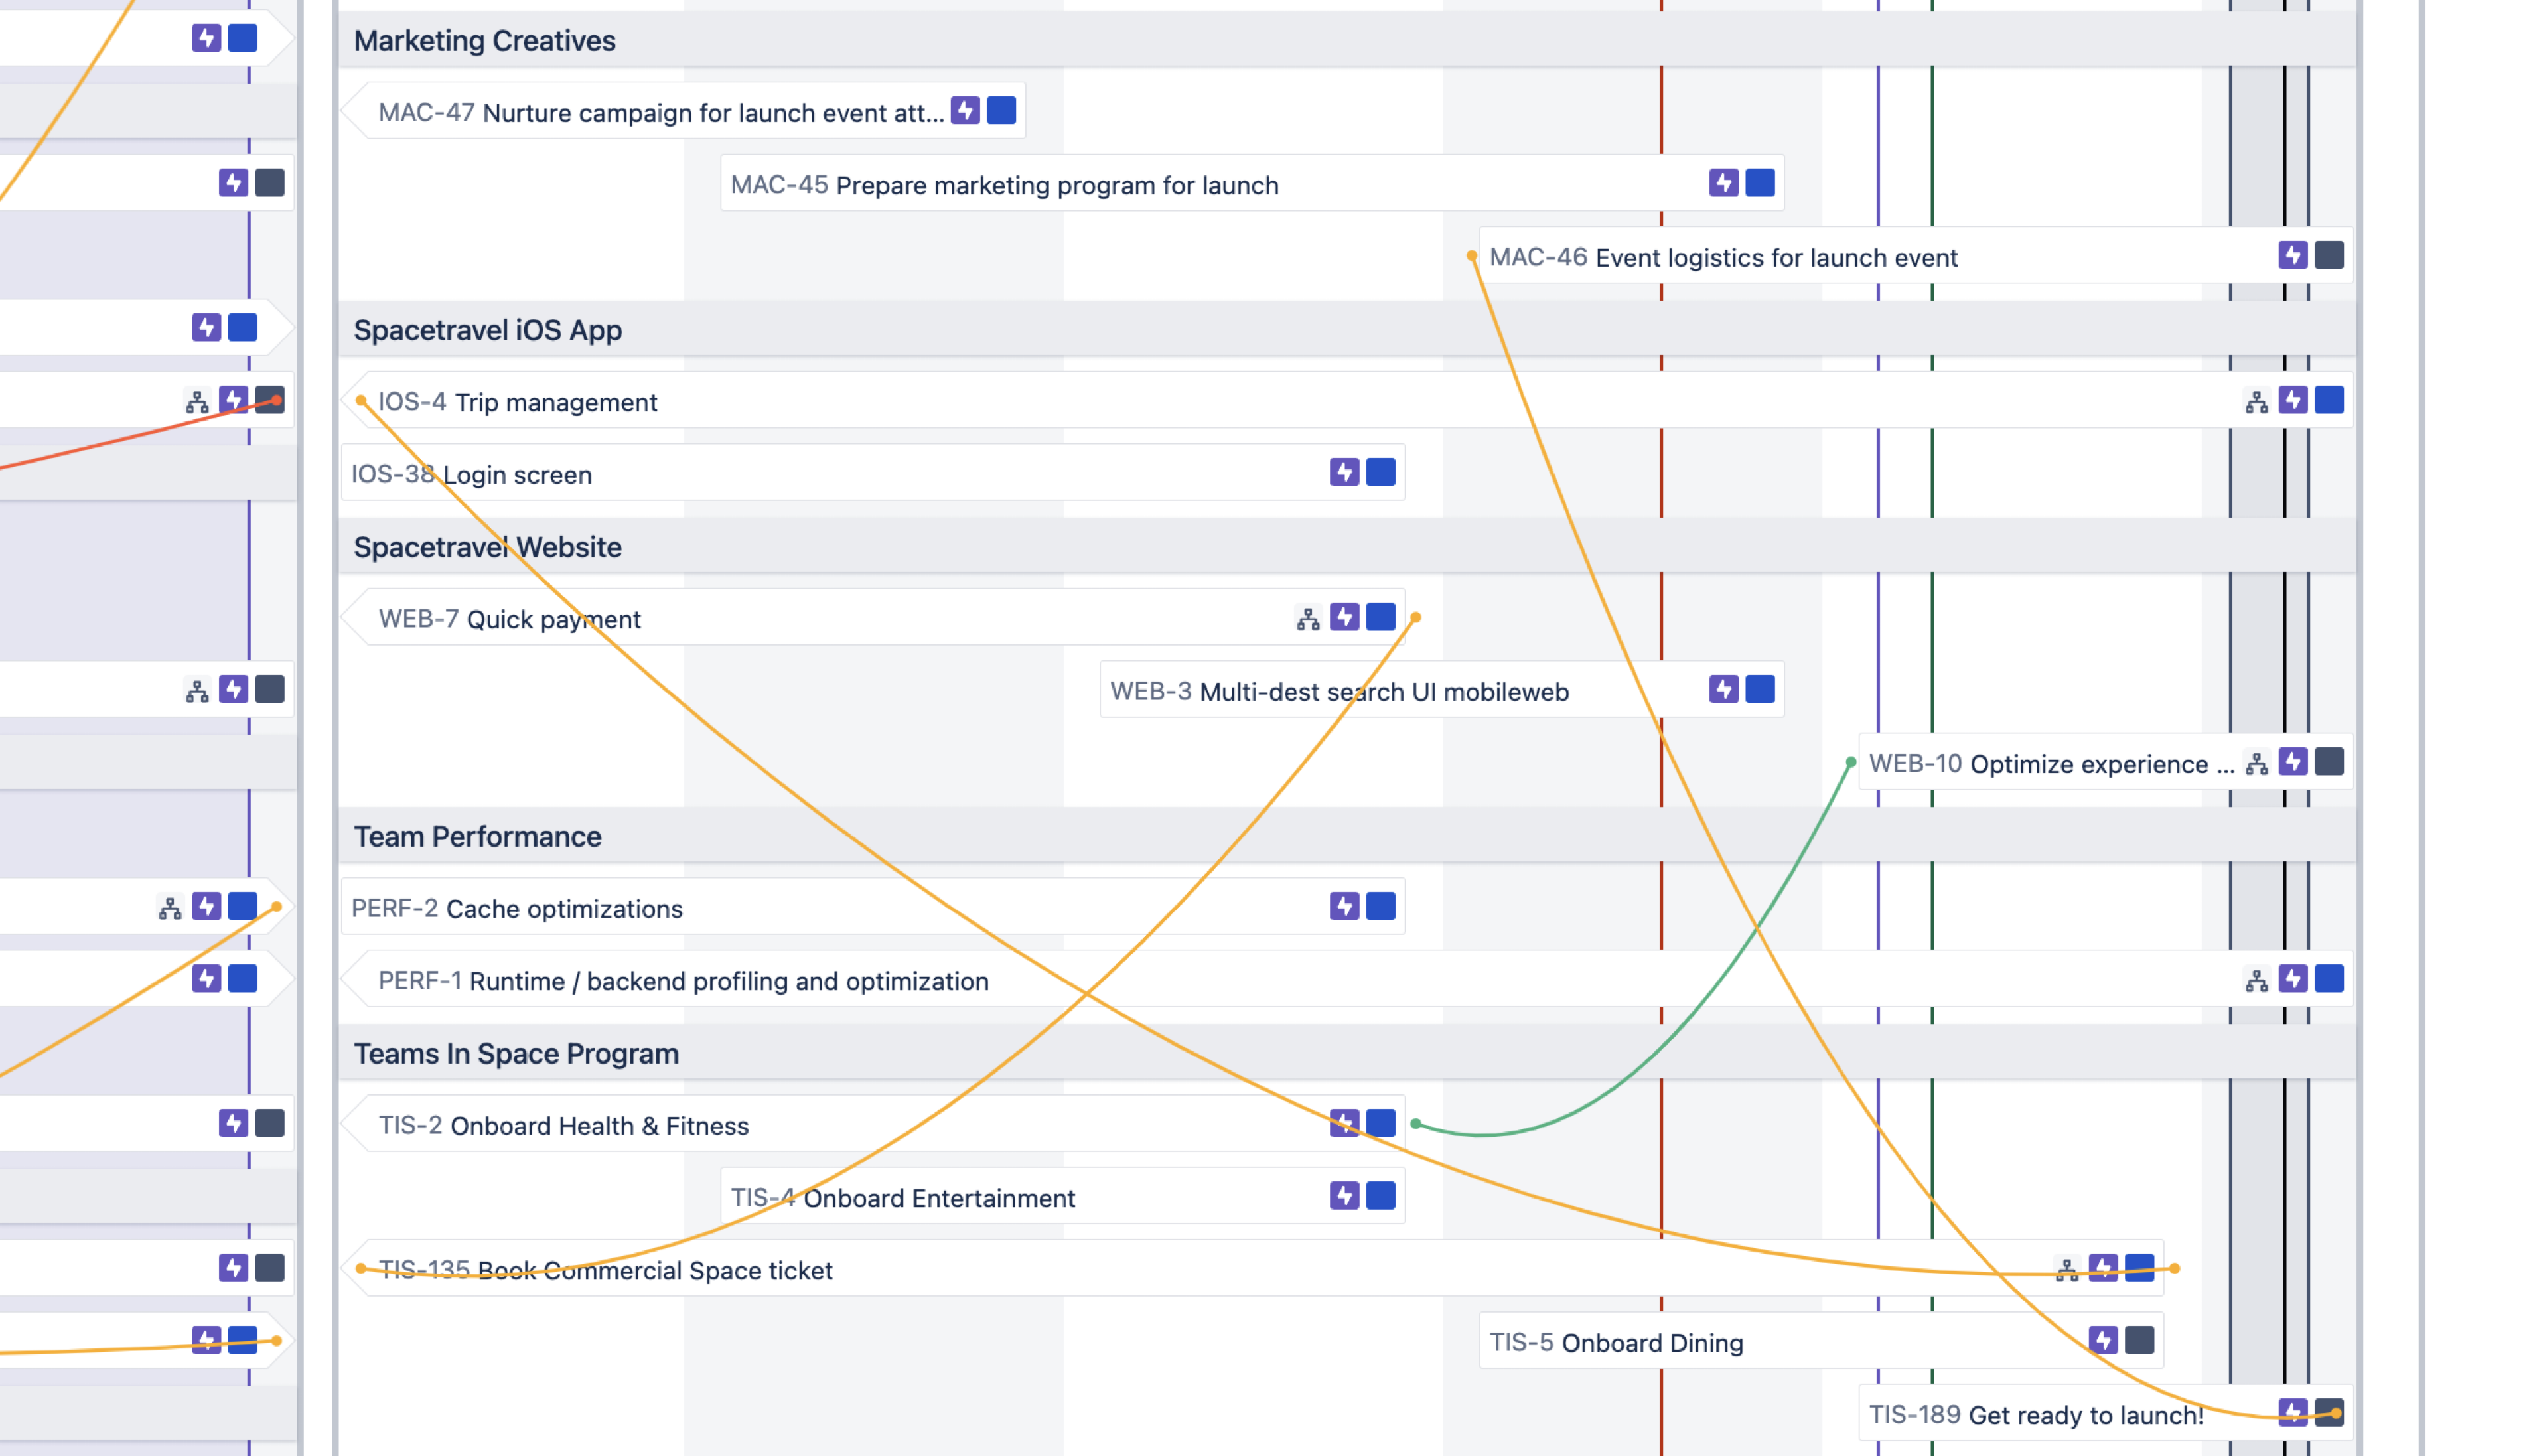
eazyBI allows you to import linked issues, so you can track these dependencies visually in the reports.
When imported, linked issues can be included in your epic report table as dependant issues to epics, formatted as hyperlinks using markdown, so you can seamlessly click on them and switch back to the Jira ticket for more details.
Sharing the Dashboard with Your Team
Once your Program Increment dashboard is ready, you can easily share it with the rest of your team by adding this eazyBI dashboard to your Jira dashboard. This ensures that everyone has access to dynamically updated data in Jira. Users can interact with the dashboard, filtering reports by selecting specific Program Increments or other criteria, making it easier for teams to stay aligned with the PI’s goals and progress.
Technical Details and Support
The eazyBI community provides comprehensive documentation for those looking for more detailed technical instructions on how to set up this dashboard. Whether you’re configuring custom fields, integrating with the Easy Agile Program app, or importing data through the REST API, you can find all the guidance you need there.