
Git Commit Statistics: How to Visualize Git Commit Log?
We tend to use a lot of code analysis tools to find out what’s bad with our code. But have you ever looked at your Git logs lately? Git commit logs contain a lot of analytical information. You can visualize and analyze your logs and Git commit statistics to see how the code has evolved over time.
A while ago, I talked about Git commit visualization and analysis at the DevTernity conference in Riga. In this presentation, I used Git commit logs from open source projects to reveal some new and meaningful (but also meaningless and funny) Git statistics about these projects and the people contributing to them.
I wanted to share with you a few reports I used as an example in my speech. You can also watch the presentation in the video above. I hope you’ll enjoy it. 😀
Why Analyze Git Commit Logs?
We often use different code metrics to estimate our code, for example:
- Lines of code
- Cyclomatic complexity
- Test coverage
- Duplication
All these metrics give us only the current status snapshot of the code. But the code is not static – it changes a lot. If you’re a software developer using Git, you might want to look at your Git commit logs from time to time.
Git commit logs hold all the change history. We can learn a lot if we analyze those commits and changes in code. It’s a great source to learn trends and patterns about your projects. Yet those plain-text logs with thousands or even tens of thousands of commits and lines aren’t very useful. What if you could visualize all that data?
How to Visualize Git Commit Logs?
To visualize your Git commit logs, you need to parse and transform your logs into a database you can analyze. You can do that with eazyBI – a web-based data analysis tool supporting Git commit logs as a data source (among many other sources). eazyBI will extract all the details from your Git logs and transform this data into a multi-dimensional analytical OLAP (OnLine Analytical Processing) data cube.
With eazyBI you can analyze and visualize Git commit logs by time, author, file, file extension, time zone, weekday, or the hour of the day. This will give you a pretty good understanding of your project development trends:
- How is your code base changing over time?
- Who is adding code, and who deletes it?
- Who are the most active contributors to the project?
- What is the ‘Net’ gain of your project contributors?
- Which days of the week and which hours of the day are the most productive?
- Which files and which parts of the code are changed the most?
Let's analyze the Git log from the Ruby on Rails repository to see what we can get.
Analyze Code Changes Over Time
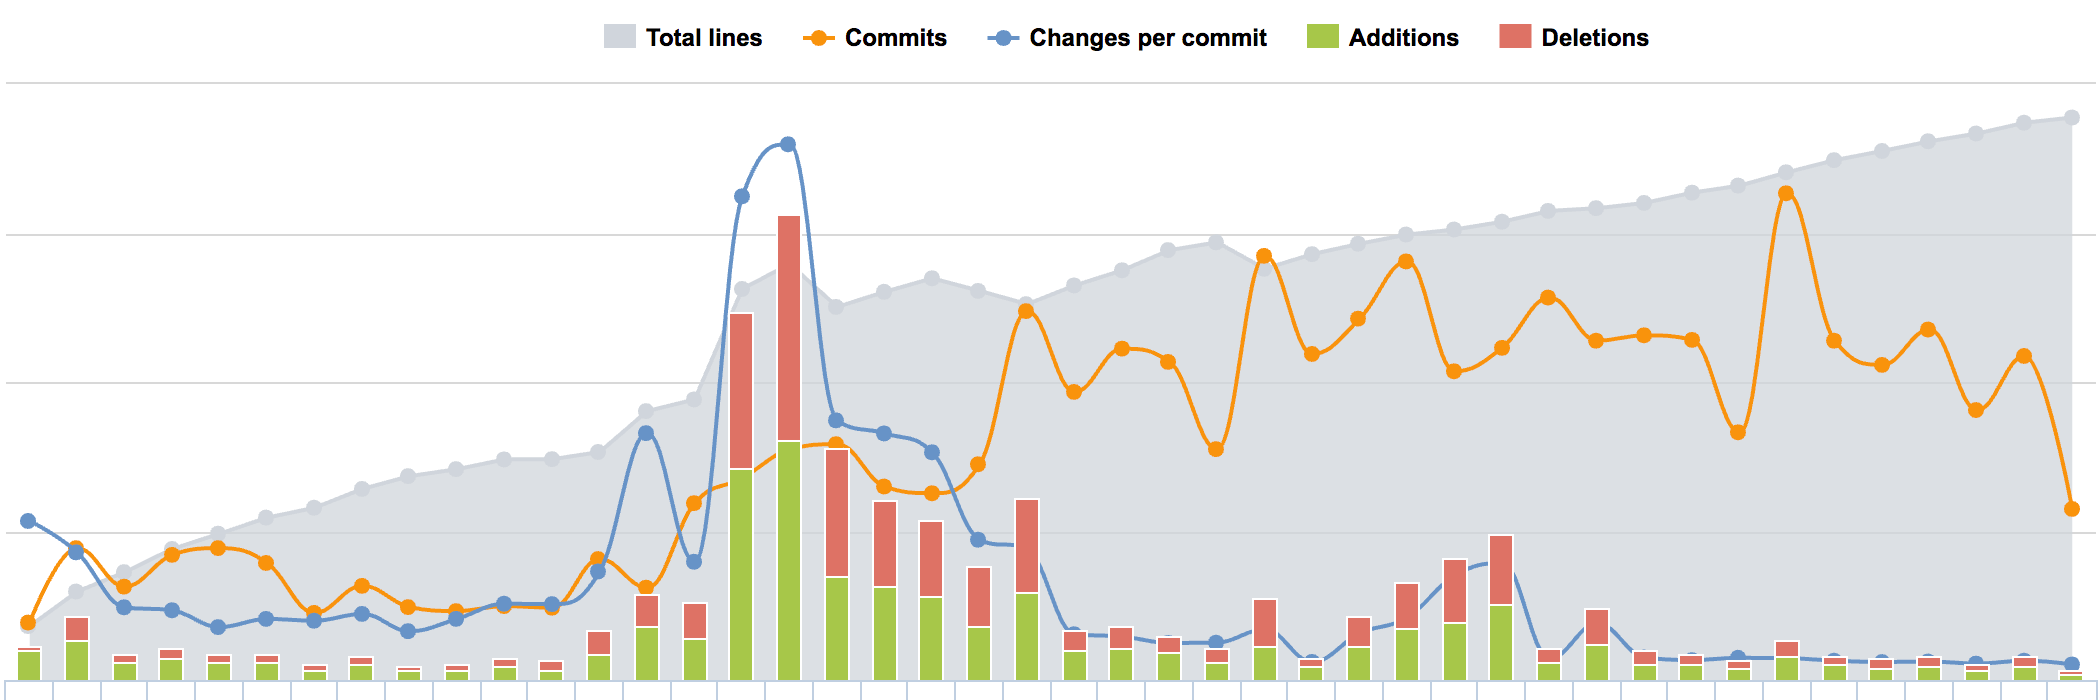
Git log timeline reports showing repository code changes over time like commits, additions, and deletions, are probably the highest top-level overview reports you could have.
It’s a good idea to include additional stats like “Total number of lines” and “Changes per commit” to give the report a better context.
“Changes” would count each change regardless of whether it’s an addition or deletion.
Code Changes in Ruby Files
If we filter only by ”ruby“ files (files with the ”.rb“ file extension), we can see different major development stages. All these Ruby on Rails development stages are reflected on the timeline.
For example, at the birth of Rails, there was a lot of activity. The next big wave of activity coincides with the great Rails 3 refactoring.
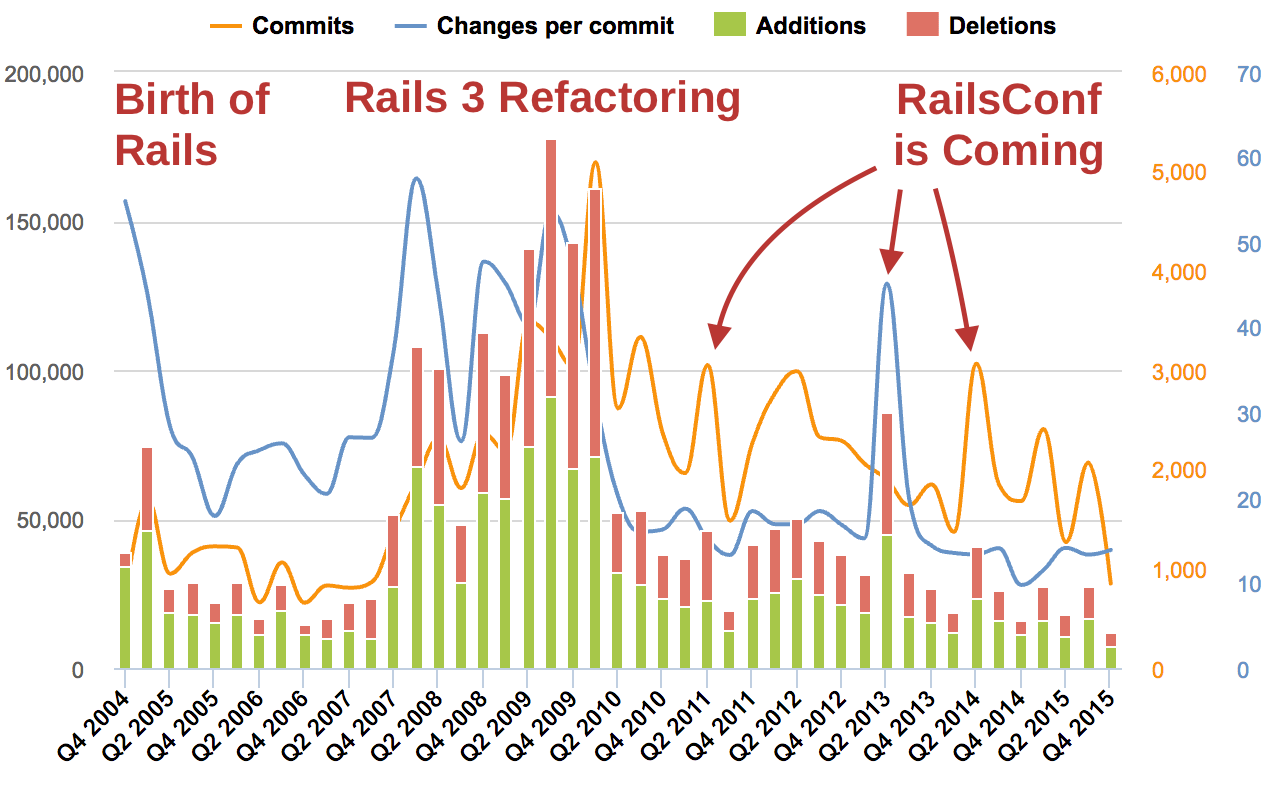 Git Commit Log – Changes in Ruby Files by Quarter
Funny that there are always some spikes of activity right before the annual RailsConf conference. Apparently, contributors want to show others something new.
Individual Contributions by Author
Let’s look at individual contributions.
We know that David Heinemeier Hansson has created Ruby on Rails. In 2004 he did all the coding by himself. Starting from 2005, David finally let others contribute too. Because of this, his contributions diminished. He started to work less.
Then in 2011, David had a technical keynote at RailsConf. Apparently, he wanted to tell something new, so he had to do a lot of coding again. You can see the whole story from just one contribution report.
Top Contributors and Their Role
We can analyze the Git log to find current top contributors for the project.
It’s interesting that in 2015, the top 10 contributors from a total of 620 were responsible for half of the commits and changes in the project.
It means that 1.6% of all contributors were responsible for 50% of project contributions. It is a common phenomenon often called ”The vital few“, and it proves itself once again in this case.
As you can see in the table below, some contributors are creating more code, and some are deleting code.
Data reflect authors' style and work approach–some like adding new functionality and code, but others like to contribute by refactoring and making the code cleaner and better.
Individual Work Patterns
Let's look closer at individual contributors to evaluate their working habits. If we look at the logs by the hour of the day, we can see when developers are working and how they organize their work.
For example, if we analyze Aaron Patterson, we can see that he is a very disciplined 9-to-5 developer.
If we contrast Aaron's schedule with the patterns of José Valim, you’ll notice that José is more all-over the place. Apparently, José also likes to work late nights while still being able to start working at 8-9 AM. We can also see that José likes to take a break between 5-6 PM and around 8-9 PM.
Overall Git Stats
Most open source developers, like the rest of us, work during work hours, eat lunch at around 12 PM and go home at 5-6 PM. Later most of them go back to their PCs for a late evening session. Sounds familiar?
If we look at the overall work pattern, it’s clear that both Aaron and José fit in nicely.
The beauty of open source projects is that developers work all day, including weekends. Commits on Saturdays and Sundays take a considerable chunk.
The most productive days regarding commits and changes are Tuesdays, while developers are most likely to submit commits with smaller changes on Fridays.
Because open source developers come from around the world, from different countries and time zones, commits come in 24/7.
Visualize Your Own Git Repo
You can try and analyze your own git repository with eazyBI for free.
Export Your Git Log
- Navigate to your project source code directory from the Command Line.
- Export the Git commit log to a txt file using the following commands:
On windows:
set LC_ALL=C.UTF-8
git log --numstat > filename.txt
On UNIX:
export LANG=en_US.UTF-8
git log --numstat > filename.txt
Make sure to use the .txt file extension.
Import Git Log in eazyBI
In eazyBI:
- Open the Source Data tab and upload your git-log.txt file. eazyBI will recognize it as the Git log file.
- Click the Import button to start file import,
- Go to the Analyze tab to build custom Git log charts.
Quick Tip: You can export and import report definitions (report templates) from the Git log demo account right to your own account in a few clicks. You can do the same with Git log demo dashboards.
Analyze and Visualize Git Log with eazyBI
Turn your Git commit logs into valuable information. Analyze your Git log and see who, where, when, and what contributes to your project. Sign up for an eazyBI Cloud 30-day free trial. The free eazyBI plan should be enough for you if you have just hundreds or a couple of thousands of commits. You could use the extended free PUBLIC plan for an open-source project commit log. If you want to analyze larger private project commit logs, choose a subscription plan that works for you.
About the author

Raimonds Simanovskis is the founder and core developer of business intelligence web application, eazyBI. A software developer and consultant with more than 20 years of experience in IT service business, a strong “enterprise software development” history, and a background in Oracle technologies.
Passionate Ruby and JavaScript developer. Regular open source contributor, has created Oracle database adapter for Ruby on Rails, PL/SQL unit testing library with Ruby, and Mondrian OLAP engine integration with JRuby. Raimonds is also an active participant in Latvian Agile software development and open data communities.