
Elements Connect and eazyBI: Unified Data, Better Decisions
In today's workplace, teams often collaborate using their own tools, which can sometimes result in scattered information across platforms. This creates challenges when trying to centralize data in dashboards for informed decision-making.
During the Beyond Team 2025 Tour, Elements Connect and eazyBI apps presented a use case to address this issue.
Meet Charlotte and Andy: Tackling Workflow Challenges Together
Imagine a developer, Charlotte, tasked with resolving stories and bugs that rely on data stored outside Jira, such as operating system and application version details.
Andy is Charlotte’s project lead. He needs a dashboard to ensure the project is still on track. So, he needs unified data standards and standardized data not only for consistency but also to expedite decision-making processes and enhance reporting.
Together, they deal with challenges like miscommunication caused by scattered data across different platforms, mistakes from manual data entry, and wasted time due to tools that don’t work well together.
With Elements Connect and eazyBI, they’re working to close these gaps, improve data accuracy, and make their workflow more efficient and scalable.
Breaking Down the Solution: Fetching External Data to Jira with Elements Connect
Elements Connect app automates data integration flow from various data sources and helps align teams' efforts to ensure seamless communication across departments. It enables seamless integration of external data into Jira, using APIs to pull data from sources like Salesforce, HubSpot, and Active Directory.
The real power of Elements Connect is that you can bring several data sources inside Jira—any tool with an API can be used as a data source. Elements Connect can set up the fields and the dependencies between those fields the way you need them, for instance, by building a cascading list where information from the first field is related to the information in the second. It's really based on the context of the issue.
Fetched data can be displayed in the way you need them and the way you want them. Elements Connect custom fields can be set up with the possibility to select options, as well as read-only fields related to them.
Our developer, Charlotte, can go to Jira and work on her ticket. In her ticket, she uses Jira standard information, like priority, issue type, and fix version, together with Elements Connect custom fields containing information from external data sources, like Operating Systems and Application Version.
Breaking Down the Solution: Reporting on Aligned Data in eazyBI
Remember Andy, our project lead? He has two project teams, and each of them works on separate projects. They have slightly different processes, but at the end of the day, Andy wants to see the total results for these projects.
Both teams agreed to focus on similar KPIs so they could compare projects. In reports, they want to see the following:
-
Issue counts in each release are analyzed based on different issue aspects.
-
To track that less than three issues are in the backlog ten days before the release date.
-
Monitor that all the highest-priority issues are resolved before the fixed version's release date.
All reports should show how teams are meeting their KPIs and overall analysis by different issue aspects, including Elements Connect custom fields, which Charlotte and other developers are using in their Jira issues. Andy combined Jira standard and Elements Connect fields to create several reports for his team. In some cases, he used the eazyBI AI assistant to build a report.
He combined all the reports in the eazyBI dashboard for a broader context and published the report in the Jira dashboard and Confluence.
Days Until the Version Release Days
This report shows a gauge visualization of the days remaining until release for unreleased versions. It gives the context of the whole dashboard, for instance, the count of unresolved tickets in each project.

The report shows both projects' unreleased versions. The days until the release date value is color-coded to show it red if the version is close; moreover, the color gets darker the closer the release comes. This helps to see how close the versions are at a glance.
This and the following reports are filtered by the project lead “Andy Admin” to show all his projects. To achieve that, Andy created a separate hierarchy in the Project dimension to group projects by project lead.
Days in Cycles per Version
Andy created a report to show the average time issues spent in different statuses or cycles—in a backlog, in progress, as well as the count of issues in each of them.

This report also has conditional formatting that shows “Issues in backlog” in red if there are more than three issues. Additionally, Andy will receive an alert as soon as this measure is triggered and the critical count is reached.
Andy also added additional filters by Jira standard fields, native custom fields, and Elements Connect custom fields to the report. This allows to focus on a specific release, operation system, or issue type. Each team member can see their tickets, so Charlotte can filter reports and see issues assigned to her.
Issue Counts by Operating Systems and Application Version
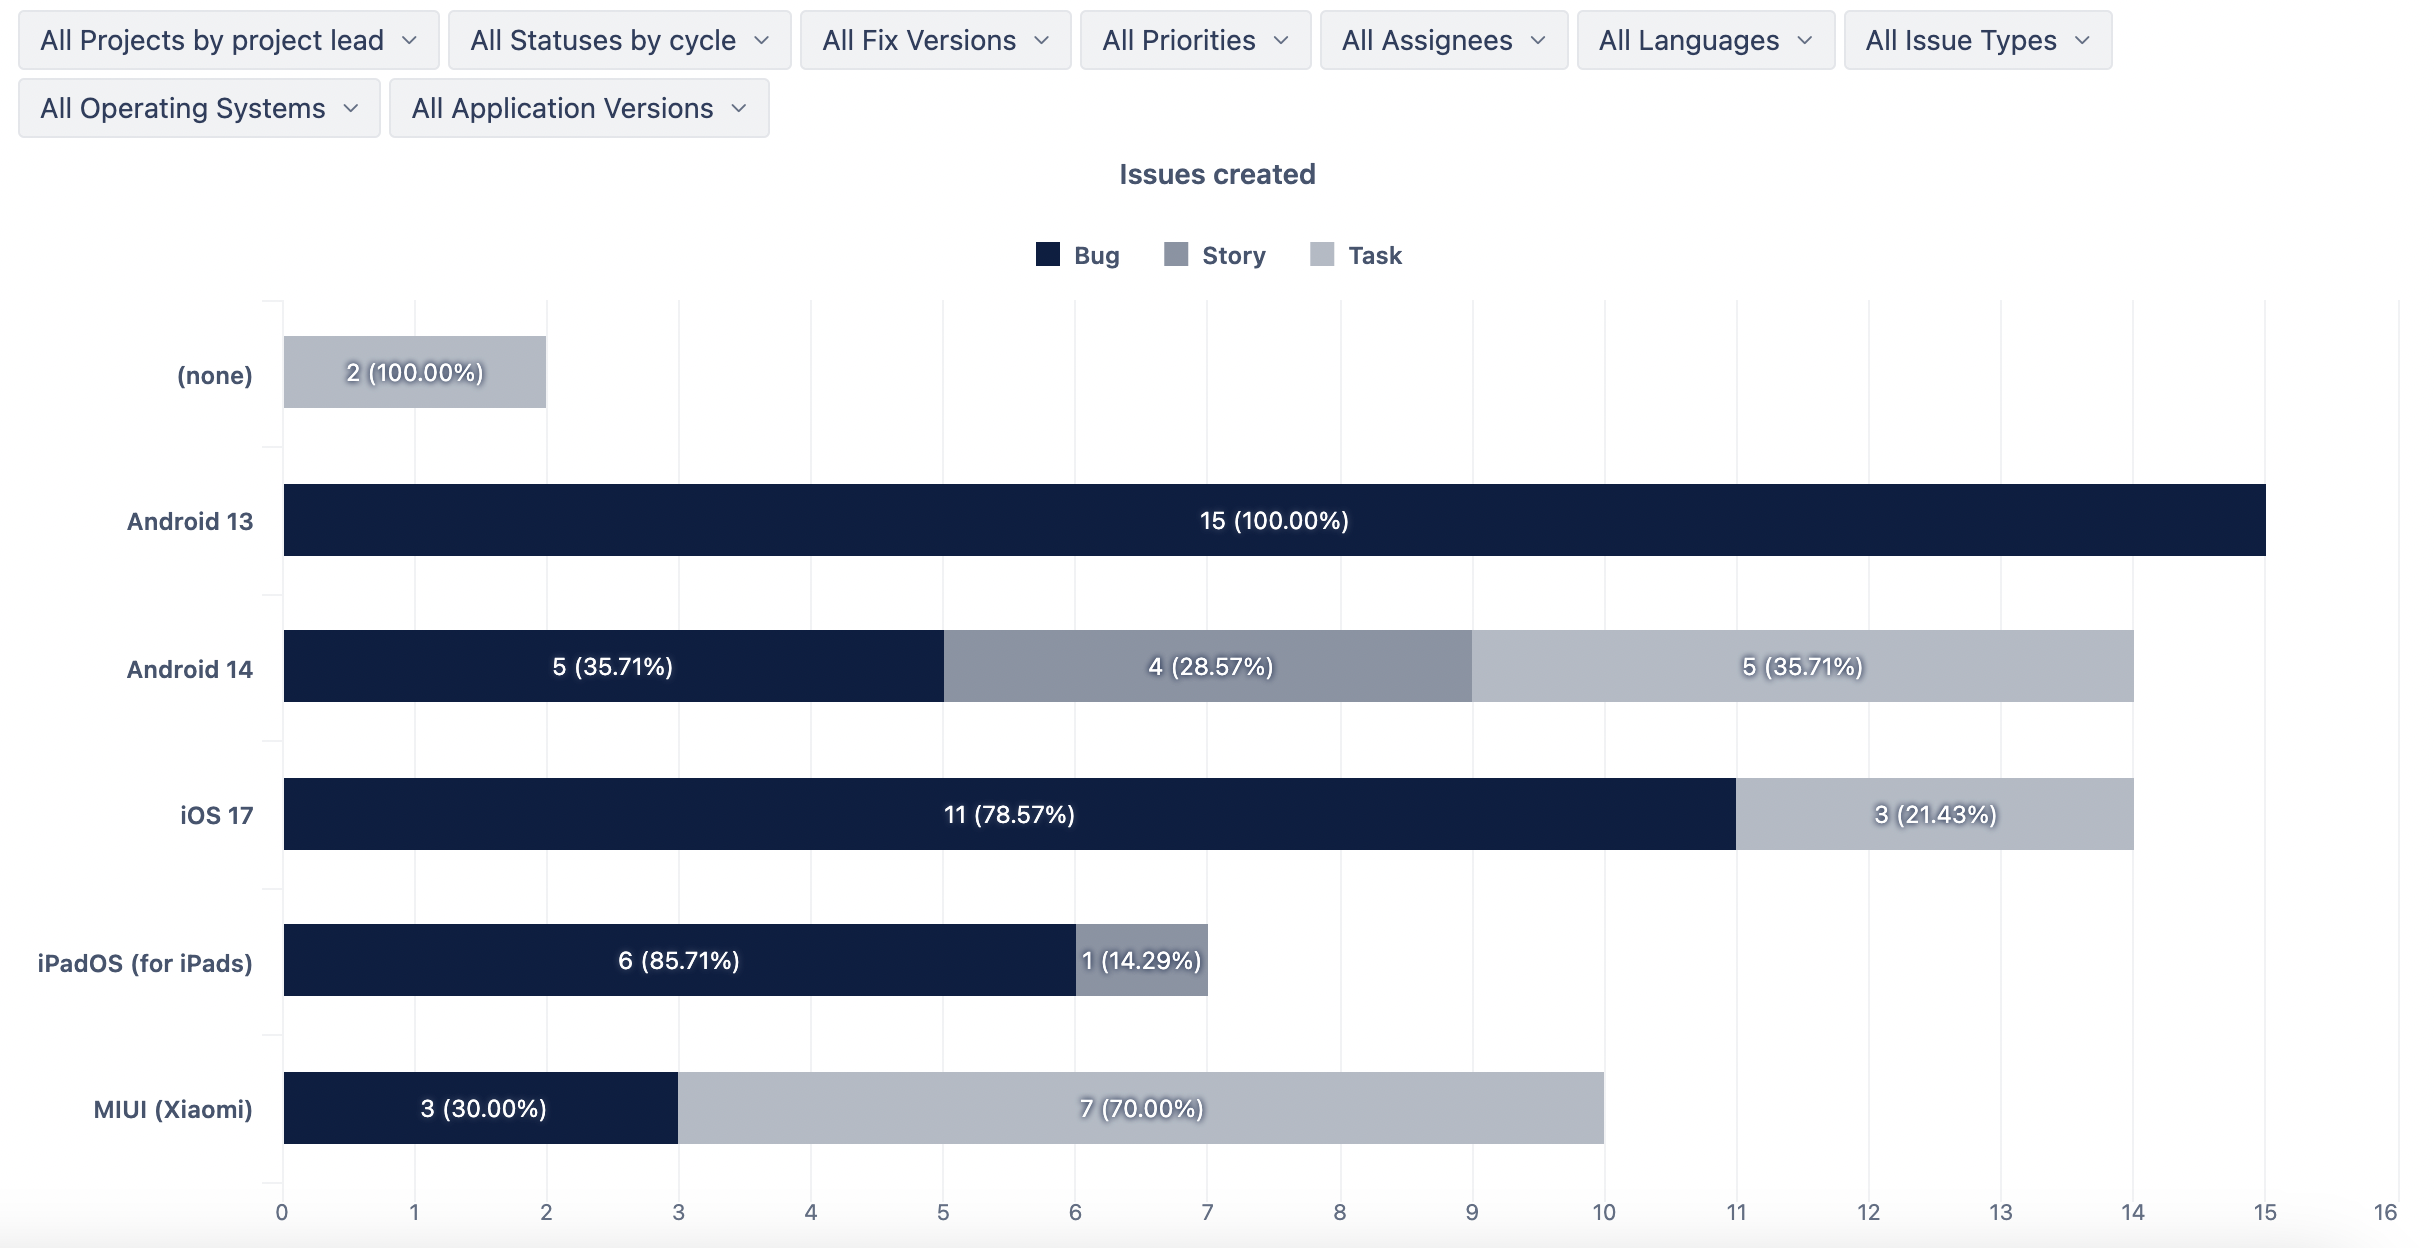
Andy also created some reports by operating systems and application versions, based on Elements Connect custom fields, which Charlotte used in her Jira ticket.
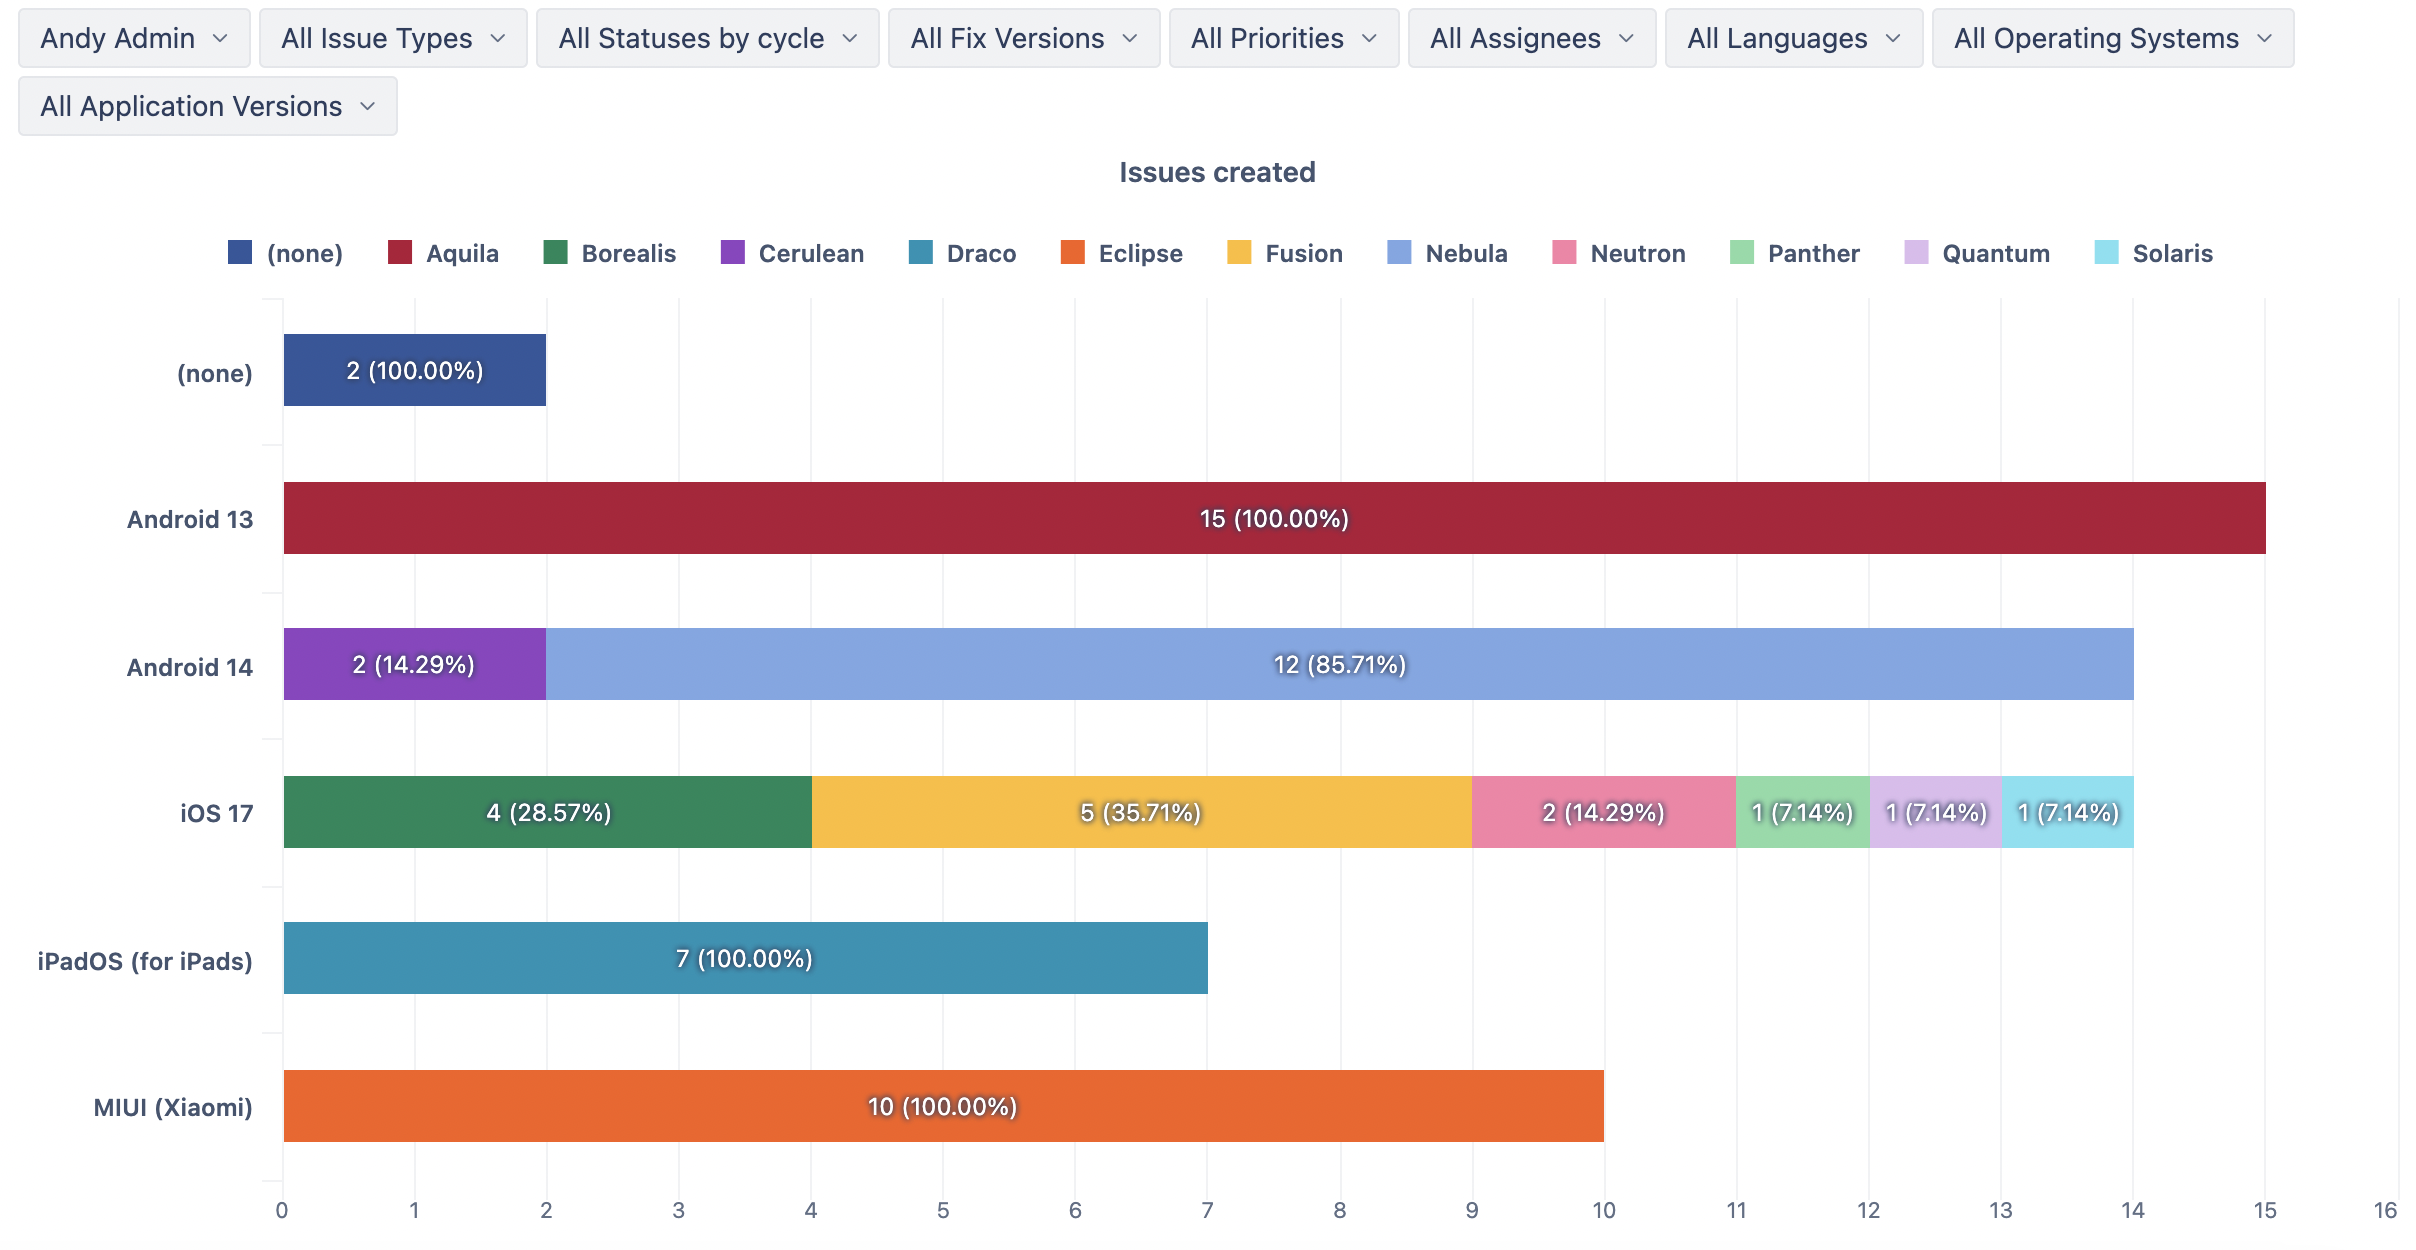
This report shows the count of issues with different issue types separated by operating systems in Andy’s projects, thus consolidating information from Jira and data from external sources. For some operating systems, like Android 13, all the issues are bugs, but in some other operating systems, you can see there are stories and tasks.
Another report shows issue distribution by both Elements Connect fields—Application Version and Operating System—used in Andy’s projects.
Total Resolved Issues Progress per Project
For the second KPI—check if there are less than 5 unresolved tickets 10 days prior to the release date—Andy created a gauge chart showing the number of resolved issues compared to the total number of created issues in each release. Together with the report “Days until the release day,” they give a clear answer that this time, the progress is not as good as expected, both release dates are very close, and there are a lot of unresolved issues.

Unresolved Issues by Priority
Finally, to meet the third KPI—no high-priority unresolved issues on project release day—Andy created a report showing unresolved issues by priority for each release.
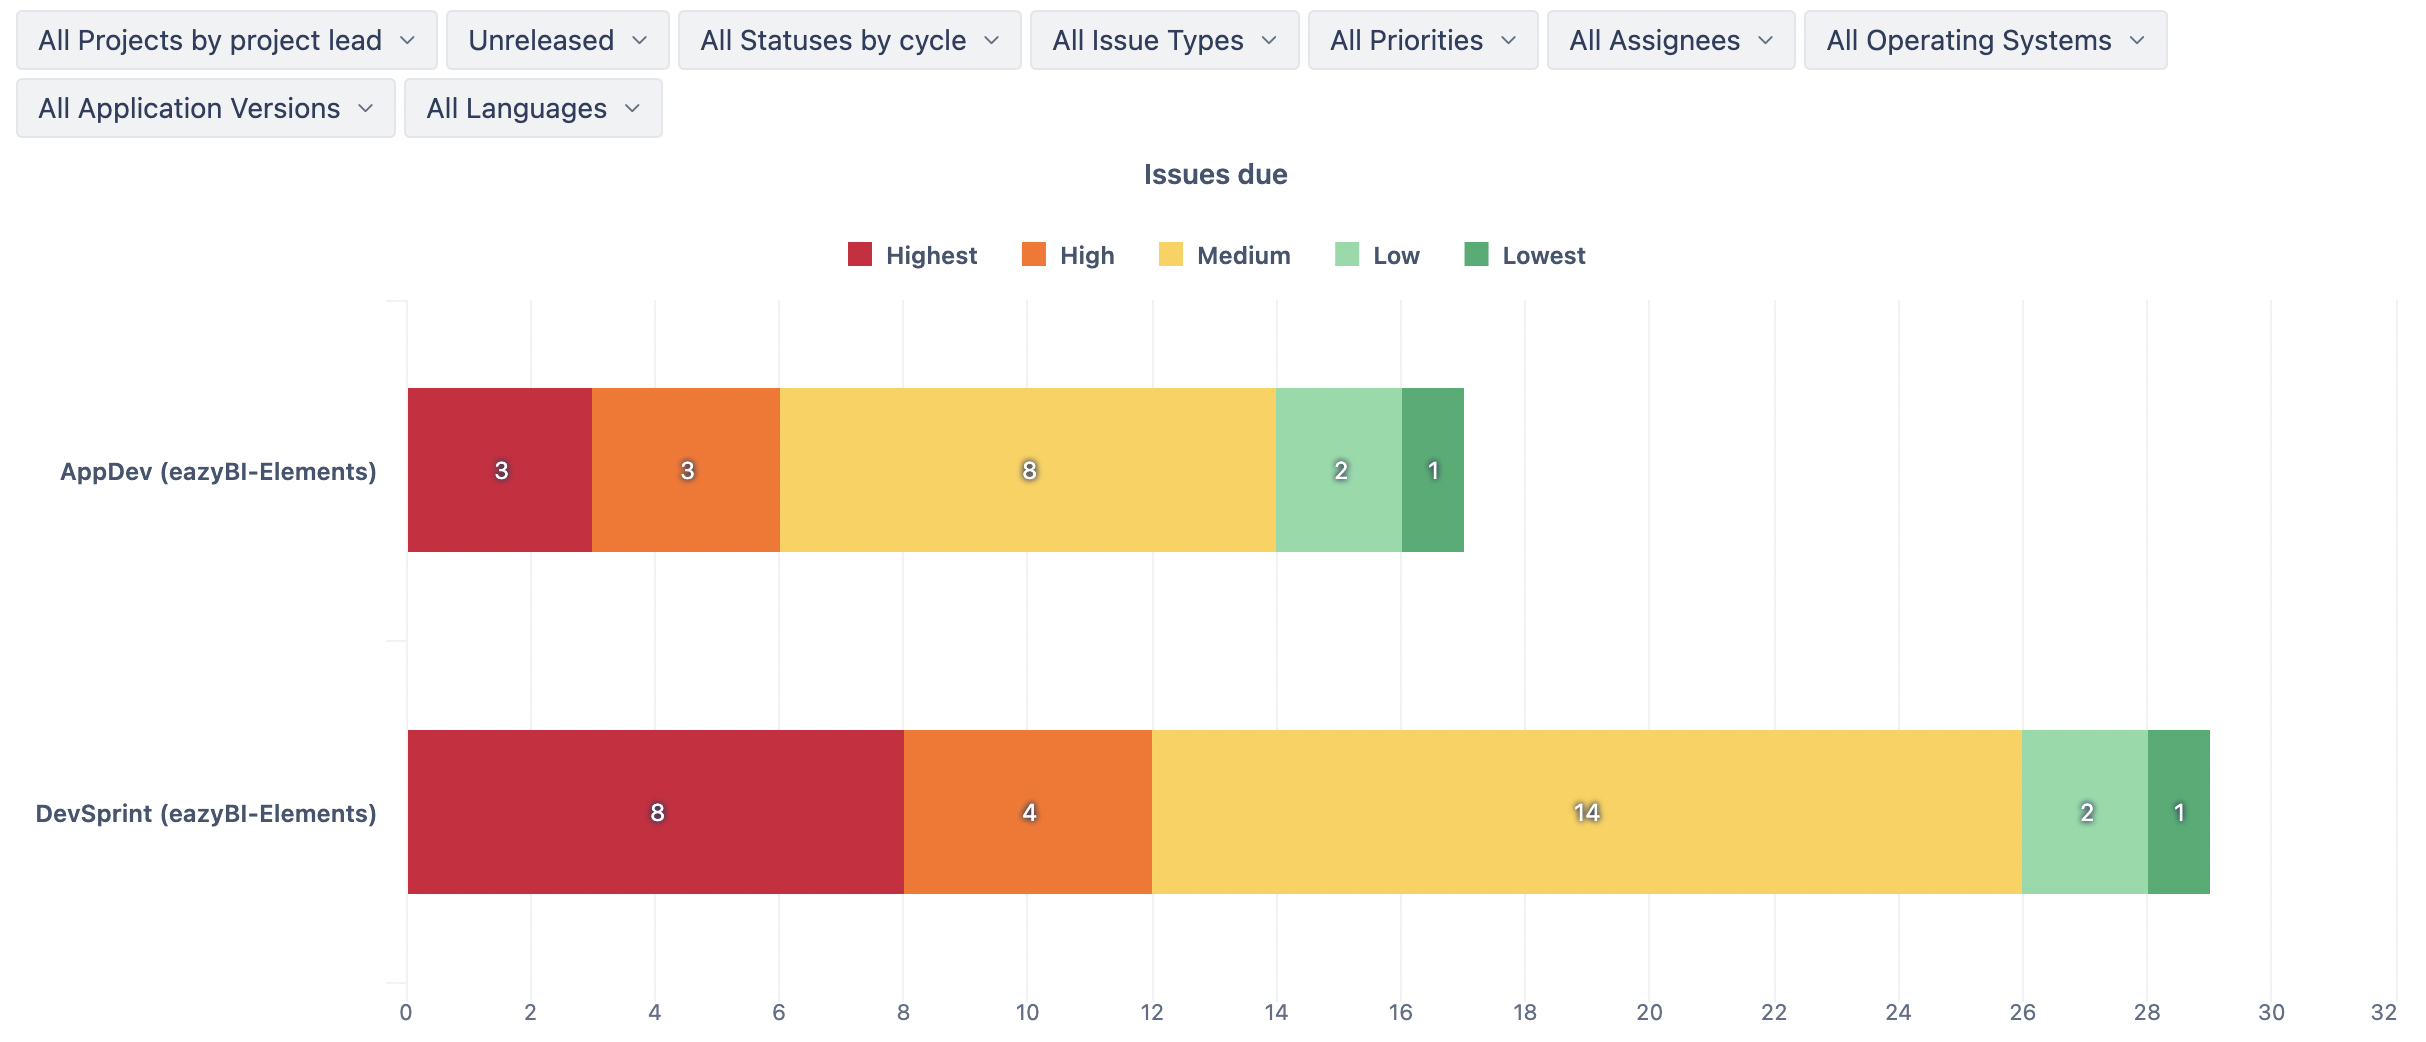
While the DevSprint release is coming out in 5 days, and the team still has time to resolve the highest priority issues, the AppDev release date is almost here, but three of the highest priority issues are still unresolved. Project lead Andy and the team have to decide what to do with the release.
How to Add Elements Connect Fields to eazyBI Reports
Integration between eazyBI and Elements Connect is smooth because Elements Connect fields have a simple structure in Jira issue JSON representation. Charlotte’s fields that contain external information— Operating system and Application version—are stored as Jira custom fields with a simple structure. As soon as eazyBI knows how to import them, it can import them and use them for reports like any other customer field.
For Jira Data Center, eazyBI automatically recognizes Elements Connect fields and gives you the option to select them in import options. For Jira Cloud, add a definition for those fields in settings, and then eazyBI will give you the option to import these fields as custom fields; more information on this can be read in the eazyBI documentation.
Summary
Elements Connect and eazyBI are powerful tools designed to improve workflow efficiency for developers, product managers, and teams. The key takeaway is that these tools ensure you have the right context and accurate data at your fingertips, minimizing manual effort and communication gaps.
