
Jira Reports: Ultimate Guide to Agile Reports in Jira
Jira is an indispensable workflow management tool helping with planning and tracking, but Jira can also be extensive. How can you unlock its full potential? This article provides a comprehensive overview of Jira reporting. Advantages, disadvantages, and best practices on using built-in and external Jira reporting solutions.
This is a lengthy article, so feel free to jump to the section that interests you most:
- Why do you need reports in jira?
- Different scopes of Jira reports
- Types of reports in Jira
- Available built-In Jira Reports
- Built-in Jira reporting vs Jira reporting apps
- Which jira reporting solution is right for you?
- Custom reports & dashboards with eazyBI
Why Do You Need Reports in Jira
The core value of Jira lies in the vast amount of project data it's built to store. This information enhances collaboration in project teams while keeping decision-making and activity transparent. However, this data can prove overwhelming as it increases in scope over time. The silver lining is that managers and teams can keep track of projects at a high level without losing sight of the details. All this historical information then becomes an essential asset. In addition, project teams can use historical data to find valuable insights.
Critical Insight into Your Jira Projects
In any organizational context, insight is a vital resource. Imagine being in a position to recover almost 100% of revenue lost due to sudden disruption. Project management in Jira provides a wealth of data that can be used to identify trends and patterns and improve processes over time.
Improved Data-Driven Decisions
According to a Gartner survey, 65% of business decisions have become more complex, involving more choices and relevant parties. We can expect that the complexity level will increase over time. The way to manage this is by leveraging the known to make sense of the unknown.
Jira can provide valuable insights based on historical data. Past trends can serve as indicators of future performance to plan a more feasible project timeframe. With the proper insight, it's easier to pinpoint areas that need improvement.
Better Collaboration Among Team Members
When team members come together to engage with and learn from one another, this improves how the team works together. As a result, fostering cooperation improves the team's capacity to solve problems, innovate, and achieve goals. But tension can become part of a team dynamic more often than anyone would like.
Jira helps teams achieve positive collaboration outcomes by clarifying the work, the stakeholders involved, and their responsibilities. This doesn't just apply to internal teams. When collaborating with external stakeholders, Jira enhances visibility. As such, you can tell where your project falls on the external team's workload, putting you in a better position to minimize any friction that could arise.
Enhanced Transparency
The range of available Jira custom reports improves the visibility of tasks, individual roles, and responsibilities. As a result, everyone involved in a project has clarity on what needs to be done and when.
Improved Work Efficiency
Another benefit to teams using Jira is improved efficiency. Regardless of the nature of your work, utilizing resources to bring about the best possible result with the least amount of waste is essential. With Jira, you can tell which project parts are taking longer, establish the cause, and continuously adjust performance for maximum output.
Scopes (or Levels) of Jira Reports
Different Jira reports have varying scopes and, as such, serve various purposes. The different types are as follows:
Individual Reports

Jira enables you to access individual reports that offer insight into a specific area of focus. Individual user activity can be assessed to better understand team members' responsibilities, assigned tasks, and progress. This goes a long way in improving time management.
Time Reports

Time can be captured in individual reports as well as team-centric reports. They help to better gauge time usage at a project or issue level. Continuous assessment makes it possible to understand how the team spends its time and whether actual performance aligns with the established time and budget allocations. Consequently, teams can better manage their time and resources while addressing deviations in good time.
Team Reports

For team managers, specific Jira reports provide insight into a team's workload. It helps with proper task assignments, considering how much the team can take on. As a result, these reports result in a better working relationship, improved productivity estimation, and a cohesive working environment.
Project Reports
 Jira reporting capabilities allow for better project management. They enhance the tracking and monitoring of project progress, provide overviews of backlogs, and enable better estimation of future project completion. As a result, teams can assess where they are and make the requisite iterations to complete projects successfully. These reports are useful for timely and on-budget project planning, management, and delivery.
Cross-Project Management Reports
 In cases where it's necessary to assess multiple projects against set targets, Jira reporting and search capabilities provide high-level overviews of interrelated projects or those that bring together multiple teams. This ensures that all stakeholders know key objectives and progress and that they're better positioned to forecast and draw up budgets.
Jira Service Management Reports
 For service teams, Jira provides reports that can help to manage incidents or customer issues. Jira Service Desk apps provide an end-to-end issue management framework across different company channels. Project administrators can then generate reports that offer a closer look at issue management. This serves as a basis for improvements in service management. Jira Service Management reports include SLA reports, Created vs. Resolved, Recently Opened and Closed, and Currently Open incidents.
Test Reports
 Reports that present data at the testing level are especially useful for product development teams. They present crucial data about test requirements, coverage, and execution. Insights in these reports inform the entire software testing process, allowing issues to be addressed in advance. This then leads to more stable and higher quality software upon release.
Types of Reports in Jira
Having gone over the different levels of Jira reporting capabilities, let's explore the various types of reports users can create.
Issue Reports
For projects in Jira, users can generate several kinds of issue reports:
- Recently Created Issues Report: Indicates the rate at which new issues are being created within a project.
- Created vs. Resolved Issues Report: Contrasts the number of issues created with those resolved at the time of report generation.
- Time Since Issues Report: This shows how many issues have been created or updated within a specific period.
These reports help spot trends and gain an overview of project issues.
Agile Reports
Agile Reports offer teams better visibility. They indicate efforts, show progress, aid planning processes, and help teams stay on track. Agile reporting can be done at an individual, team, project, or cross-project level. Examples include:
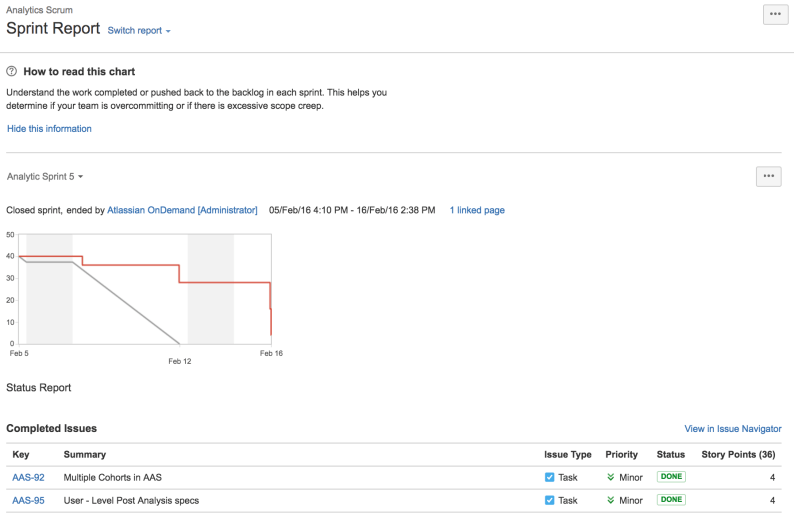
- Sprint Report: Showing a list of all issues completed while the sprint was in progress.
- Burndown Chart: This shows the estimated amount of work to be done and the actual work done.
- Velocity Chart: Indicates how well targets are being met, helping predict how much work can be done in future sprints.
Forecast and Management Reports
These reports offer higher-level overviews useful for time tracking and workload management. An example is time reports, which offer insight into how much time a user has spent on an issue basis, highlighting deviation from budget and time allocation estimates. To make the most out of Forecast and Management Reports, it's essential to use native Jira time tracking.
Available Built-In Jira Reports
There's a host of natively built-in reports available in Jira. This section examines them in greater detail.
Jira Sprint Report
A Jira Sprint Report shows all the issues within a given sprint. It comes in handy when monitoring actual start dates compared to those initially anticipated. Sprint Reports in Jira offer several benefits, such as enhanced teamwide project ownership and better management of individual roles within teams; they lead to improved workflow when insights are used to improve processes.
Jira Velocity Chart
Velocity in Jira refers to what a team can deliver within a sprint. This can be measured as issues, hours, or story points. With continuous analysis, Jira velocity charts help to establish the average amount of work the team can complete in subsequent sprints. In this regard, managers can assign achievable amounts of work within reasonable timelines.
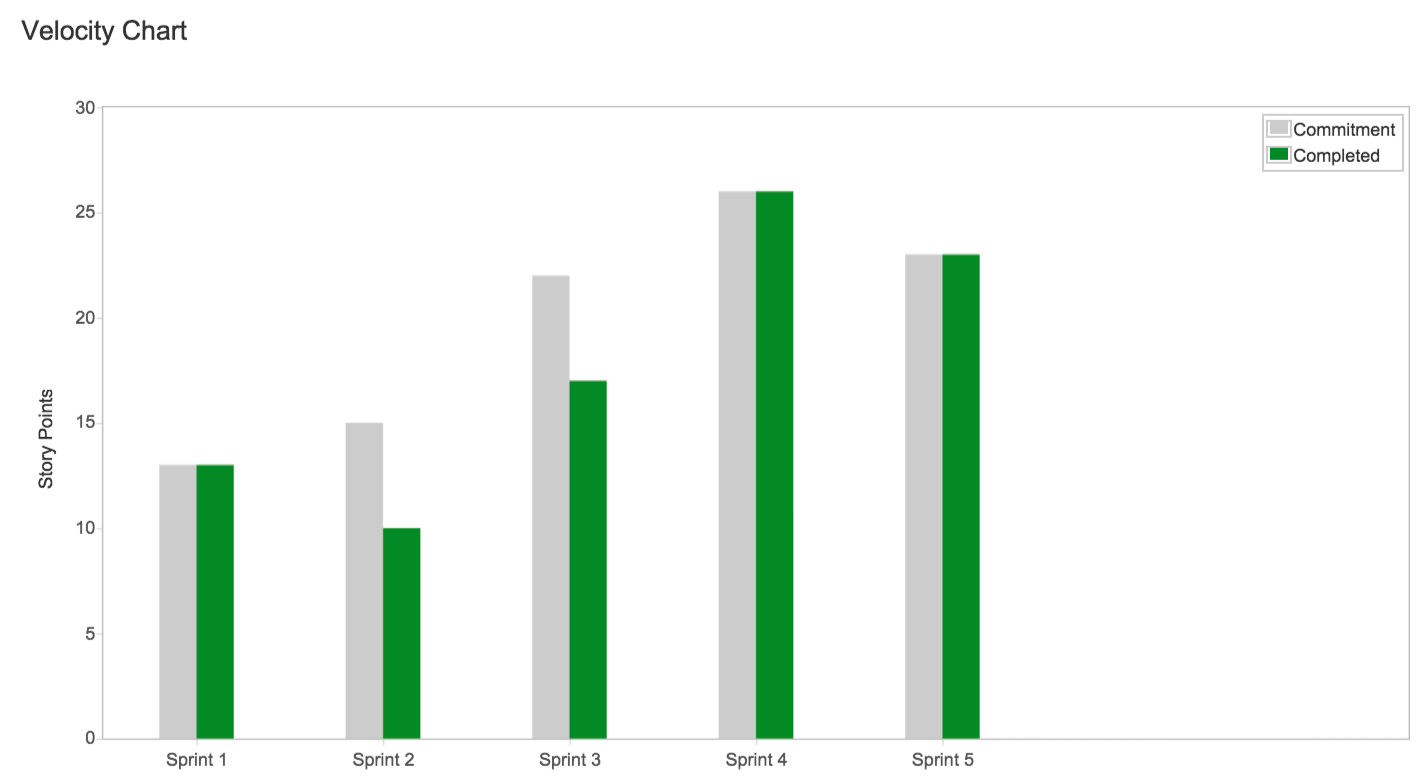
- The y-axis displays the estimation "unit" used for estimating stories. Usually, estimates are based on: story points, time (minutes, hours, days, or weeks), number of issues, or points.
- Gray bars show the committed work for each sprint – a total estimate of all issues in the sprint when it begins. Committed issues won't change after the sprint has started.
- Green bars show the completed work during the sprint and when the sprint ends.
- The x-axis displays the last 7 sprints completed by the team. This data is used to calculate velocity.
Jira Risk Report
Risk management is an increasingly key concern for any organization in a world characterized by constant disruption. Data is a key tool in mitigating and managing risk, and Jira Align's risk reporting meets this need.
Jira Align Risk Status Reports help teams and managers track impediments to their project progress. The report can be configured to show all risks/impediments, only active ones, risks by the probability of occurrence, and contingency plans to address them. You can assess the insights daily or during review meetings.
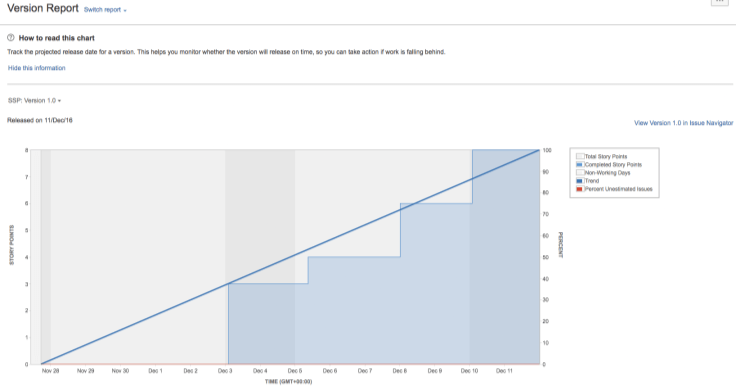
Jira Version Report
This is one of the most essential Jira project reports that product development teams need to stay on track. Version Workload Reports can be generated for teams whose administrators have enabled time tracking. They offer insight into all the unresolved issues in a given version, individual user allocations of pending issues, the users' workload, and how much work is pending for the complete version.
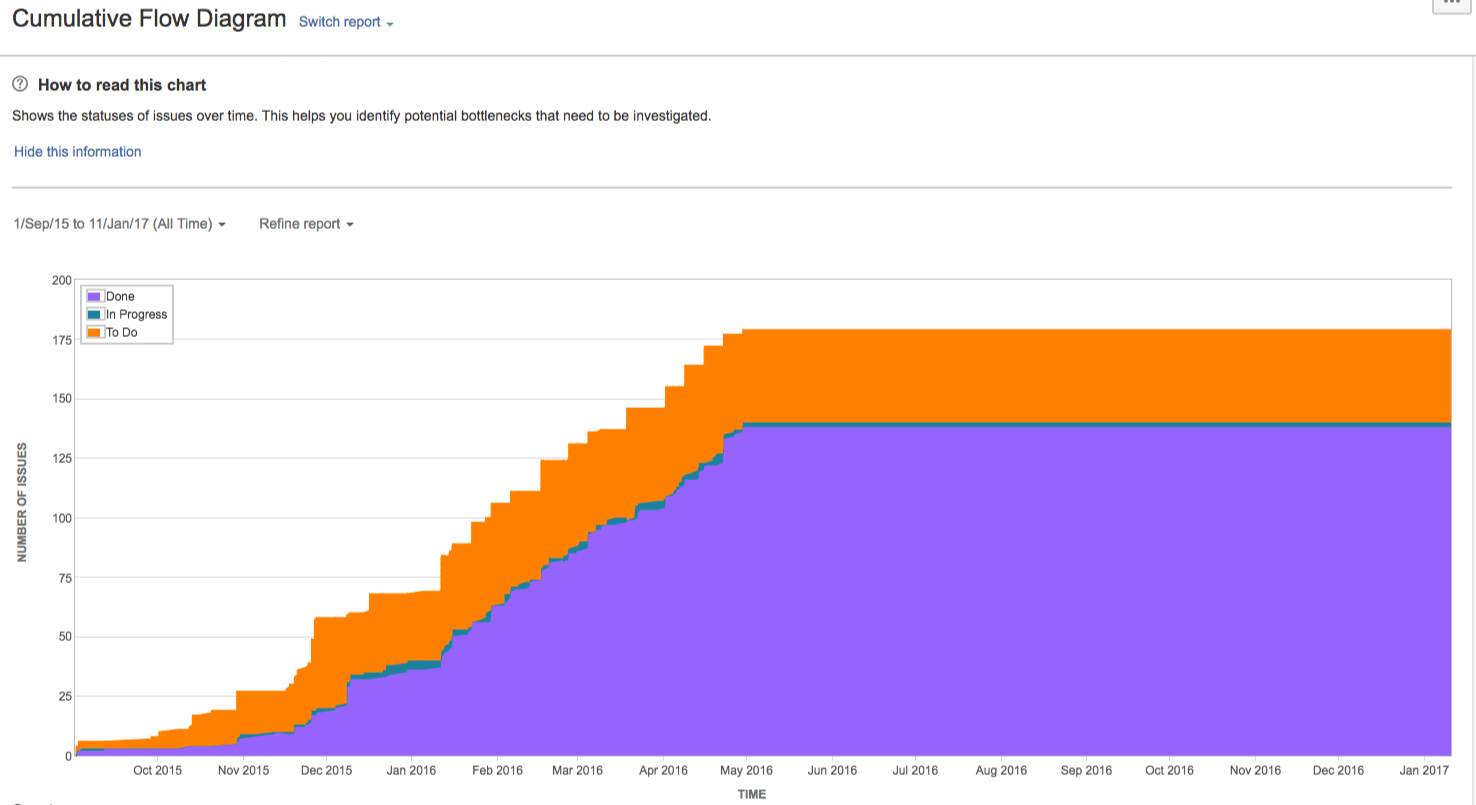
Cumulative Flow Diagrams
Cumulative Flow Diagrams are a source of advanced analytics. For example, it's essential to keep track of different project components to ensure timely delivery. Cumulative flow diagrams fulfill this need by showing key metrics to help you gauge the stability of your workflow, highlighting focus areas for enhanced predictability.
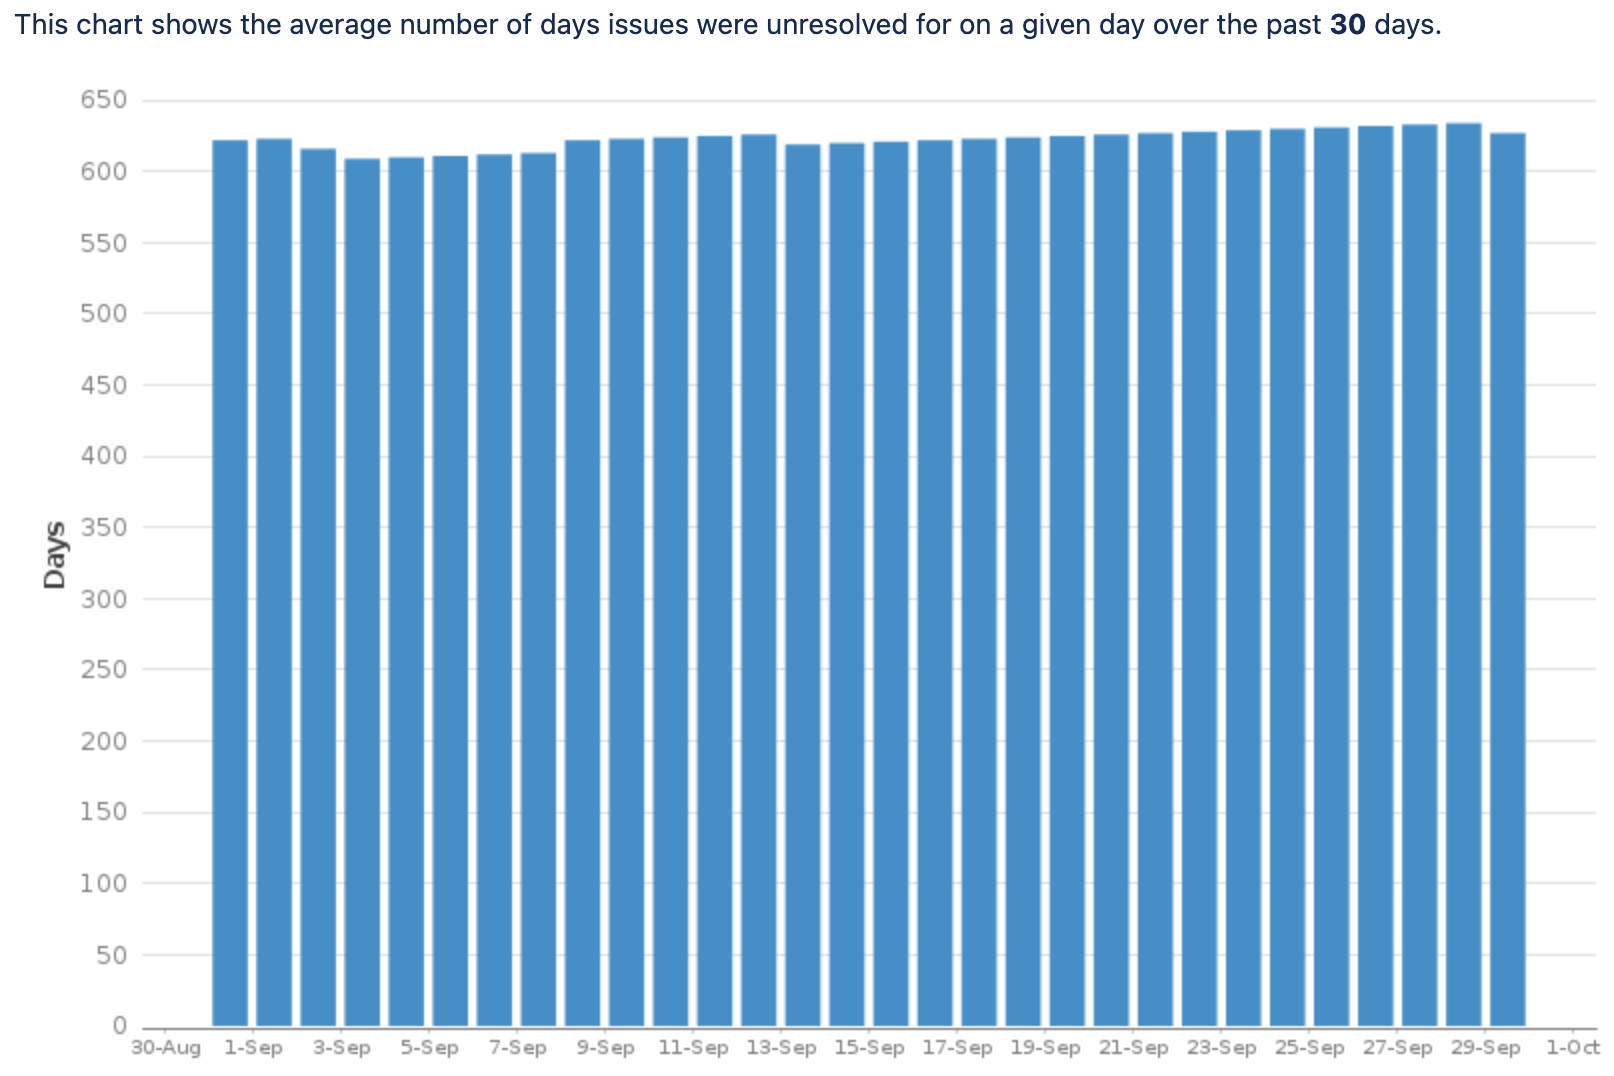
Resolution Time and Average Age Report
One of the incredible things about Jira as a whole is the ability it offers to narrow down to specific insights. A perfect example of this is the Average Age Report. This report indicates the number of days an issue has remained unsolved. This is important as it helps prioritize work allocations, ensuring deliverables aren't overlooked.
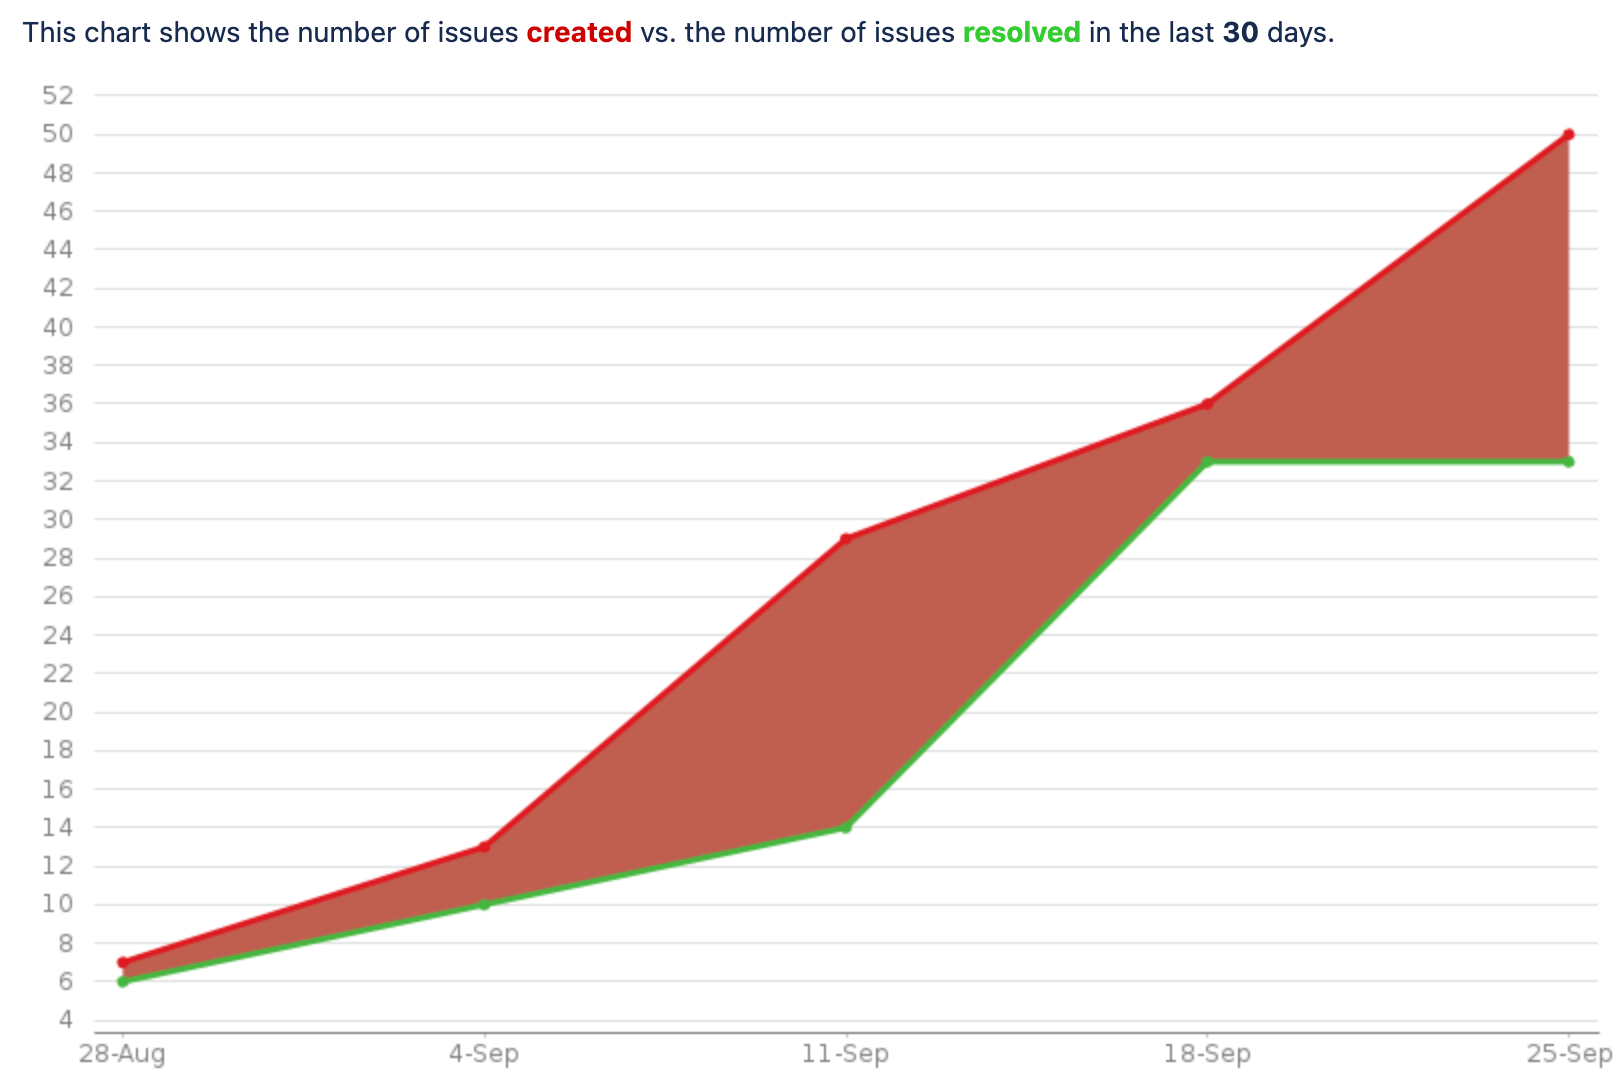
Created vs. Resolved Reports
Another key source of data on productivity is the Created vs. Resolved Report which shows the issues that have been resolved within a certain period. The report contrasts issue creation and resolution. Periods when more issues were resolved than created are colored green, while times when more issues went unresolved, are red. Teams can stay on track, ensuring issues are addressed promptly.
Jira Burndown and Burnup Charts
The burndown chart in Jira displays the amount of work completed in relation to the remaining time before a sprint ends. The vertical or y-axis indicates issues, whereas the horizontal offers an indication of time. Burndown charts help to project the possibility of completing work on schedule. This makes it easier to manage team progress and make necessary changes to stay on track.
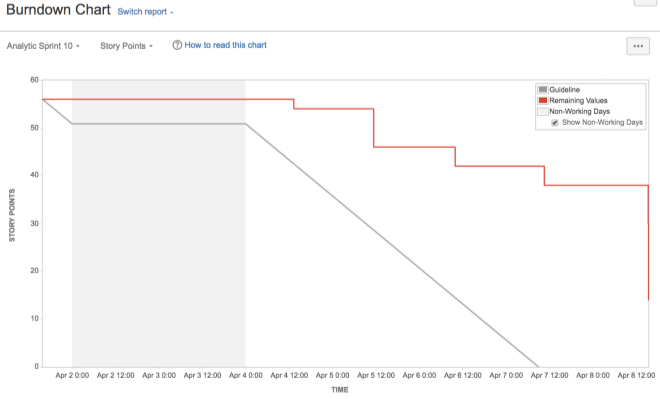
On the other hand, burnup charts show completed work in relation to a project's scope. When there are deviations from the planned progress, they offer alerts allowing for timely project completion.
How to Create Reports in Jira
Now that you're more familiar with the different kinds of reports in Jira, let's examine how to create the ones you need.
Step 1: Choose What Type of Report You'd Like to Create
Start by determining what data you want to visualize and analyze. Go to the project you want to analyze and click on Reports. Select the report you want to create.
Step 2: Select Your Report Parameters
For most reports you can select the project and a specific date range in intervals (days, weeks, months, quarters).
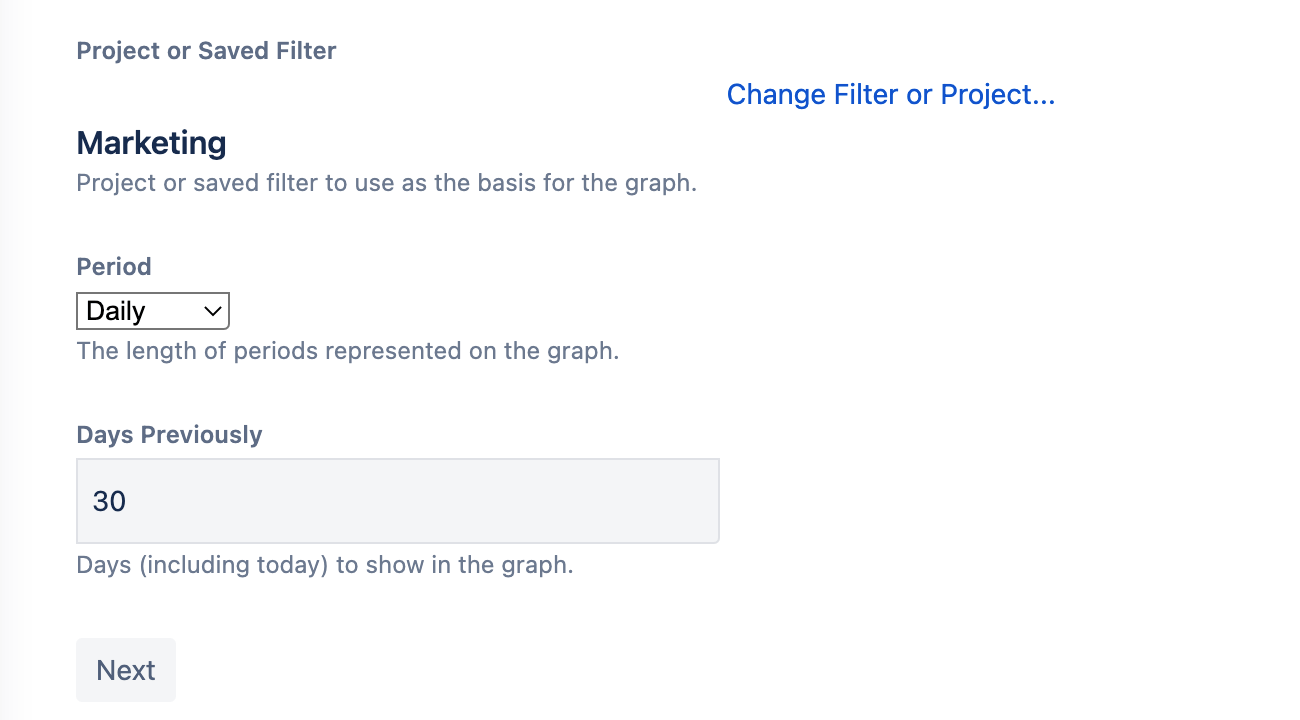
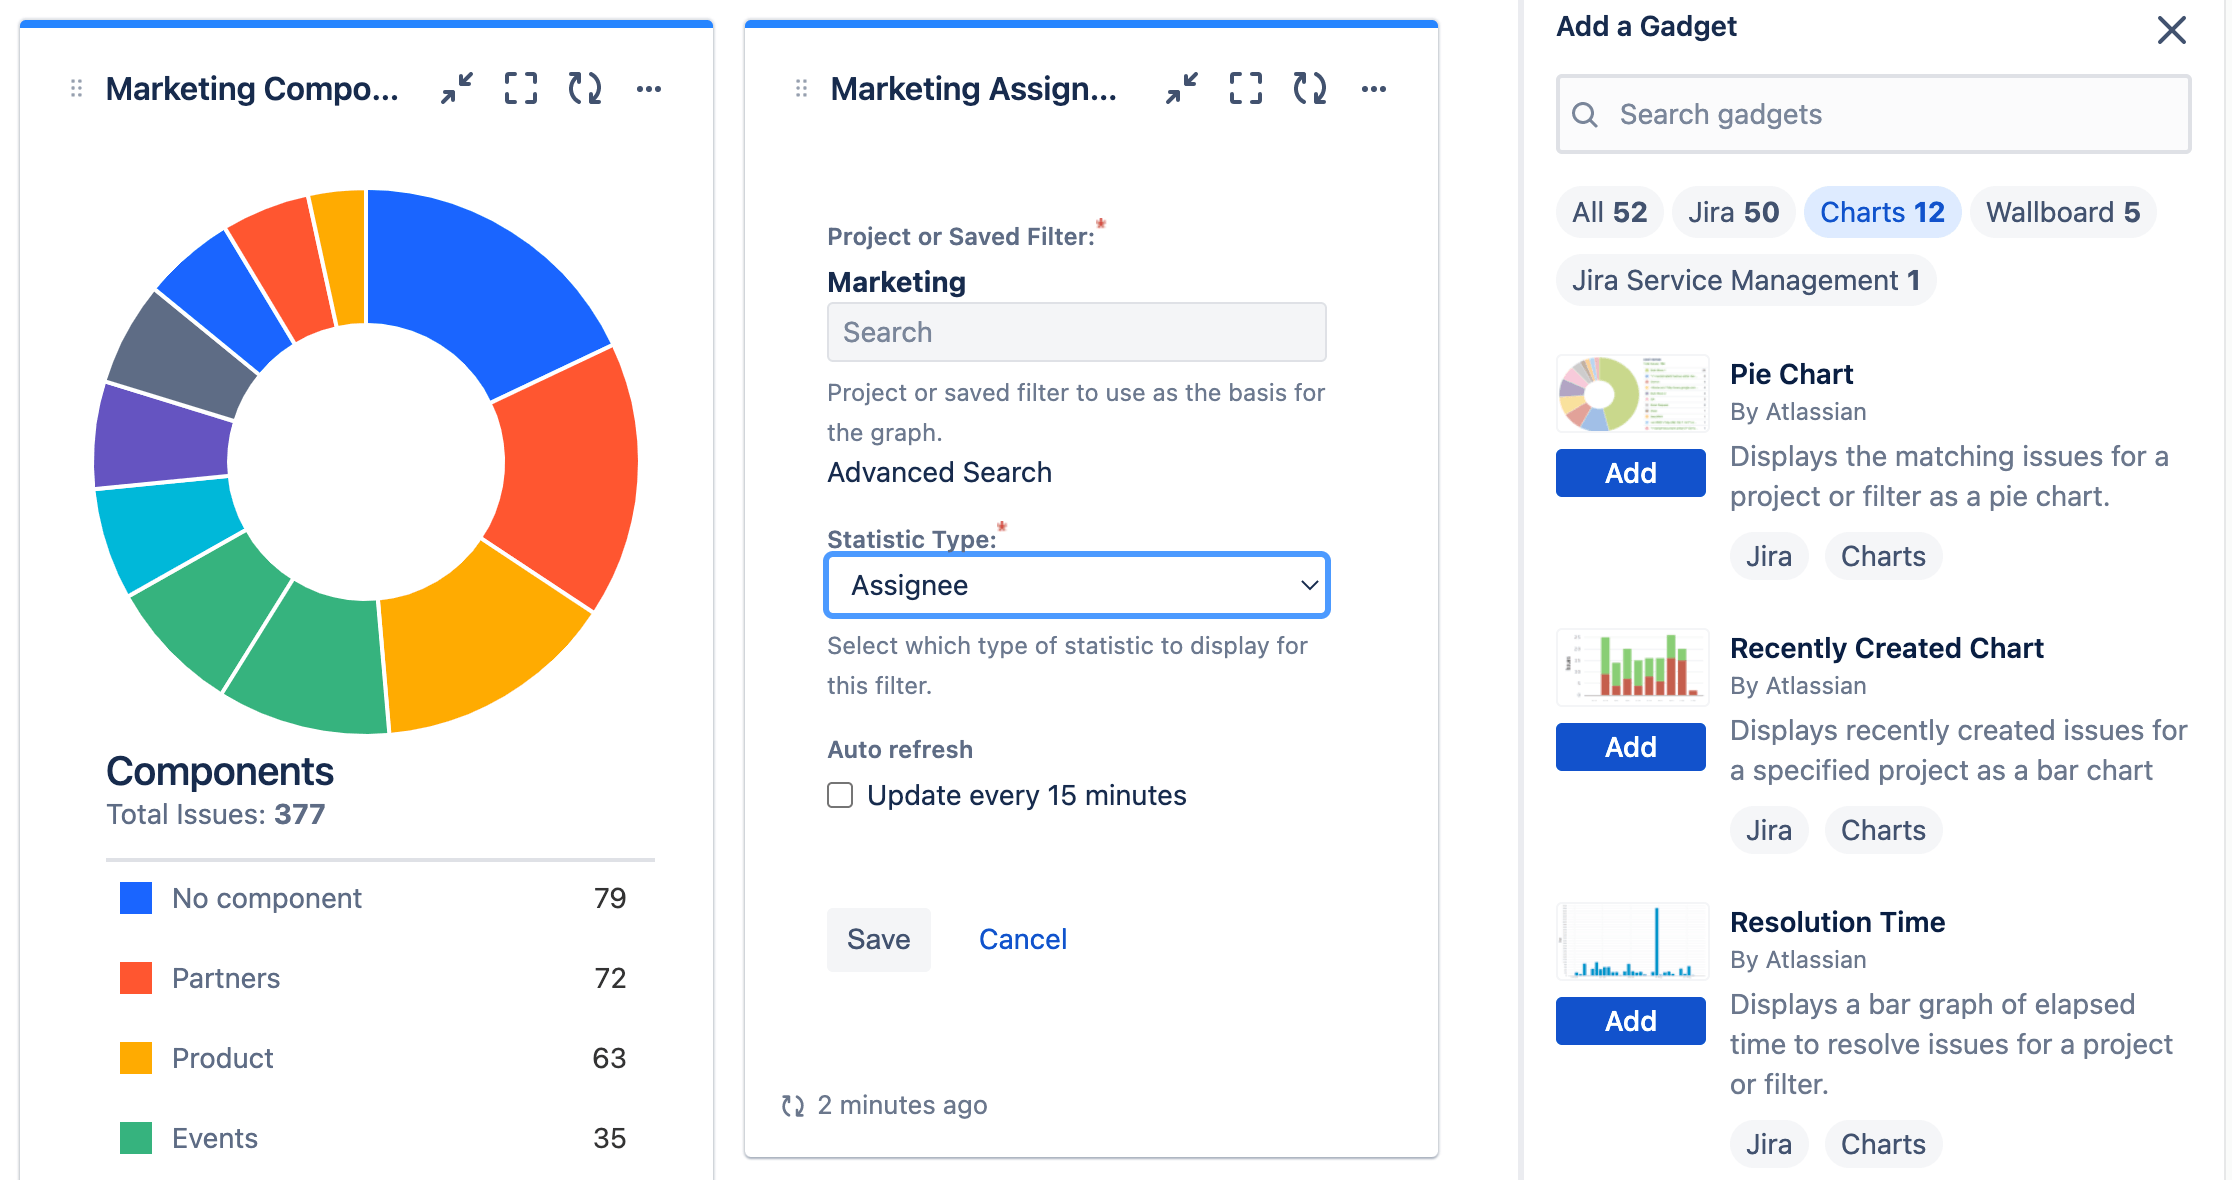
Parameters are report-specific – some reports have a different set of settings. For example the pie chart report shows issues grouped by a particular field (Project, Asignee, Status, Priority, etc.) for a filter you select.
Keep in mind that you cannot save these project reports. Every time you want to check the stats from the Reports section, you'll need to provide report parameters again.
Unless you add these Jira reports to Jira dashboards...
Step 3: Add Jira Reports to Jira Dashboard
Probably the best way to use built-in Jira reports is by adding them to Jira dashboards. Create a new dashboard or edit an existing one, and chose the "Charts" category in the Gadget search to access all available charts. Once added to a dashboard, these reports will be always available in the dashboards section.
Built-in Jira Reporting vs Reporting Apps for Jira
Let's examine the different Jira reporting solutions available, their uses, and their drawbacks to help you select the most suitable option.
Option 1: Use Built-In Jira Reports
Built-in reports come with Jira, are easy to use, and capture commonly used data metrics. The range of reports available in Jira is beneficial for successful project completion. These out-of-the-box offerings enable teams to keep track of issues—from when they are created and how fast they're resolved to workload at a user-specific or collective level.
Even with these helpful features, native Jira reports have several limitations. For example, there aren't many options for customization beyond applying filters. Advanced users who prefer more in-depth data analysis can't really do that.
Though ideal for more straightforward data analysis and smaller teams or projects, there are instances where you could find yourself in need of more flexibility to meet all of your reporting needs. As a result, numerous third-party reporting tools are available on the Atlassian Marketplace.
Option 2: Export and Analyze Data in Excel or Google Spreadsheets
As noted above, you have the option to export Jira data to Excel in the form of spreadsheets. Once exported, tou can create pie charts, graphs, and other visualizations as needed. To reduce performance issues on Jira, exports are limited to first 1000 records.
The downside to this approach is its time-consuming, slow, painstaking nature. You'd need to filter the data to capture only what you need, and once you've downloaded the spreadsheet file, you can't subsequently include additional information. Any future updates can't be captured without downloading spreadsheet files every time. Ultimately, data collation and visualization using this method can only be done manually. This significantly increases the risk of errors in the process.
There are some 3rd party Jira to Excel exporting apps that offer a lot more functionaly.

Option 3: Connect to External Reporting Tools
Another reporting option is using external reporting tools. This entails integrating Jira with business analytics tools such as Microsoft Power BI or Tableau, among others available on the Atlassian Marketplace. These tools connect via the Jira REST API interface, which has many limitations.
One limitation with the Rest API connectors is the need to manually define the Jira data model (imported data set). There is also a very limited support for custom fields. You can't use Jira gadgets. And, because most REST API-based Jira apps don't support incremental data imports, importing data from Jira could take a long time and impact Jira performance, especially when working with large data sets.
Option 4: Use Integrated Jira Reporting Apps
Dedicated reporting apps that integrate with Jira are the best solution for more advanced custom Jira analysis. They provide the most options and benefits enabling report customizations way beyond the capabilities of built-in reports. These apps give you more control, allowing for automation, sharing, accessibility, and customization.
Which Jira Reporting Solution is Right for You?
- If your reporting needs aren't overly comprehensive, then native Jira reporting will do.
- For smaller teams of 10 or fewer people looking for more detailed analysis at less frequent intervals (weekly, bi-weekly or monthly) and who don't need to share or export data, exporting reports to Excel could suffice.
- Suppose your company already uses external BI tools for other purposes. In that case, connecting them to your Jira instance makes sense if you can accept limitations and performance issues associated with connector apps.
- If you are serious about up-to-date reports right within Jira, you should consider special reporting apps available on Atlassian Marketplace.
eazyBI – the Reporting Powerhouse for Jira
eazyBI for Jira combines the features and benefits of other reporting solutions, making it highly capable for advanced reporting and custom analysis while maintaining ease of use for simple reporting needs. eazyBI for Jira is:
- Built for Jira: As a trusted Atlassian Platinum Vendor Partner, eazyBI works seamlessly within Jira. eazyBI greatly extends the power of Jira, by providing a complete data model with custom fields, measures, formulas, dimensions, calculations, reports and gadgets for Jira, as well as support for third-party apps and data sources.
- Simple: Building simple custom reports is as easy as it gets. Use dozens of report templates out of the box. Modify, adapt, and build additional reports with the built-in drag-and-drop report builder.
- Powerful: eazyBI is a fully featured business intelligence tool (like external BI tools) that can analyze data from Jira, SQL databases, REST APIs, spreadsheets, and other tools—all from within Jira. Advanced custom calculations provide tools for adding new measures and calculations for your ever-growing reporting needs.
- Flexible: eazyBI for Jira features fully customizable pivot reports and charts similar to using Excel. You can build virtually any report based on connected data sources.
- Automated: Once you set it up, all data updates are automatic. No more manual data exports and report updates. All your reports are up-to-date everywhere.
- Shareable: You can easily share your charts and reports as jira gadgets in Jira dashboards. You can publish your Jira reports both in Jira and Confluence. Or, you can even embed your reports in iframes outside Jira or export them to XLSX, PDF, or CSV.
- Optimized for performance: eazyBI supports incremental data updates and online analytical processing (OLAP) technology, allowing for concurrent data analysis from various database systems. This makes it especially ideal for working with huge data sets and generating complex reports.
- Portable: The core of eazyBI is the same for all platforms: Jira Server, Jira Cloud, or Jira Data Center. This means you can start using eazyBI on one platform and migrate to another at any time without losing your report library.
Custom Project Reports & Dashboards With eazyBI
Project Overview report
There are different reports you can build with eazyBI. A good example is the Project Overview report. As the name suggests, it shows the number of issues created and resolved throughout the project timeline. You can customize it in several ways, such as filtering date ranges or specifying assignees.
Project Progress Report
The Project Progress Report indicates the issues to be done, how many are complete, and how many are pending. Project progress can be expressed as a percentage, and you can choose whether to view it for a single project or compare multiple ones.
Total Resolved Issues
The Total Resolved Issues From Created Report is a quick and easy way to check the resolution rate for issues. It's best used for high-level overviews.
Created vs. Resolved Issues
For a more in-depth analysis of issue completion over time, the Created vs. Resolved Issues Over Time Report captures the number of issues created, issues resolved, the average number of days spent, and how many issues are still open. Analyzing this report can aid the process of mapping out trends around issue resolution. There's also the added functionality to filter the report by issue type, priority, and assignee.
Custom Jira Agile Reports
Sprint Overview Report
The Sprint and Story Point Overview presents key metrics for project sprints. With a quick glance, you can tell the number of completed sprints, the velocity for the most recent sprints, and the predicted number of sprints left until completion.
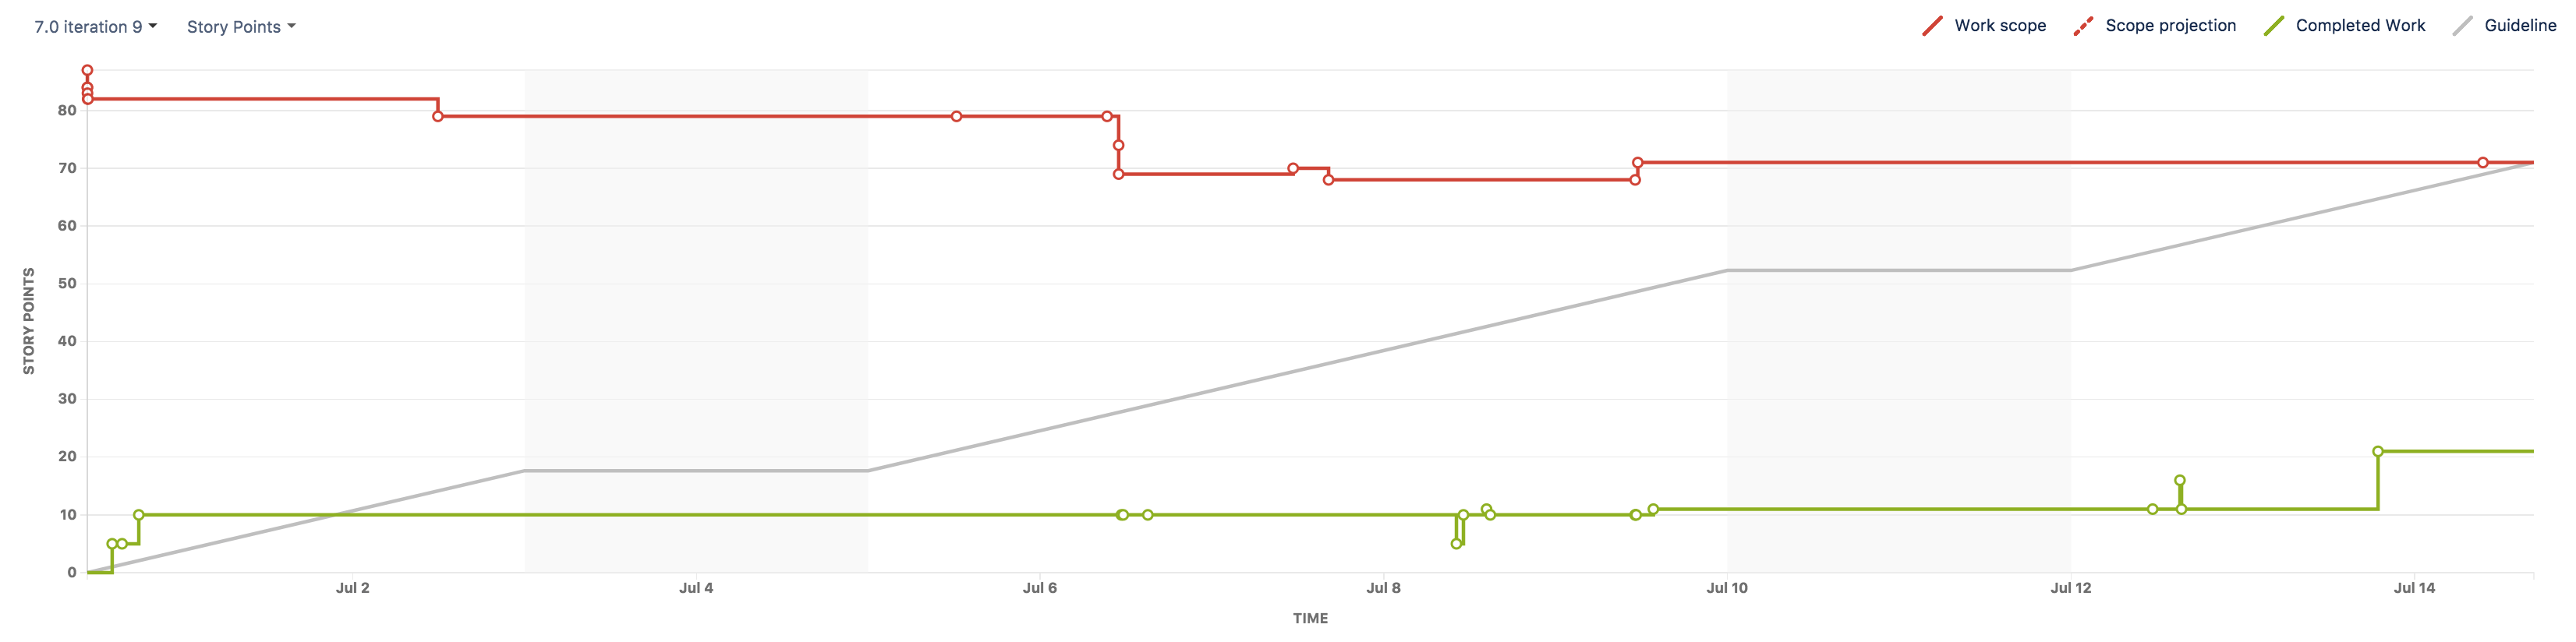
Sprint Timeline Chart
The Sprint Timeline shows changes in the scope of a sprint. For instance, if issues were added after a sprint had already started, you can distinguish between the planned start and completion timeline and the actual completion time.
Active Sprints Story Points Burndown Report
The Active Sprints Story Points Burndown Report (for multiple sprints) is useful in cases where work gets done in parallel sprints. It tracks the resolution of story points across the different relevant sprints factoring in all start and end dates. That way, regardless of when a sprint began, it's still trackable within the report.
Sprint Progress and Velocity Chart by Epic
The Story Points Progress and Velocity by Sprints in Epic Report is used to analyze the level of progress made across teams, epics, assignees, or other project components. Based on current velocity, the report improves the predictability of completing tasks, as captured in the "Predicted Sprints to Complete" column.
Custom Sprint & Status Reports
If you are using agile methodologies, you can create a set of charts and reports for jira to overview all your sprint performance indicators quickly. These are reports like velocity charts, burndown charts, cycle time reports, or version reports, to name a few.
Sprint Velocity Chart
For example, this is the Sprint Velocity Chart, which is useful in tracking work committed and work completed.
Sprint Story Points Burndown
Another Sprint Report example is the Story Points Burndown in Sprint Chart. It helps track the remaining work and predict the likelihood of achieving the set sprint goals.
Sprint Issues Burndown Report
The Issues Burndown in Sprint Report tracks both completed and remaining work totals for a specific sprint. This report is used when progress is evaluated based on the number of issues rather than story points, making it an essential asset in trend mapping and analysis.
Sprint Issue Transition Dates Report
In situations that call for a closer look at issue handling down to the sprint level, the Sprint Issue Transition Dates Report helps keep tabs on when a given issue moved from one status to another—e.g., from In Progress to Done. You can filter the report by issue type (standard or all), assignee, or other filters while viewing a timebox for the selected sprint from its start date to completion.
Forecast and Management Reports
Project Prediction Report
The Project Prediction Report indicates the average issue resolution rate between the start date and the creation date. This makes it easier to establish if you're on track to resolve all issues within the project end date. eazyBI makes it easy to create a report in Jira.
Version Reports
Version Reports are ideal for unreleased versions. They are best deployed when story points have both resolved and unresolved issues, showing resolved story points against the predicted completion time.
Predicted Completion Date
The Predicted Completion Date Report is great for quick project completion date estimates. It factors in the number of currently open issues from Jira and the progress made in the past year to provide a projected release date on a rolling basis.
Open Issues Trend
With the Open Issues Trend Report, it's easy to identify patterns in the current number of open issues. The report can be filtered by issue priority levels and enables users to gauge how many issues are likely to still be open in the future in relation to the end date.
Workload & Time Reports for Scrum Teams
Hours Spent by Issue Type and User
The Weekly Hours Spent by Issue Type and User Report is a particularly useful type of time-tracking visualization in eazyBI, providing timely insight for scrum teams. It shows how much time is spent per user and per issue within a given period. It comes in handy when evaluating performance.
Estimated and Logged Hours Report
The Estimated and Logged Hours in Version Report makes it easier to compare how much time was initially allocated to work on a particular version with how much has actually been spent. As such, any overestimated time is accounted for.
Sprint Time Tracking Burndown Report
The Time Tracking Burndown in Selected Sprint Report offers a trend map of current time usage. You can quickly see if your work is falling behind by assessing hours spent. The report estimates how much additional time the selected sprint will require until completion.
Logged Hours by User
For advanced time tracking and management, eazyBI offers a Logged Hours by User on Assigned and Unassigned Issues Report. This specific report shows user-agnostic time usage, and user-specific logged hours for issues in general or the specific issues assigned to a user across projects.
Better Project Management With Powerful Jira Reporting
Overall, reporting in Jira benefits organizations looking to harness the power of data. Numerous options regarding report types and scope levels lead to better reporting. These reports can be created and assessed at different scopes at an individual, team, project, or cross-project level.
Furthermore, Jira reports can be narrowed down to specific focus areas such as sprints, team velocity, or product versions, offering an end-to-end work overview.
With this advanced level of reporting, teams are equipped to plan better for future endeavors and improve their tracking of project components and deliverables. Over time, teams benefit from improved project execution.
The work environment continues to evolve and become more complex. Teams need advanced data analysis and reporting to achieve better outcomes. With eazyBI, you can easily:
- Create custom reports based on your needs
- Analyze Jira metrics and make better, data-driven decisions
- Measure and analyze your KPI performance
- Keep teams involved at every stage of a project
If you're looking to make the most of the capabilities that come with Jira reports, choose eazyBI for Jira. Get started with a free 30-day trial.