The Ultimate Confluence Analytics App
Transform your Confluence experience with powerful analytics and limitless custom reporting. Monitor page views, searches, content, tasks, attachments, and more. Analyze, visualize, and share insights with interactive and up-to-date reports, charts, and dashboards, embedded in Confluence pages.
Start Your Free TrialAll-In-One Confluence Analytics Solution
Experience powerful analytics beyond basic pageview and content stats with an advanced Confluence reporting solution. Monitor the complete content lifecycle, receive email alerts, access user reports, import and export external data, and enjoy seamless sharing and embedding.

Confluence Analysis
Monitor content, views, searches, tasks, and attachments using a flexible analytics tool.

Unlimited Custom Reports
Create your own custom reports, pivot tables, and charts with a drag-and-drop report builder.

Embed in Confluence
Embed unlimited, fully interactive reports and dashboards anywhere in your Confluence pages.

Content Alerts
Set email alerts based on trigger values in any report, monitoring your content, tasks, and more.

Security & Compliance
Ensure data security, privacy, and compliance with robust built-in features.

Manage User Access
Manage user access effectively to maintain control over your data.

Export Report Data
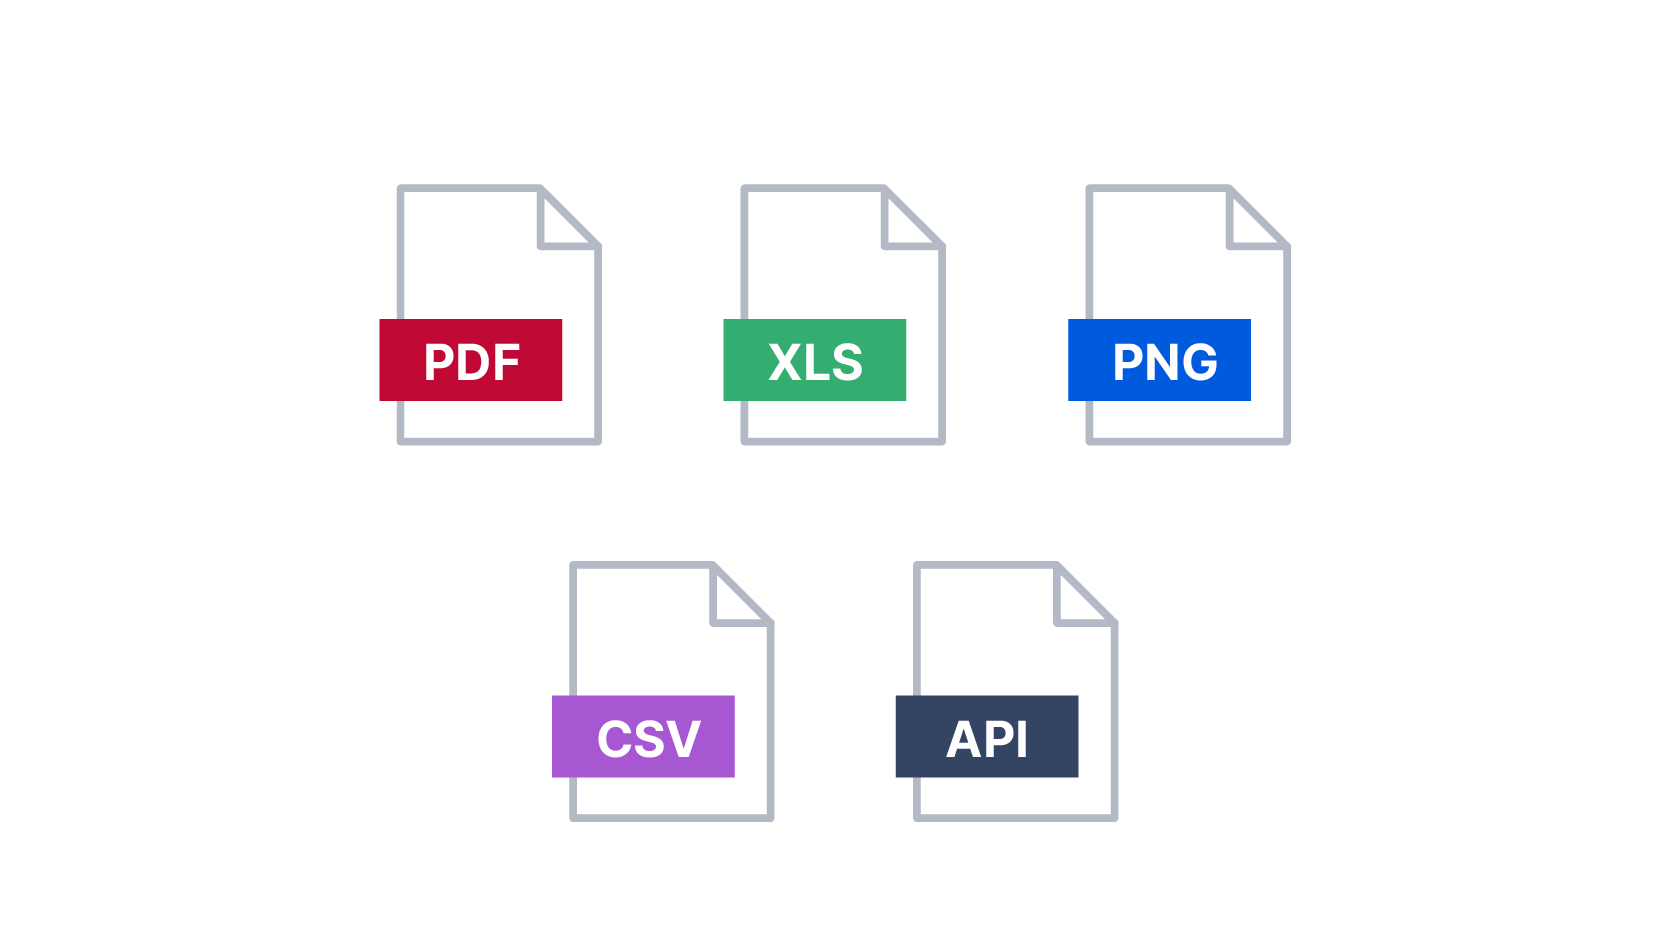
Export data to CSV, Excel, PDF, and PNG formats for further analysis and sharing.

Analyze External Data
Import and analyze data from Google Sheets, SQL, REST, CSV, Excel, and more.

Unlock the full potential of your Confluence data with powerful analytics and reporting tool for comprehensive content lifecycle monitoring, in-depth pageview and search analysis, and support for external data sources.
Custom Report Builder
Content Lifecycle Monitoring
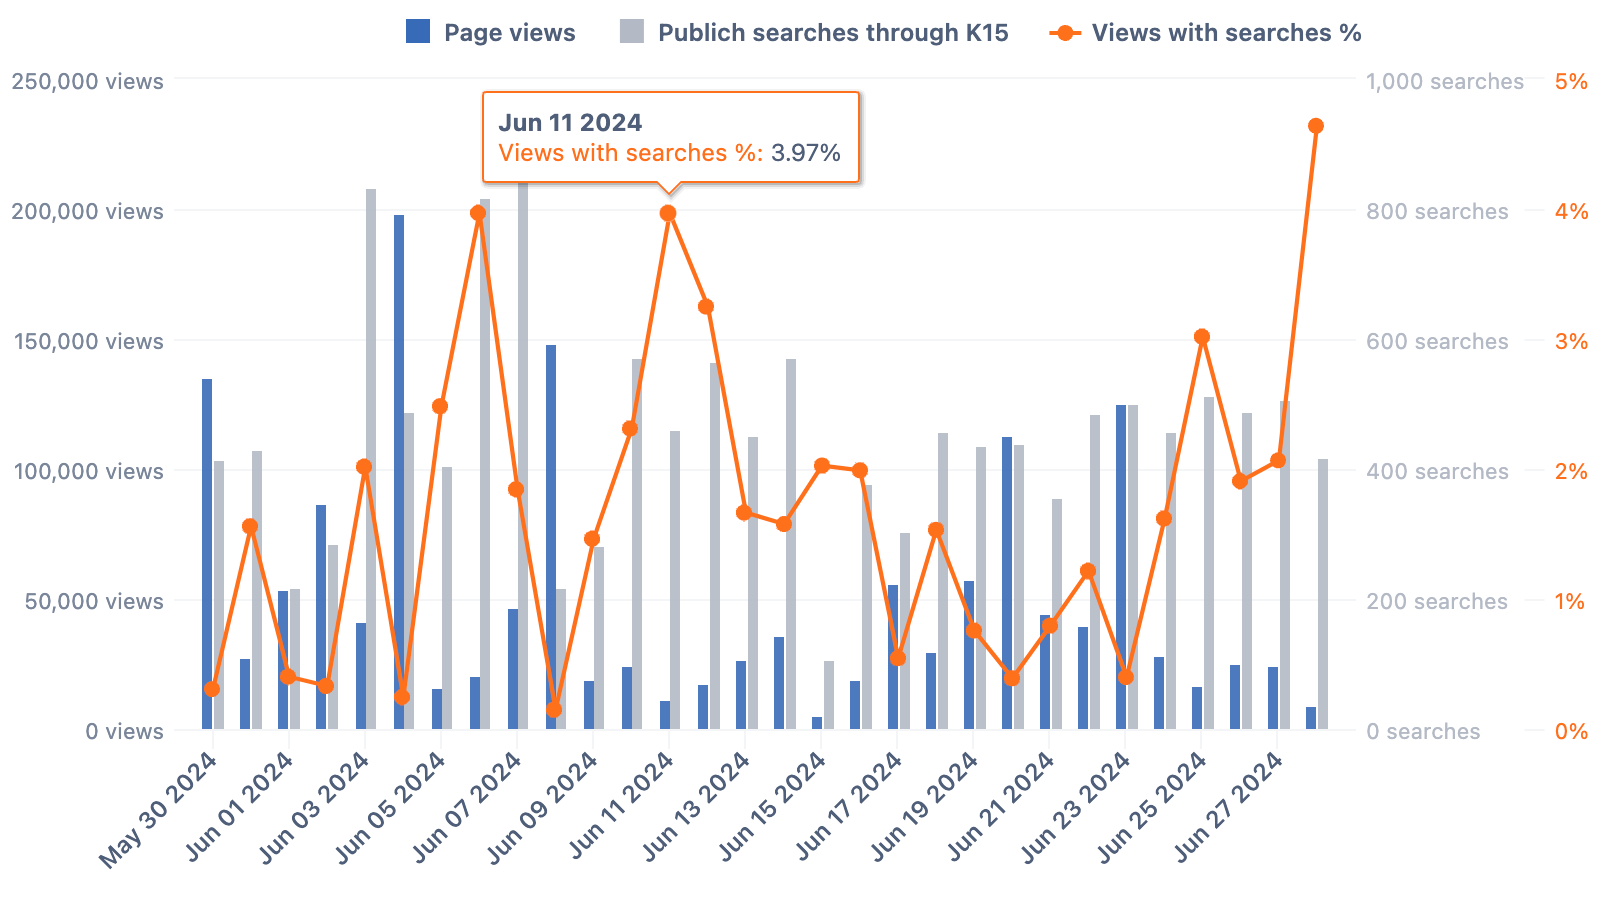
Pageview Analysis
Search Analysis
Analyze External Data

Visualize your Confluence data using a range of customizable charts, interactive dashboards, and built-in advanced calculation, providing a comprehensive overview and deep insights into your content trends.
Many Chart Types
Conditional Formatting
Advanced Visualization
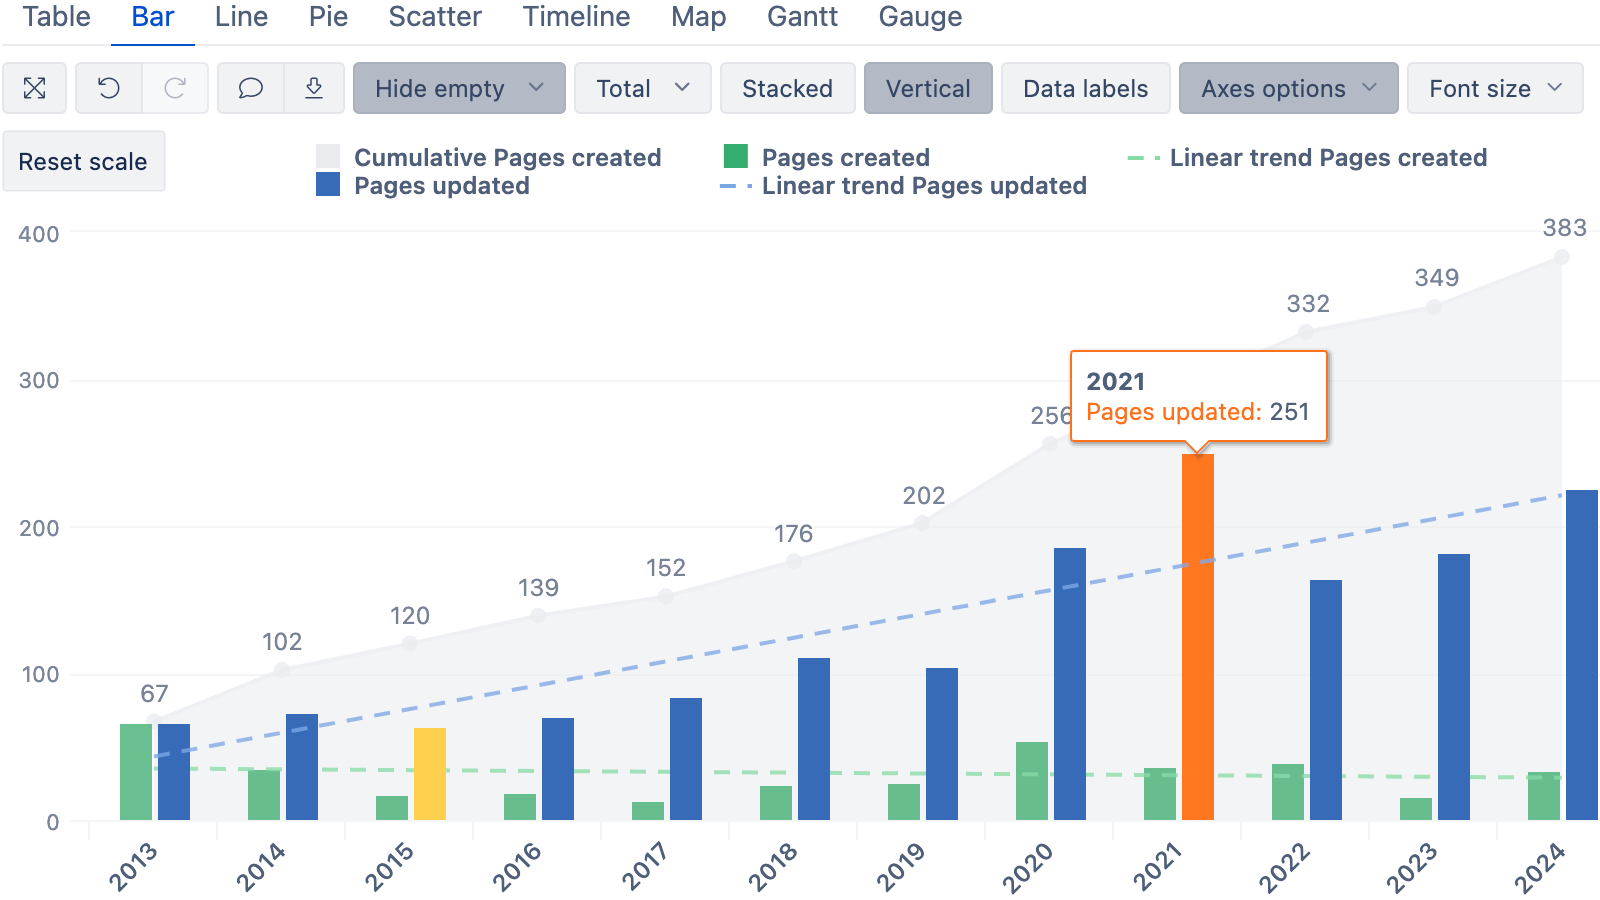
Chart Customizations
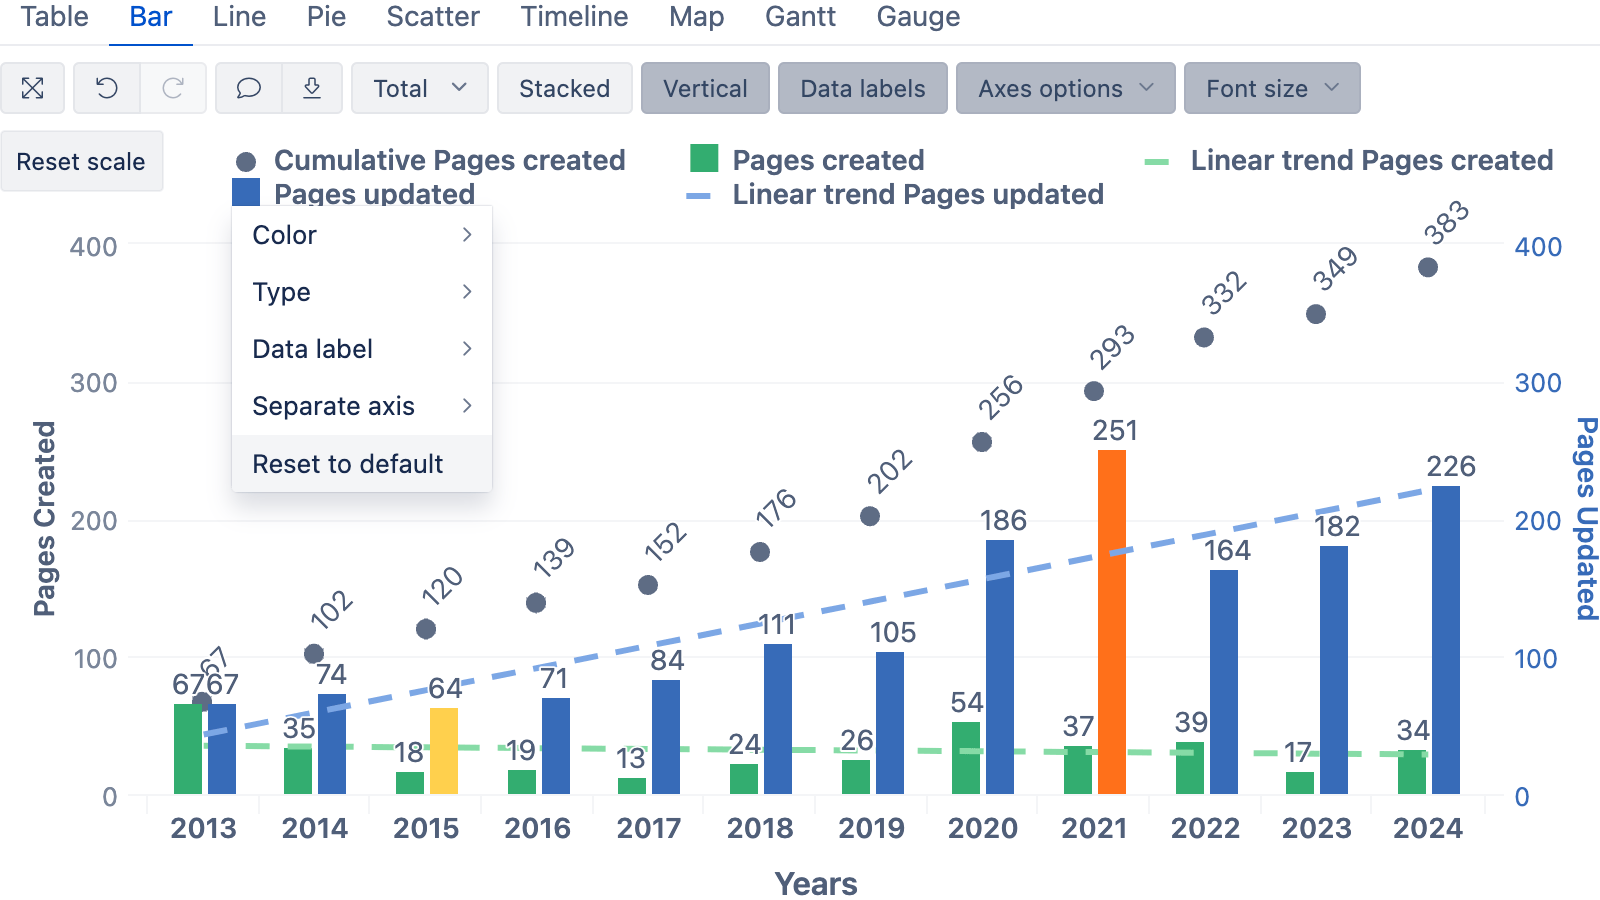
Interactive Dashboards


Dive deep into your Confluence data with hierarchical reports, advanced sort and filter options, attachment analysis, task tracking, and user reports.
Hierarchical Exploration
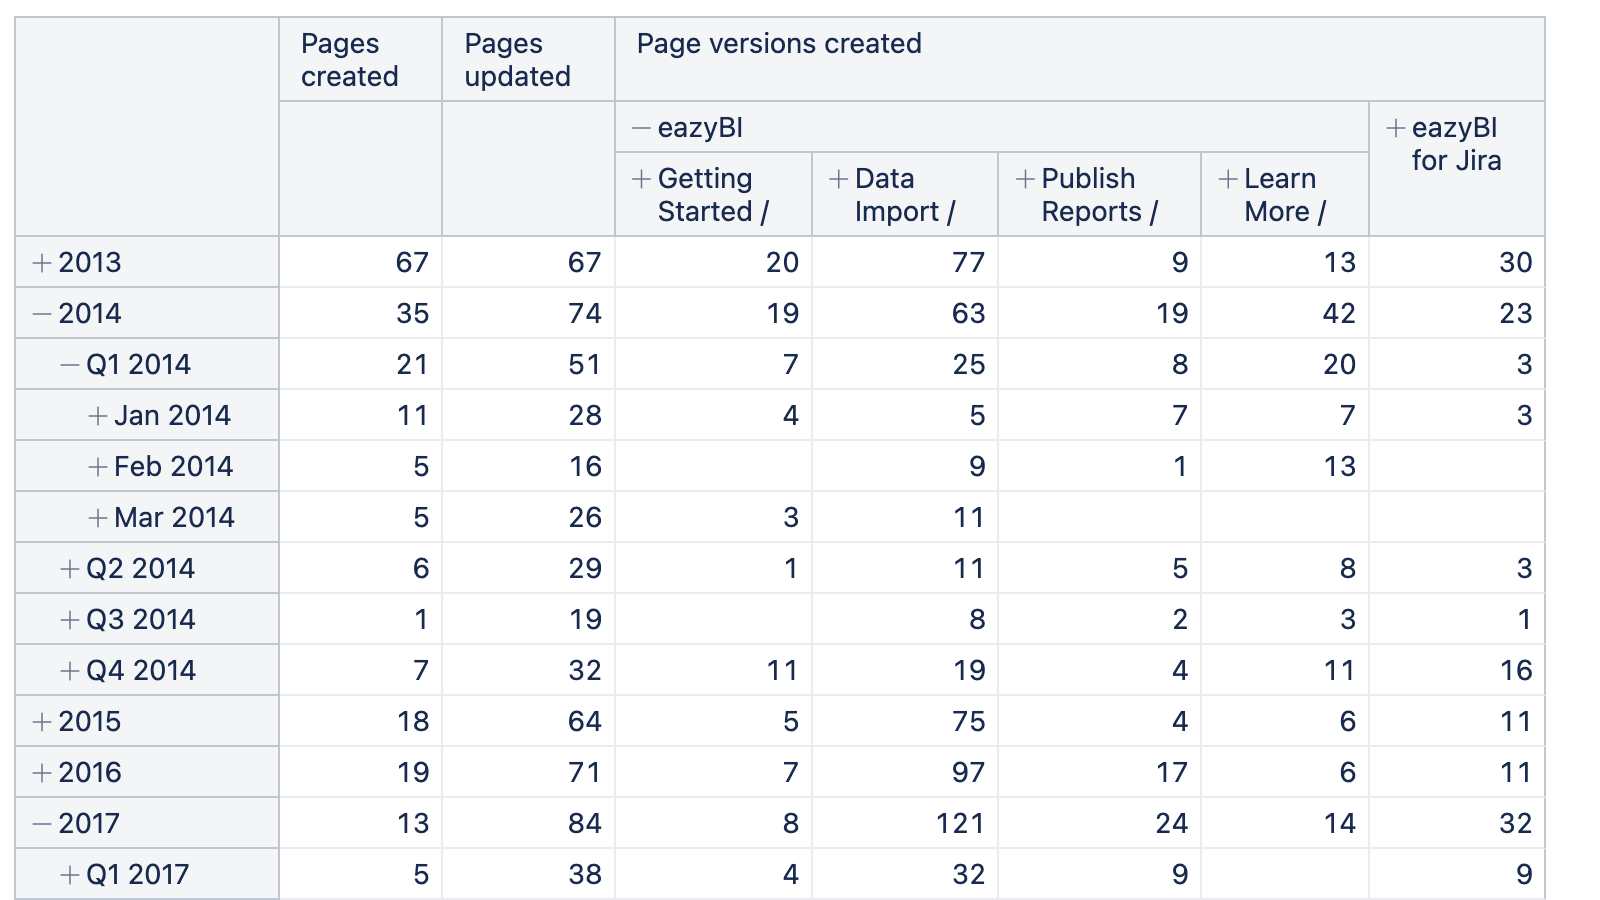
Sort & Filter
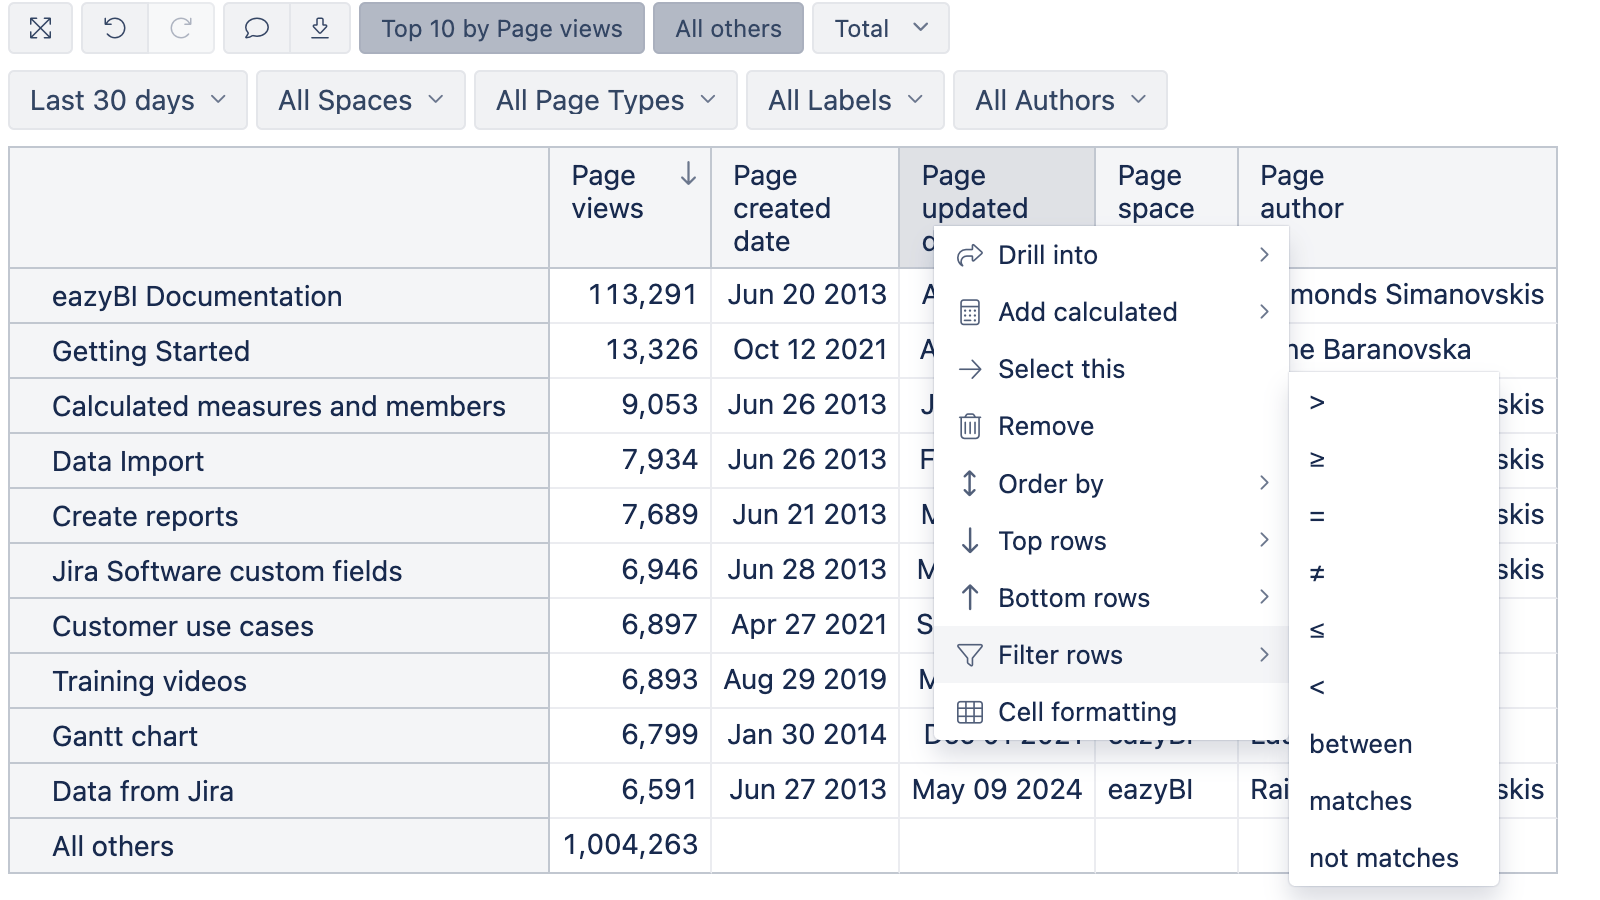
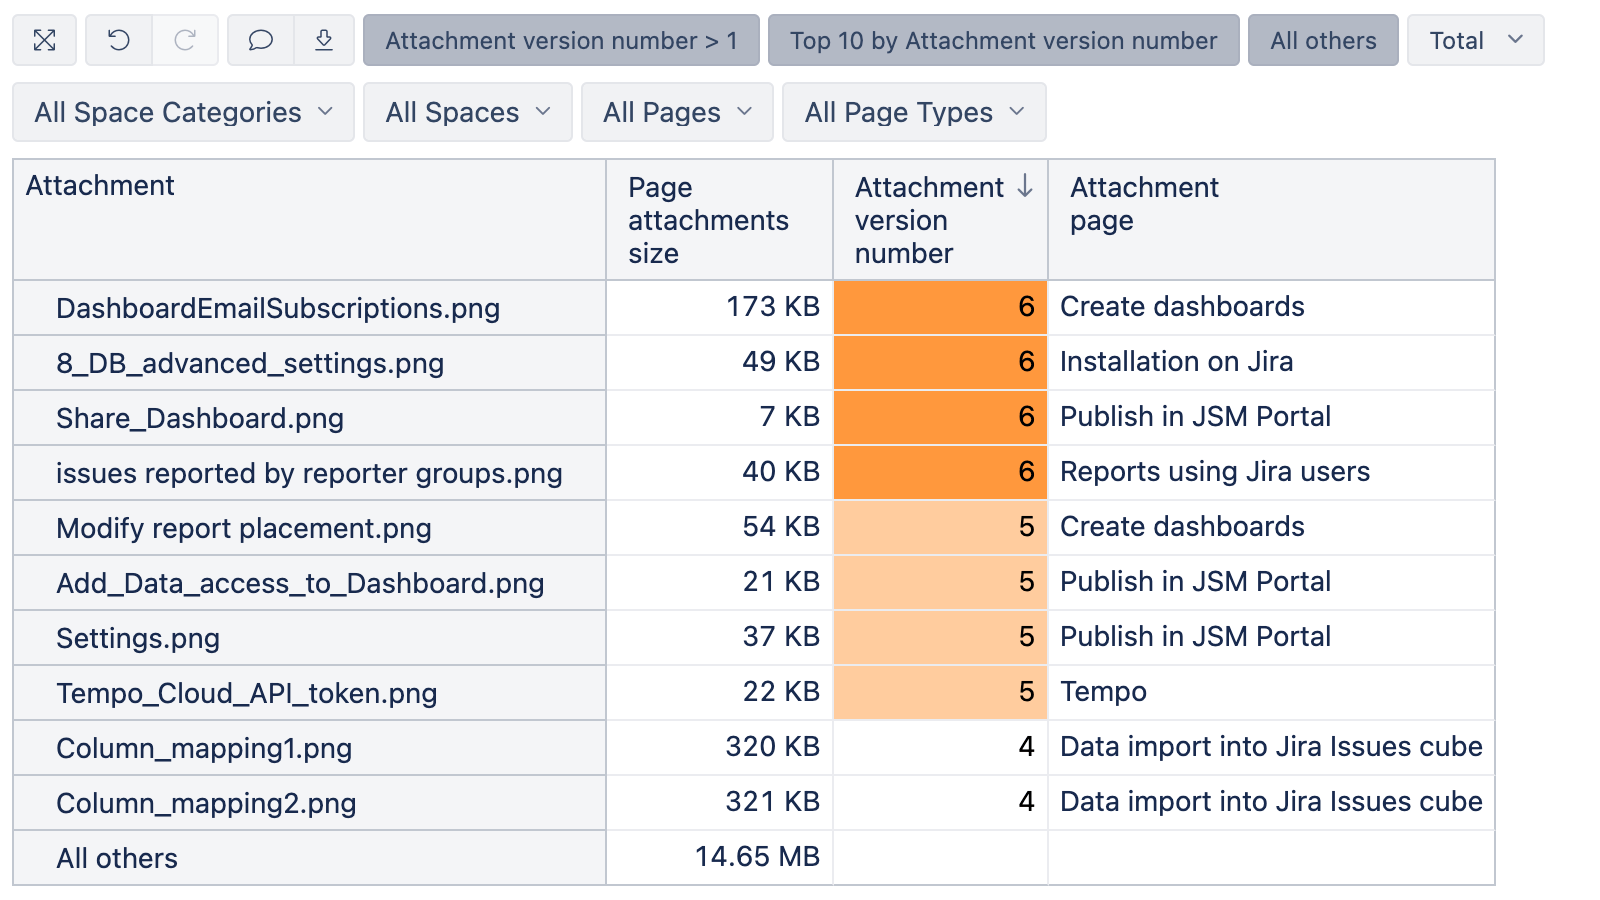
Attachment Analysis
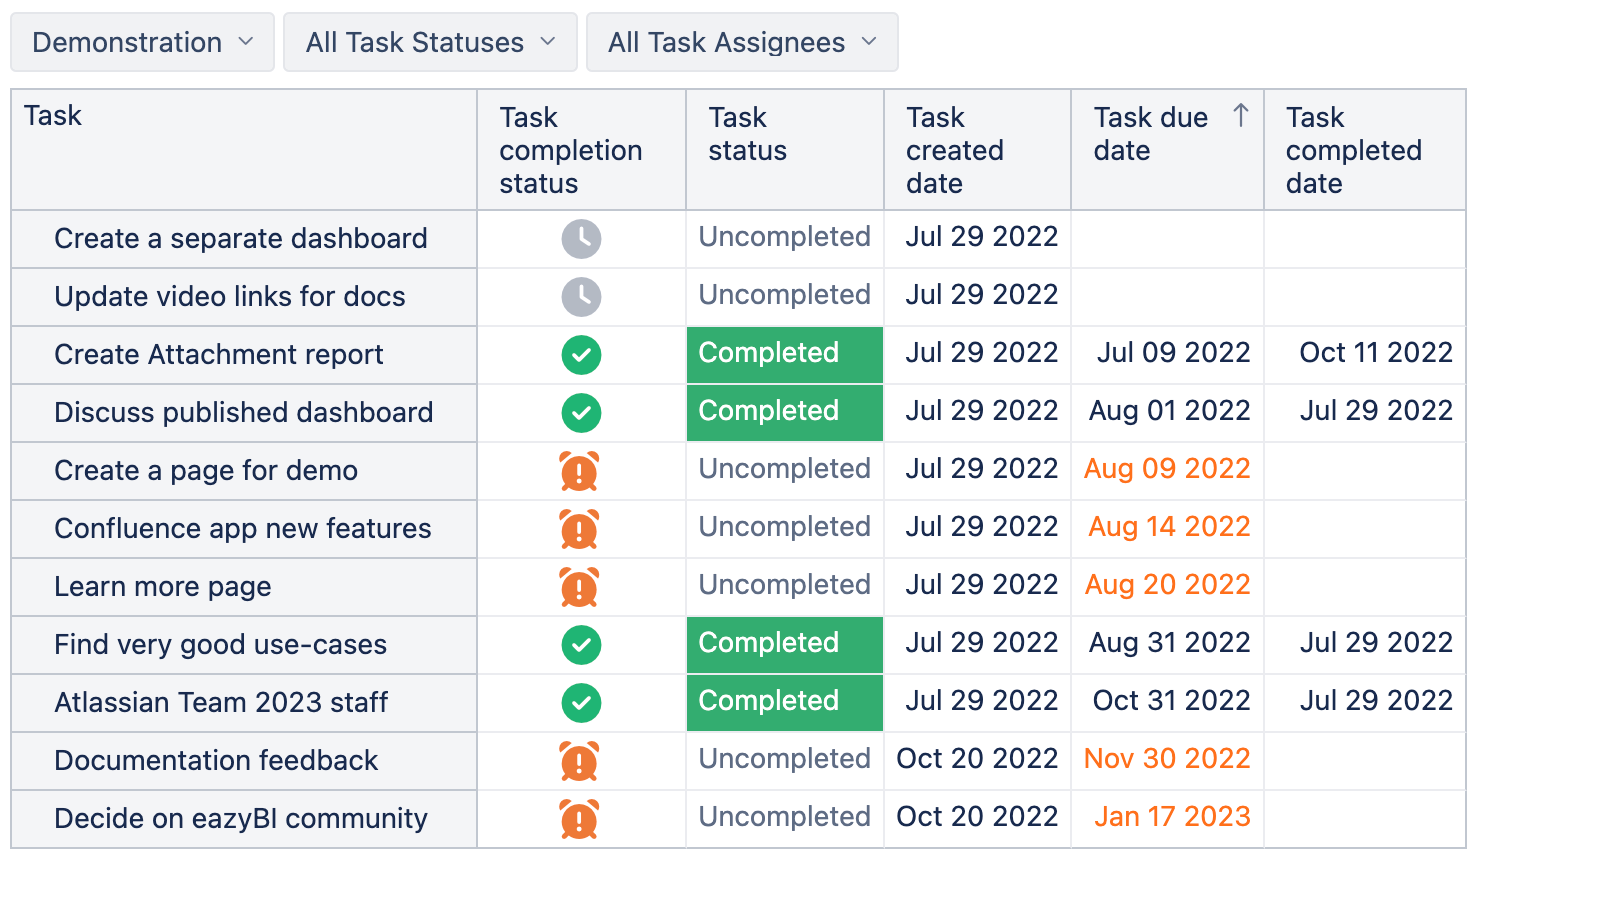
Task Tracking
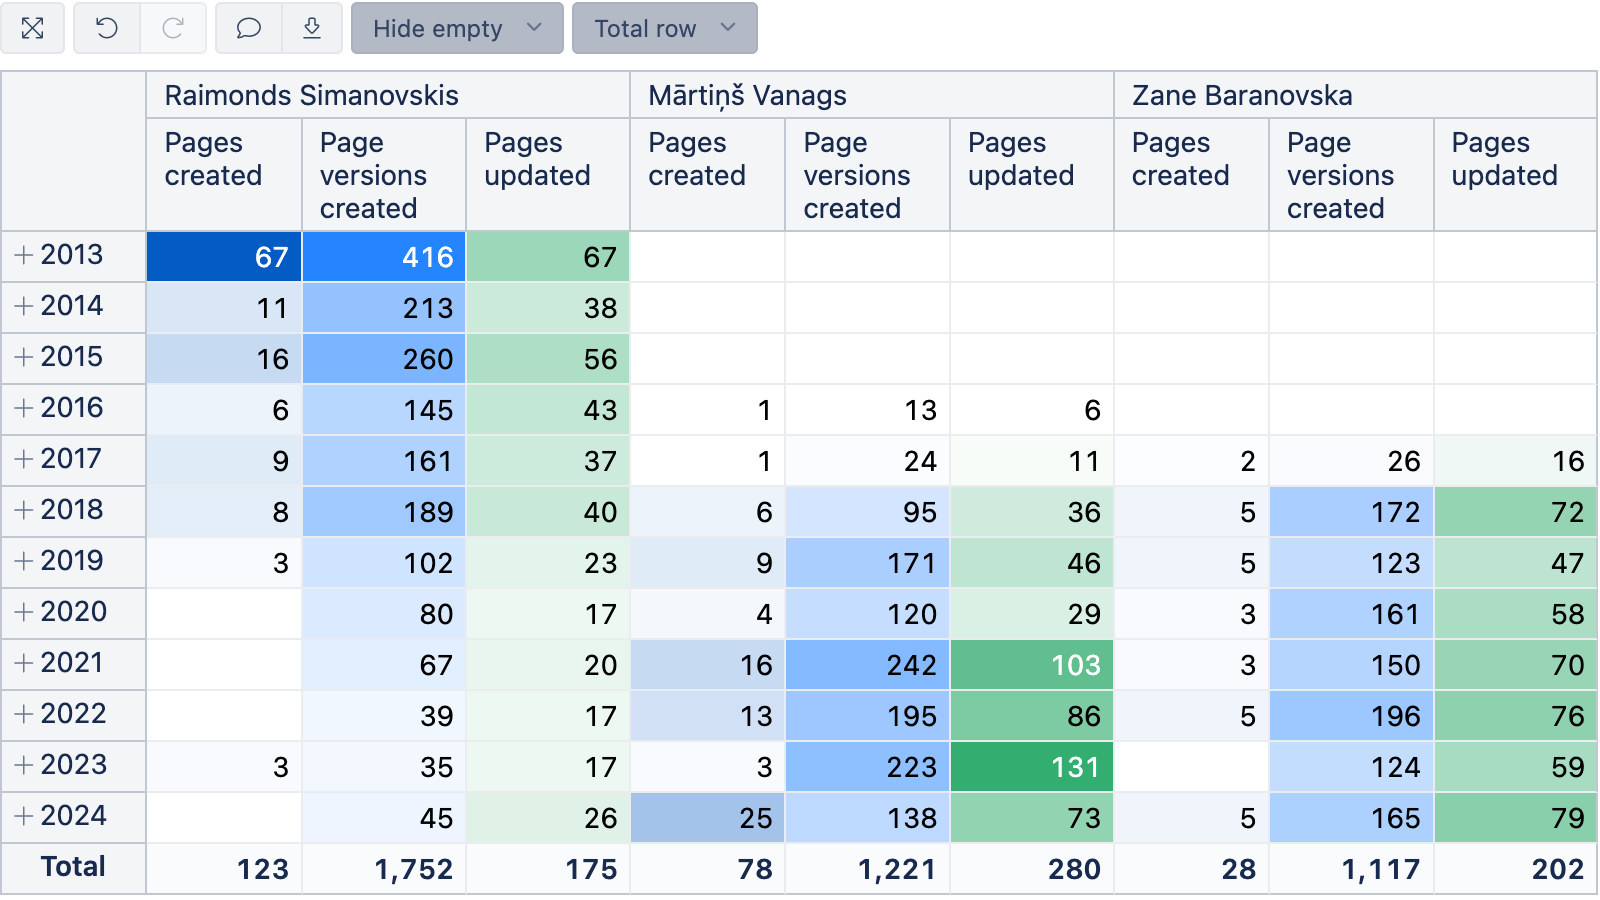
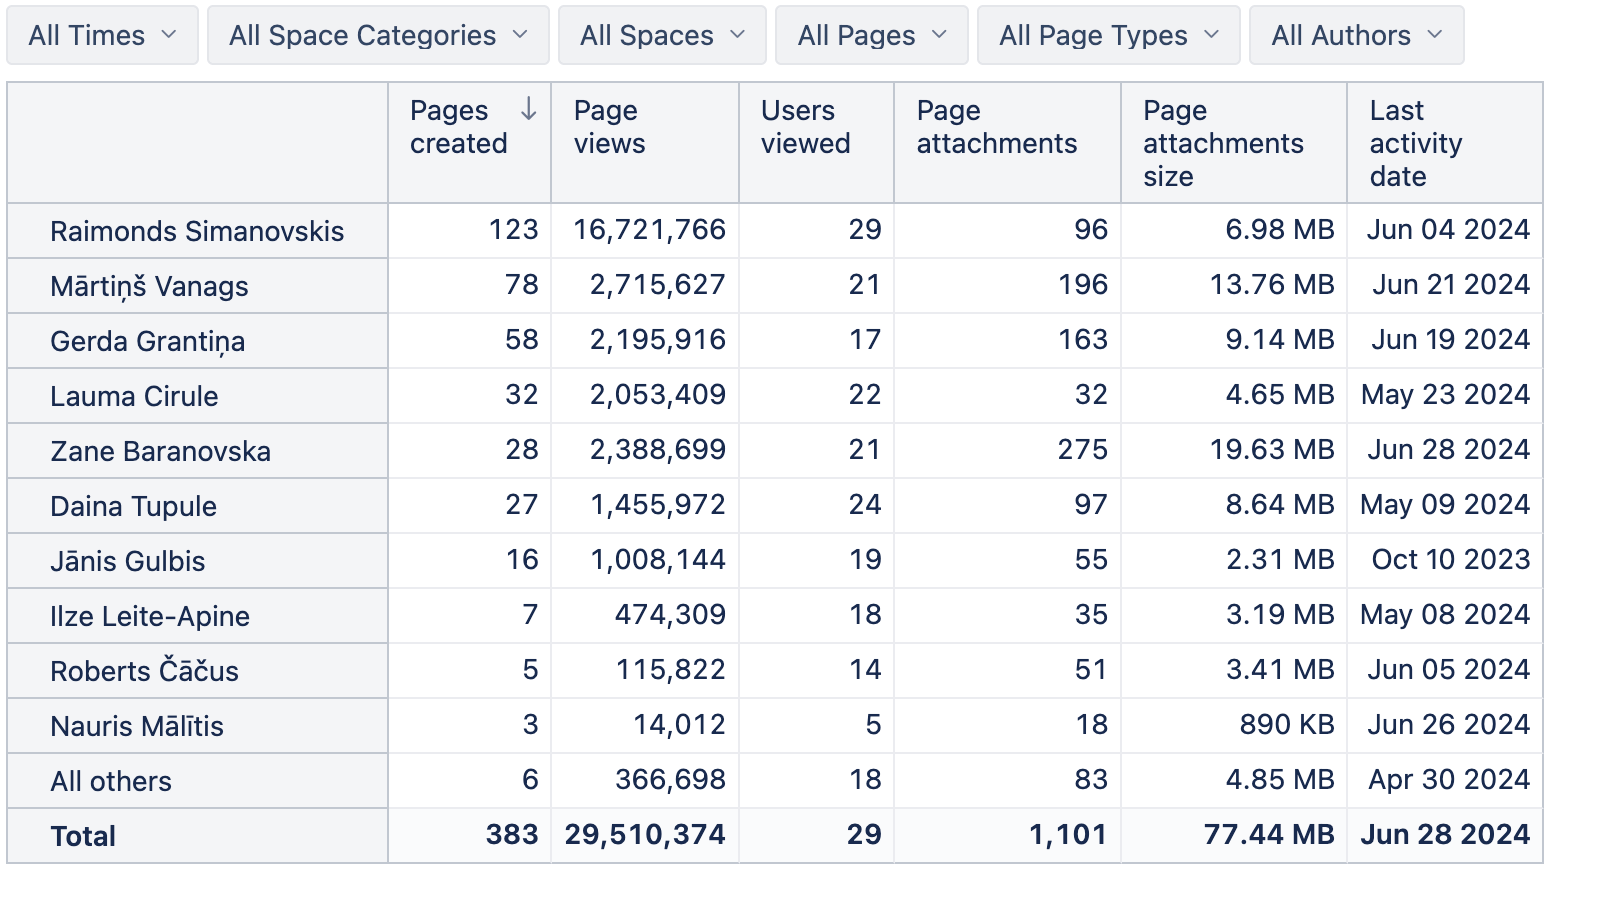
User Reports

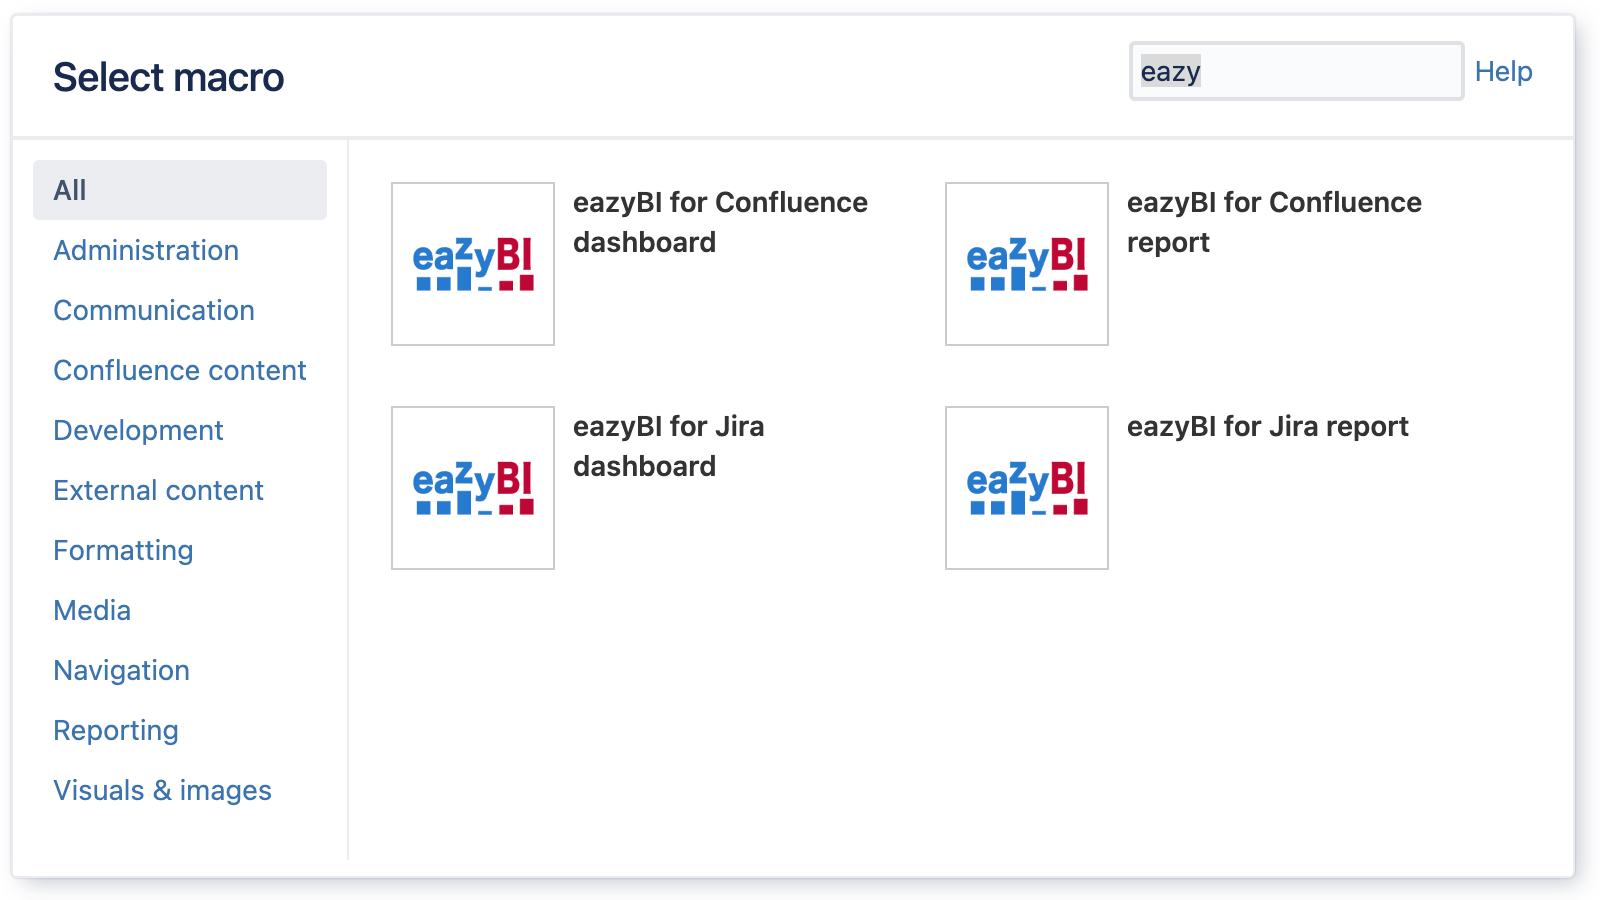
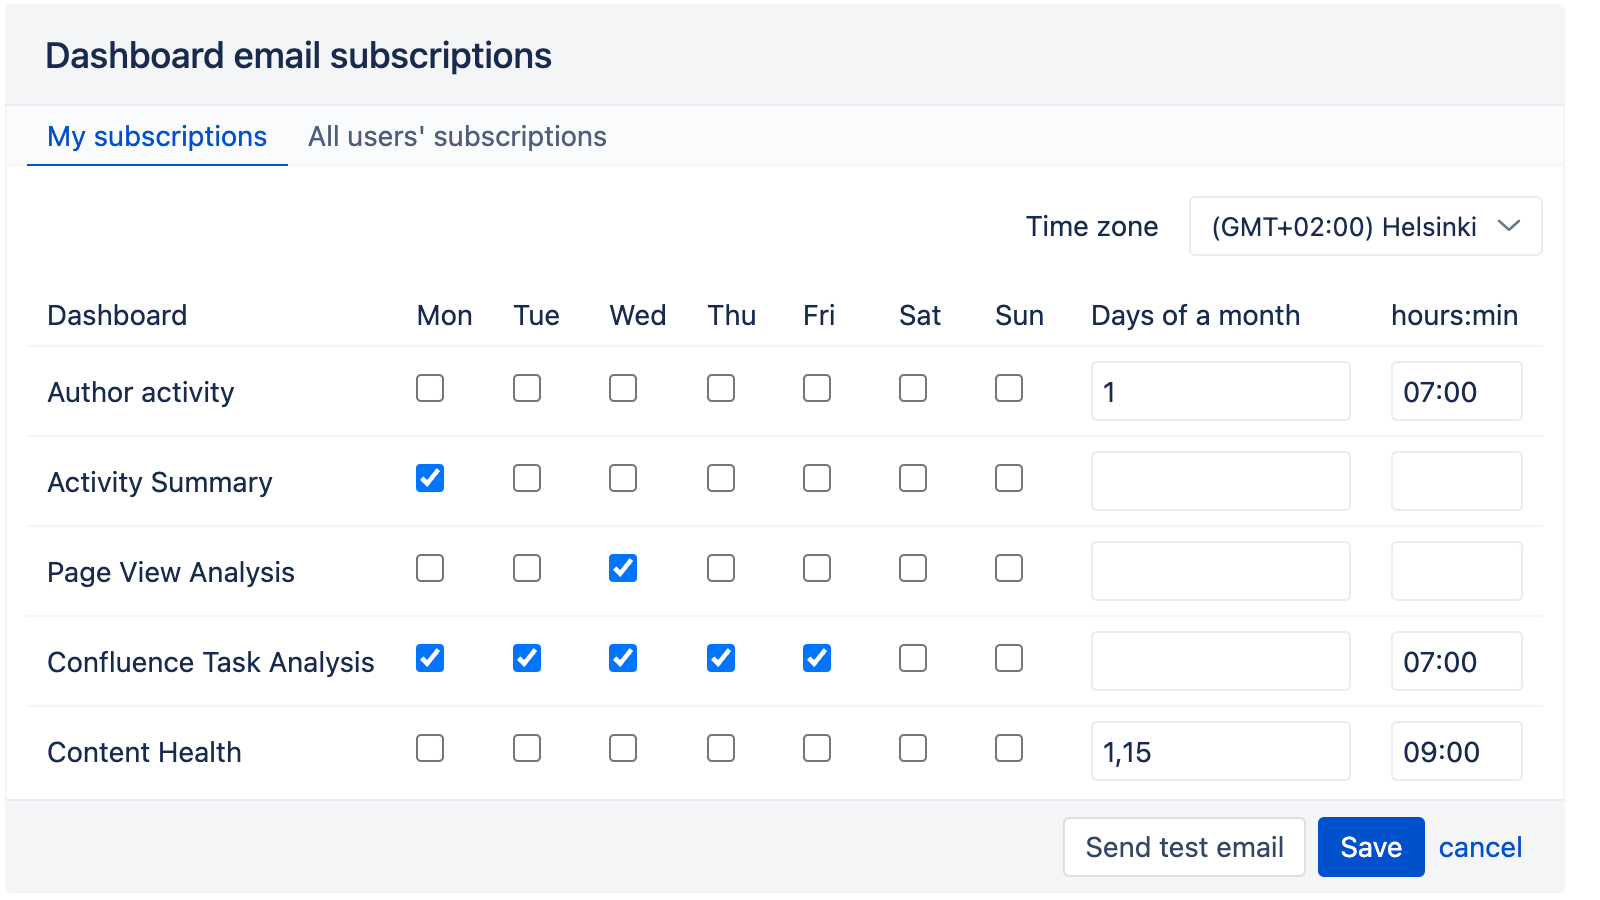
Share your Confluence statistics and insights with email subscriptions, various export options, or by embedding reports and dashboards into your Confluence pages using eazyBI macros.
Confluence Macros
Email Subscriptions
Data Export
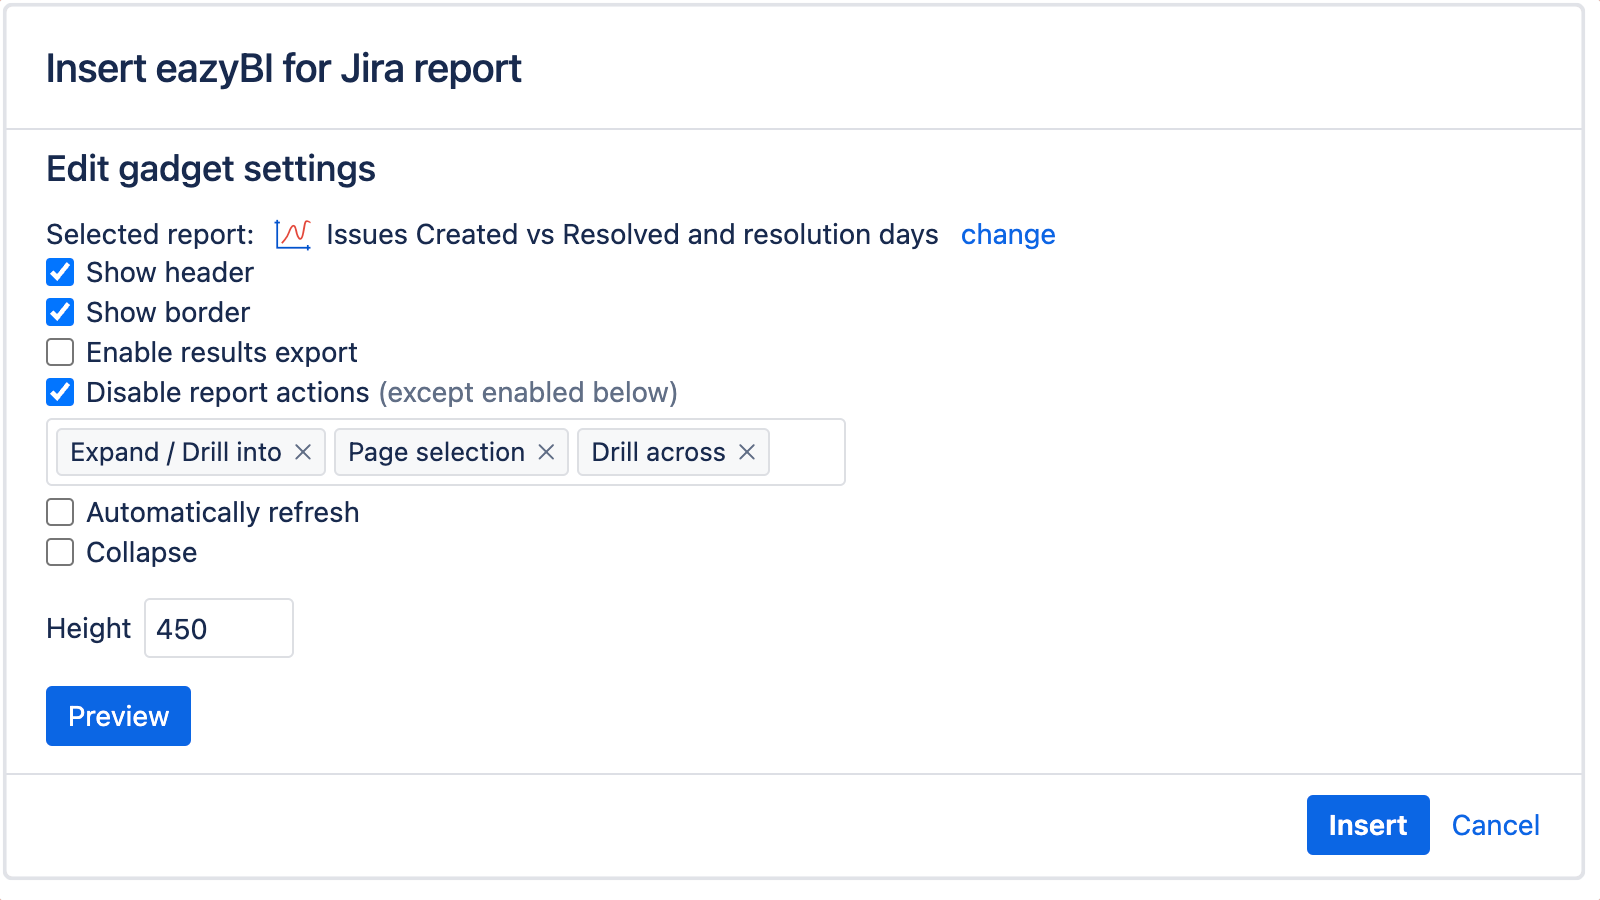
Share Jira Reports
Start a 30-day Free Trial
Try eazyBI free for 30 days to see if it's right for you. If you need any help or support, feel free to reach out to support@eazybi.com—we're there for you.
Demo Dashboards & Template Library
Explore Confluence dashboard and report examples in the demo library, or build your own dashboards from your custom reports - possibilities are endless.
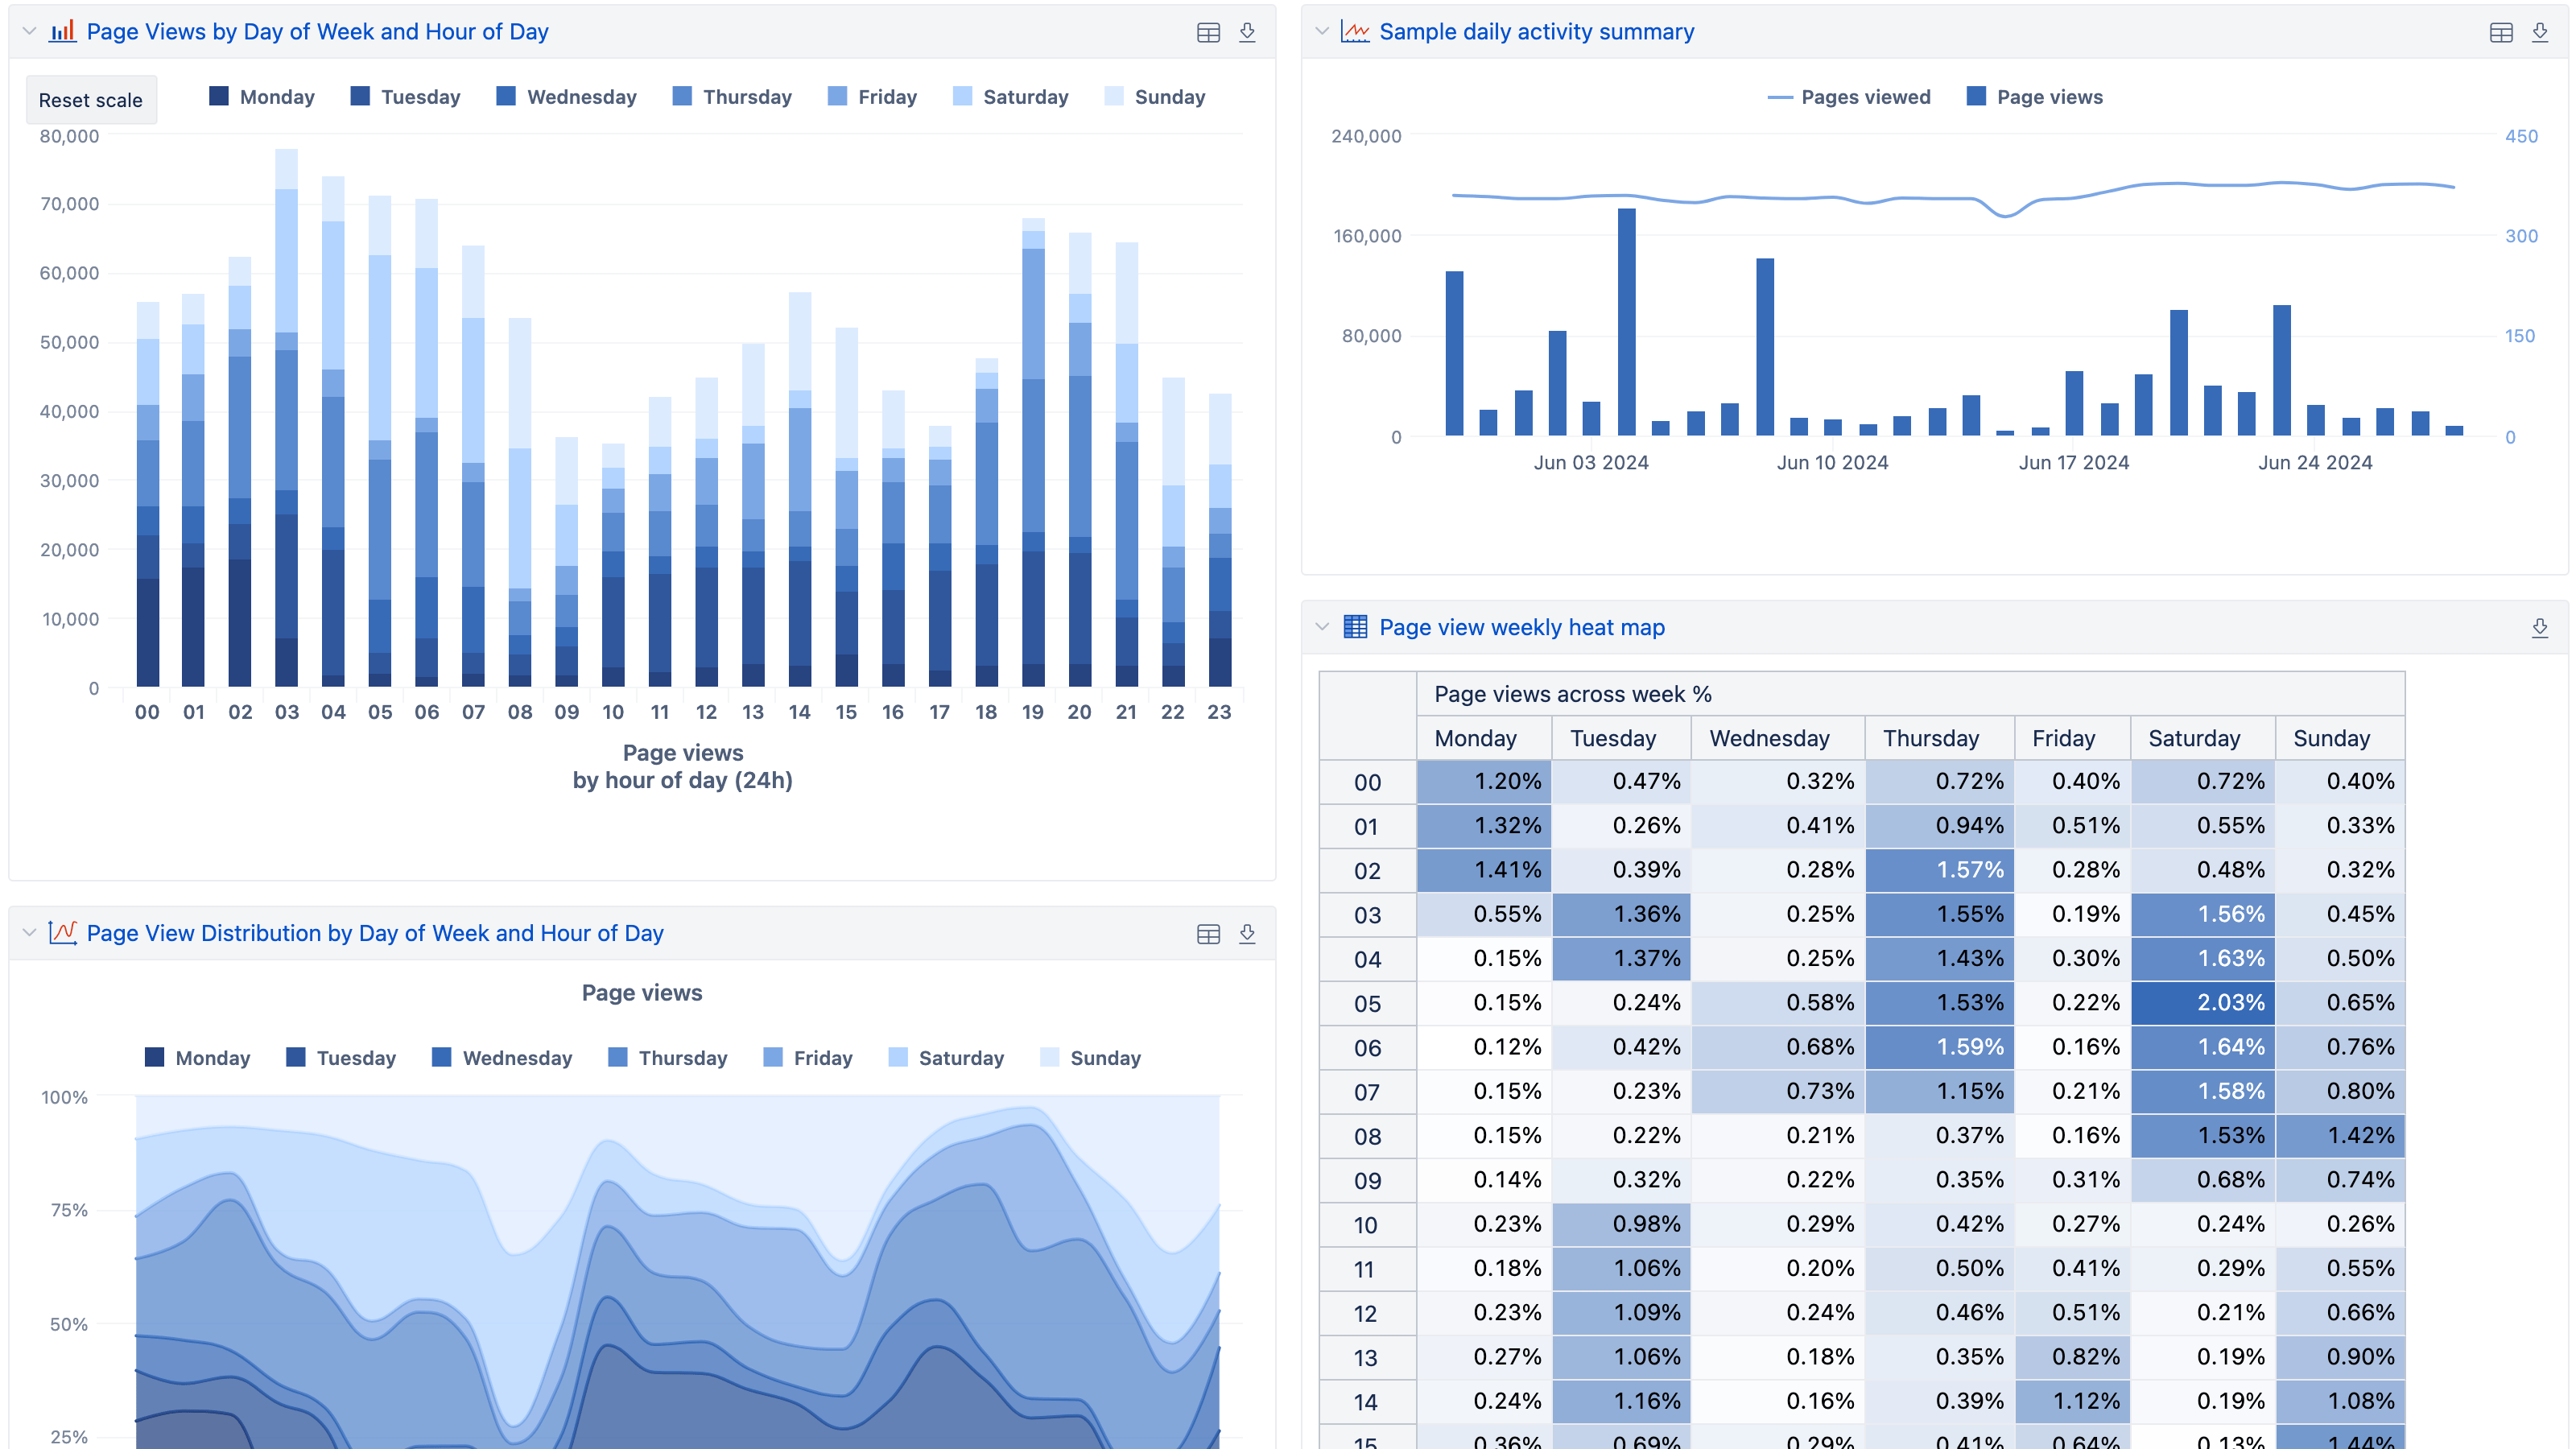
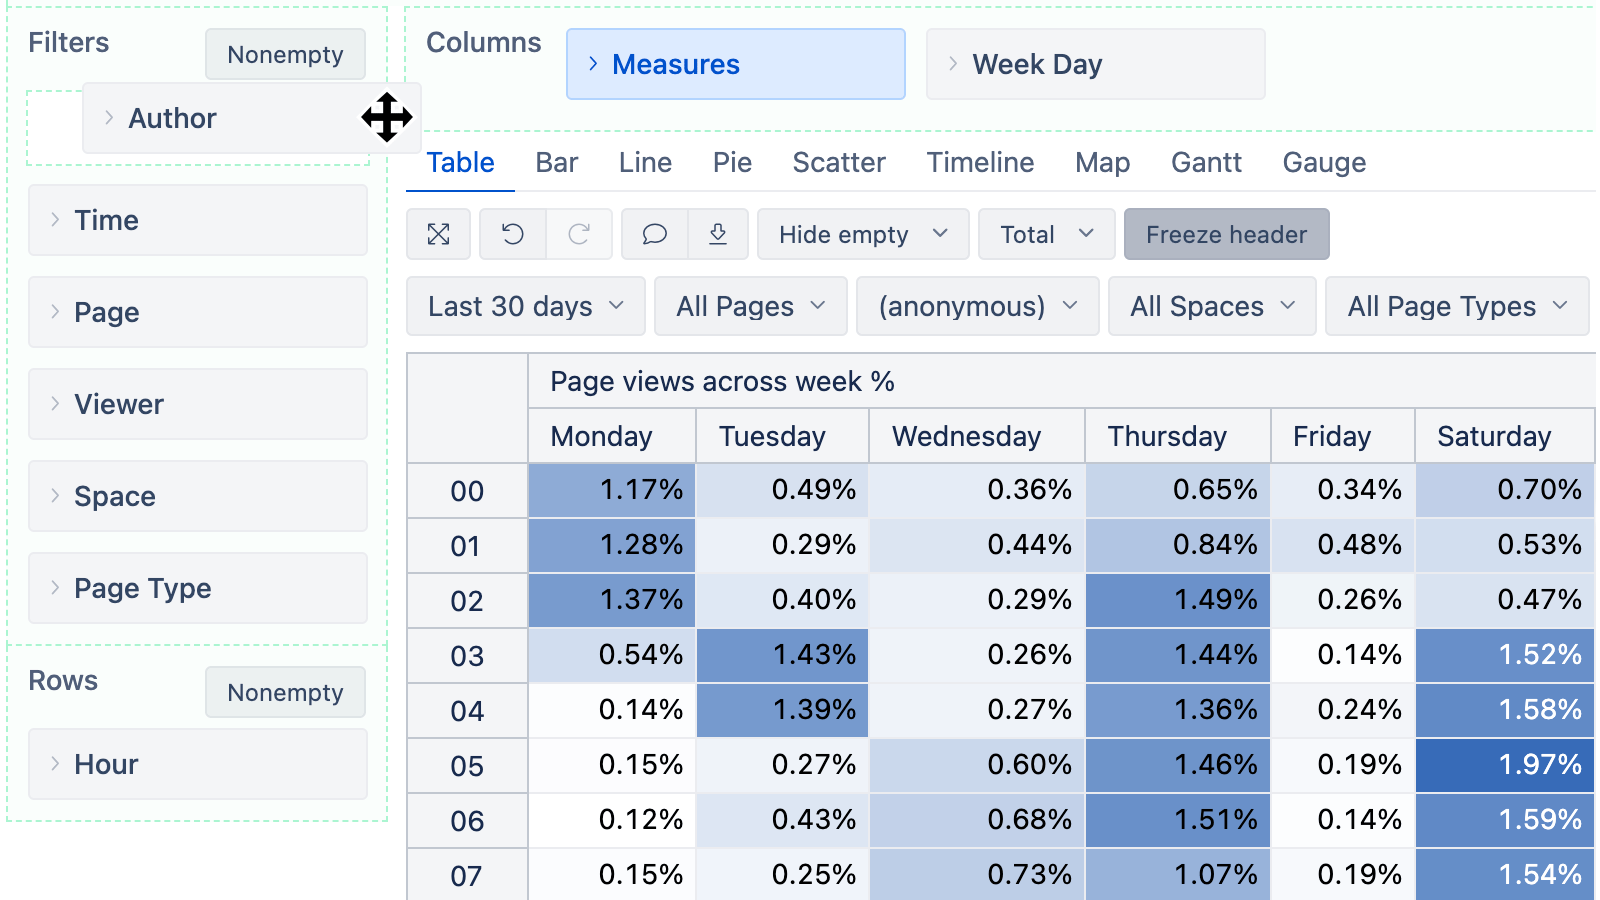
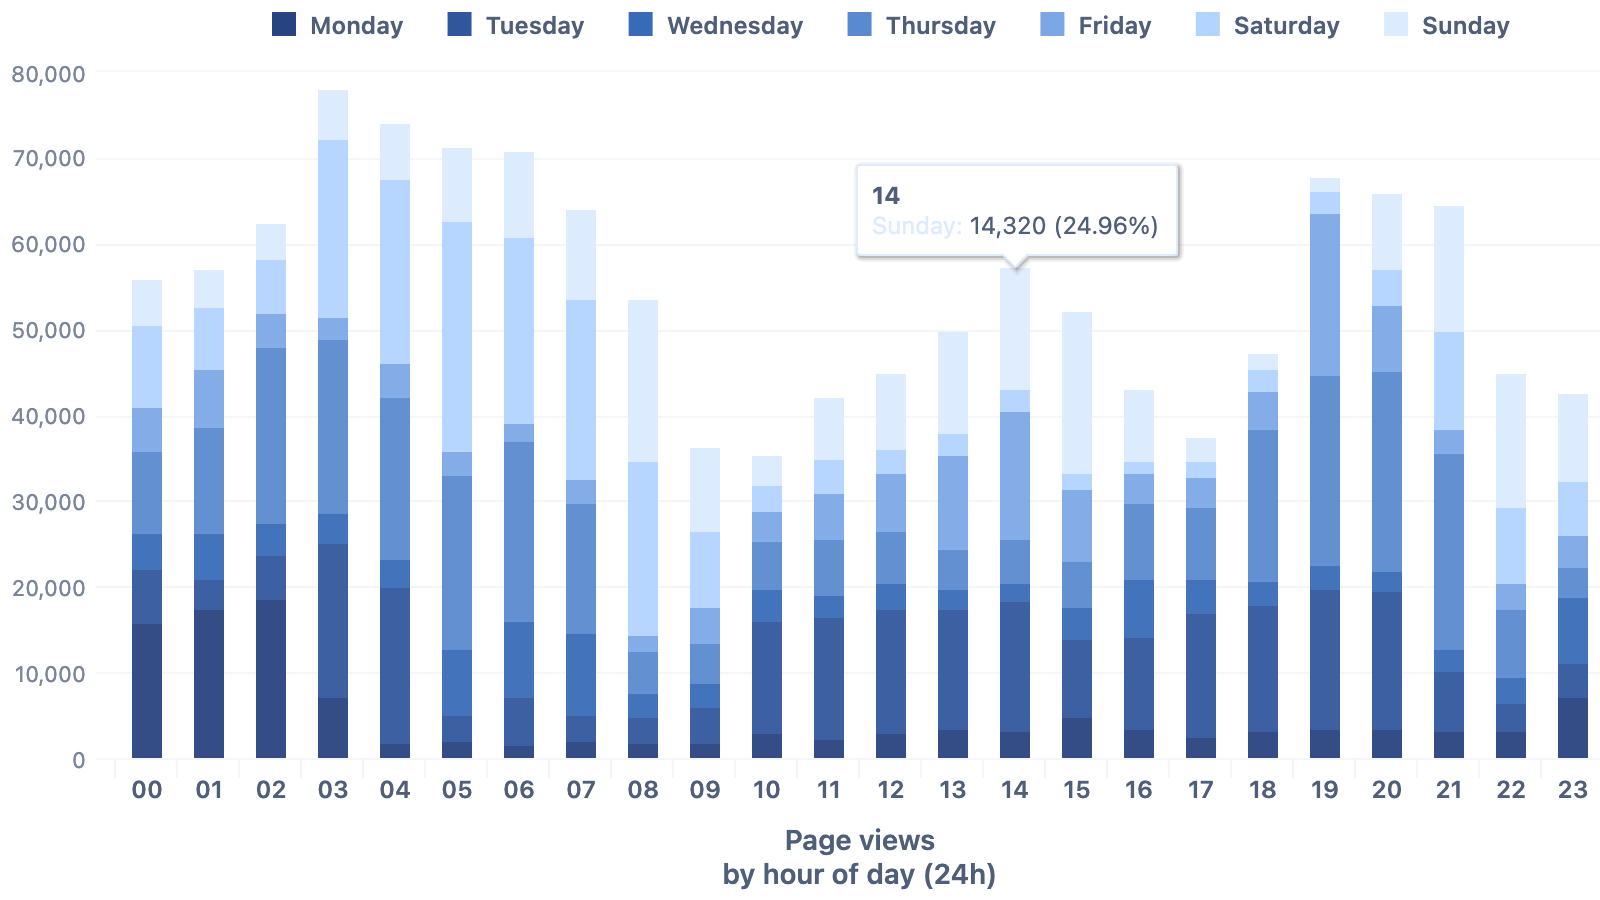
Dashboard provides detailed insights into Confluence page view patterns, highlighting peak activity times and identifying underperforming content.
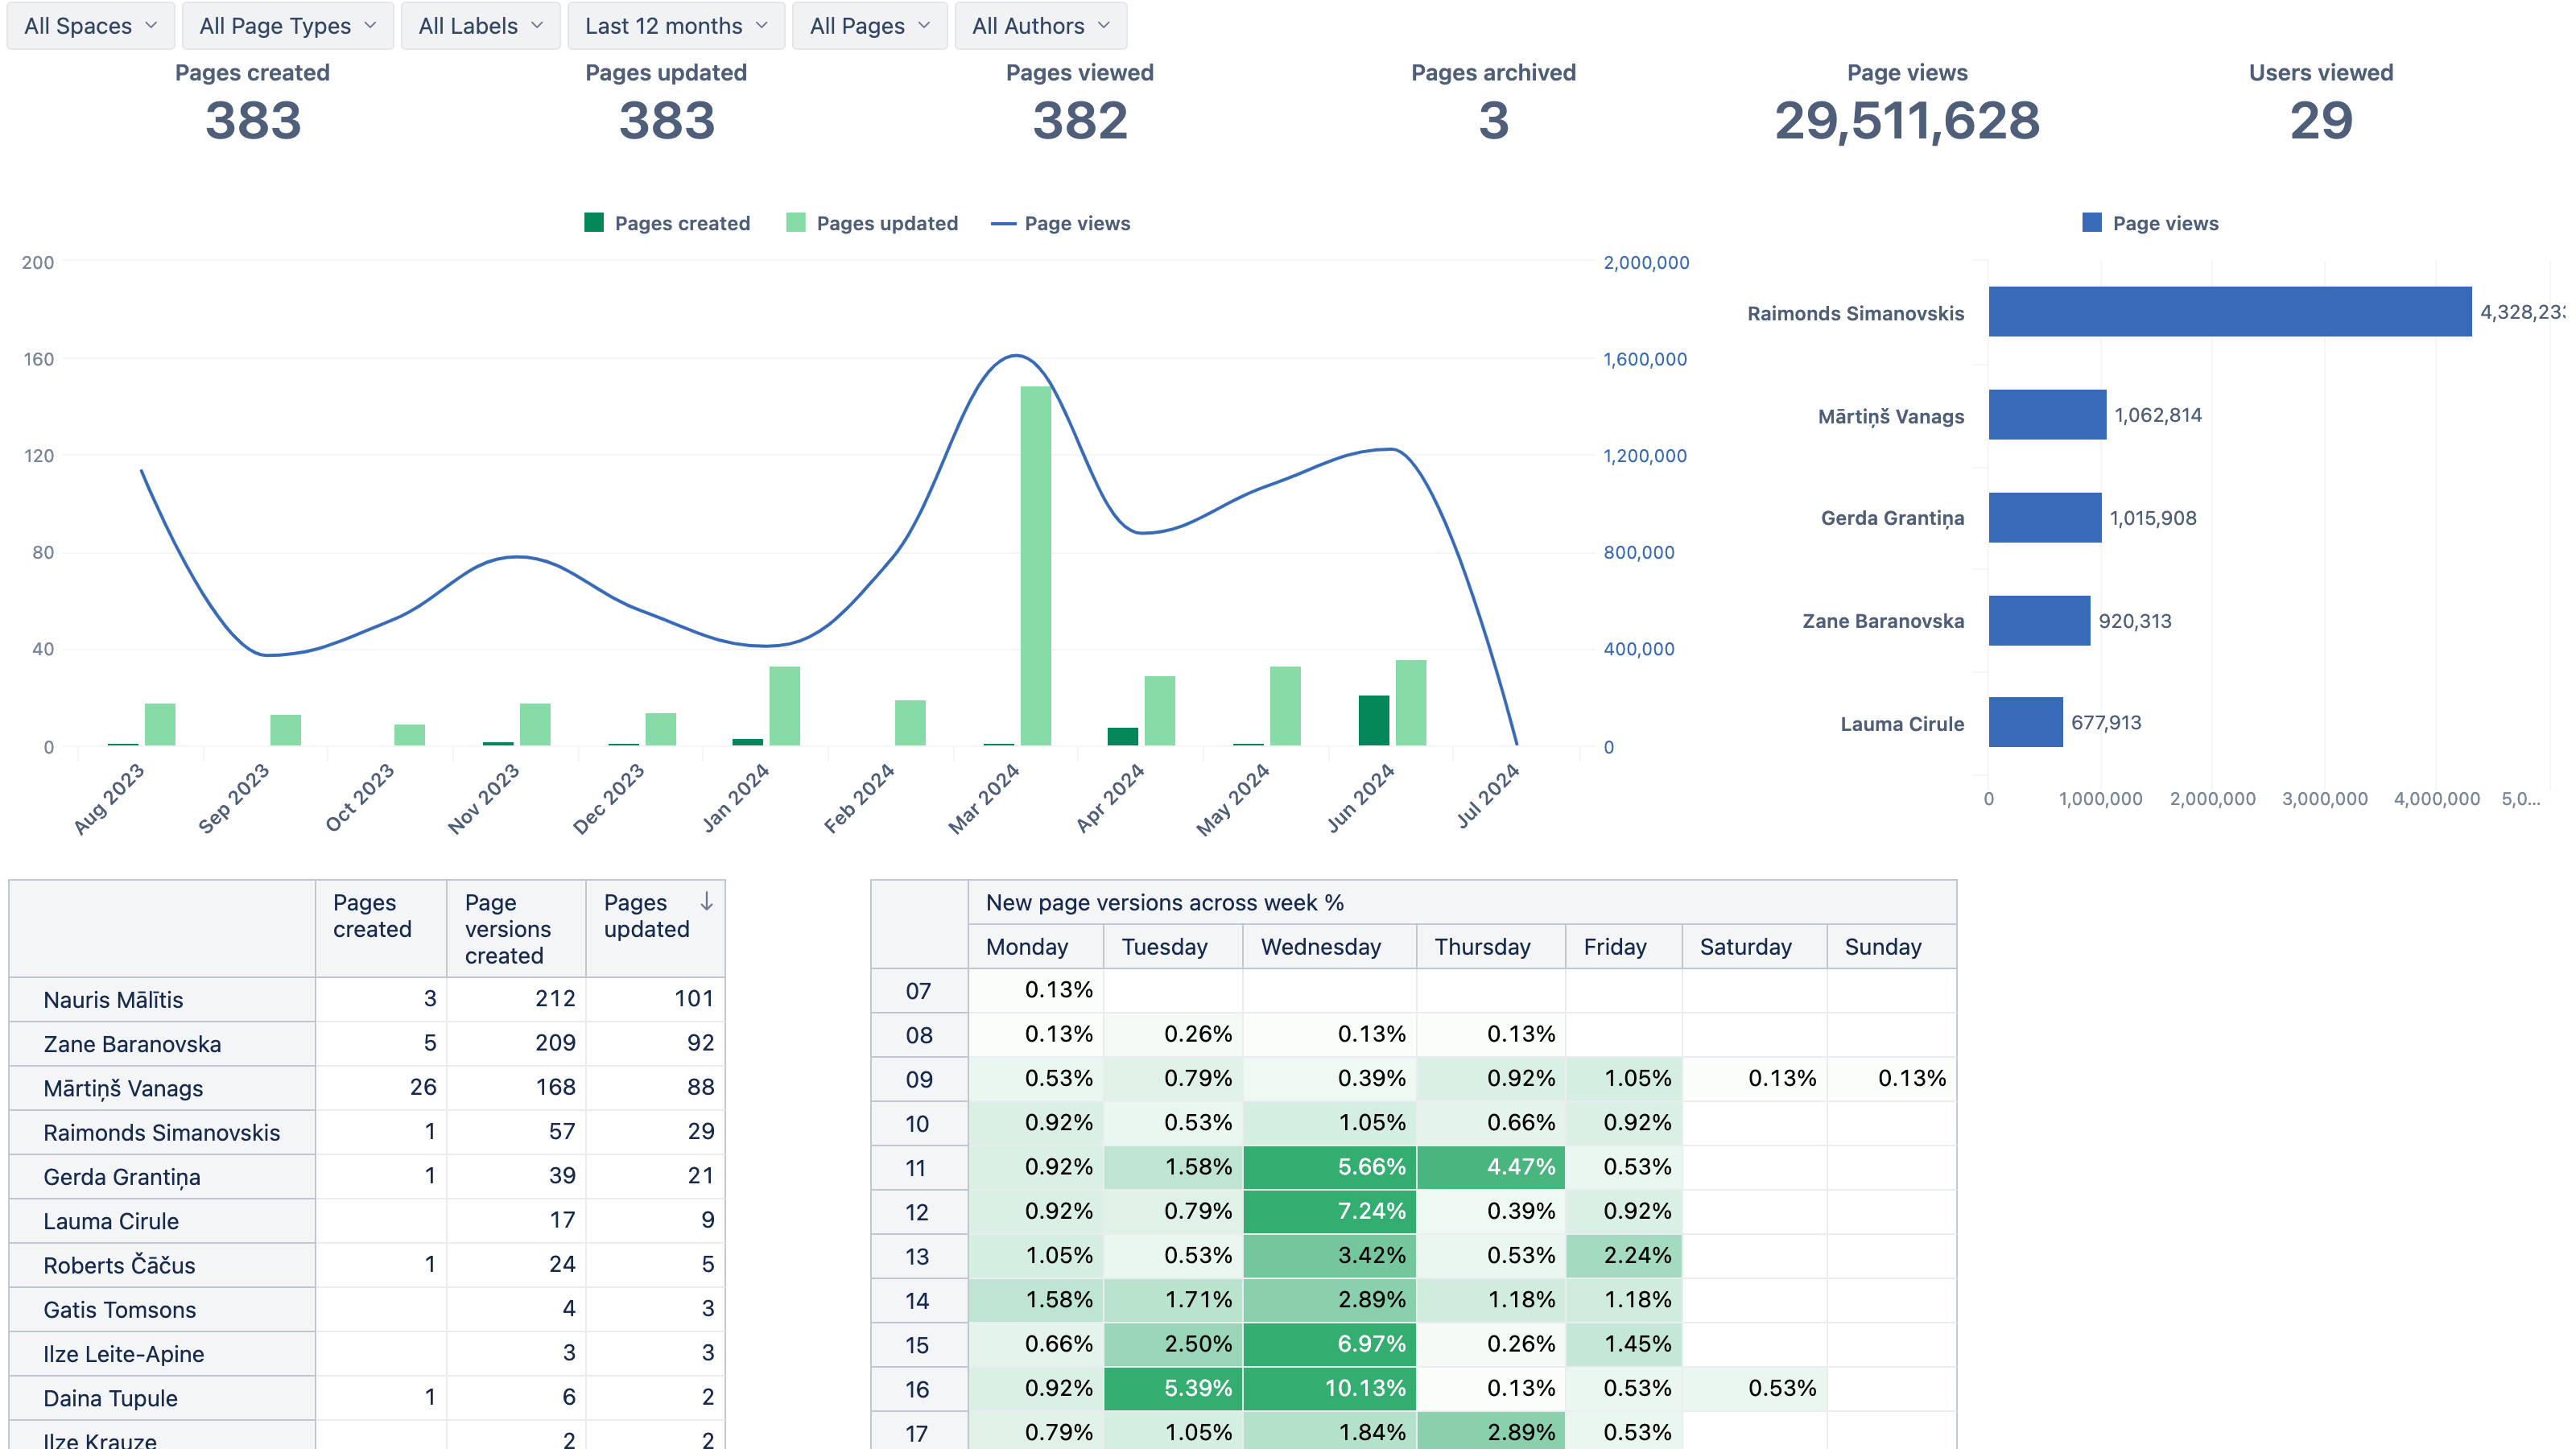
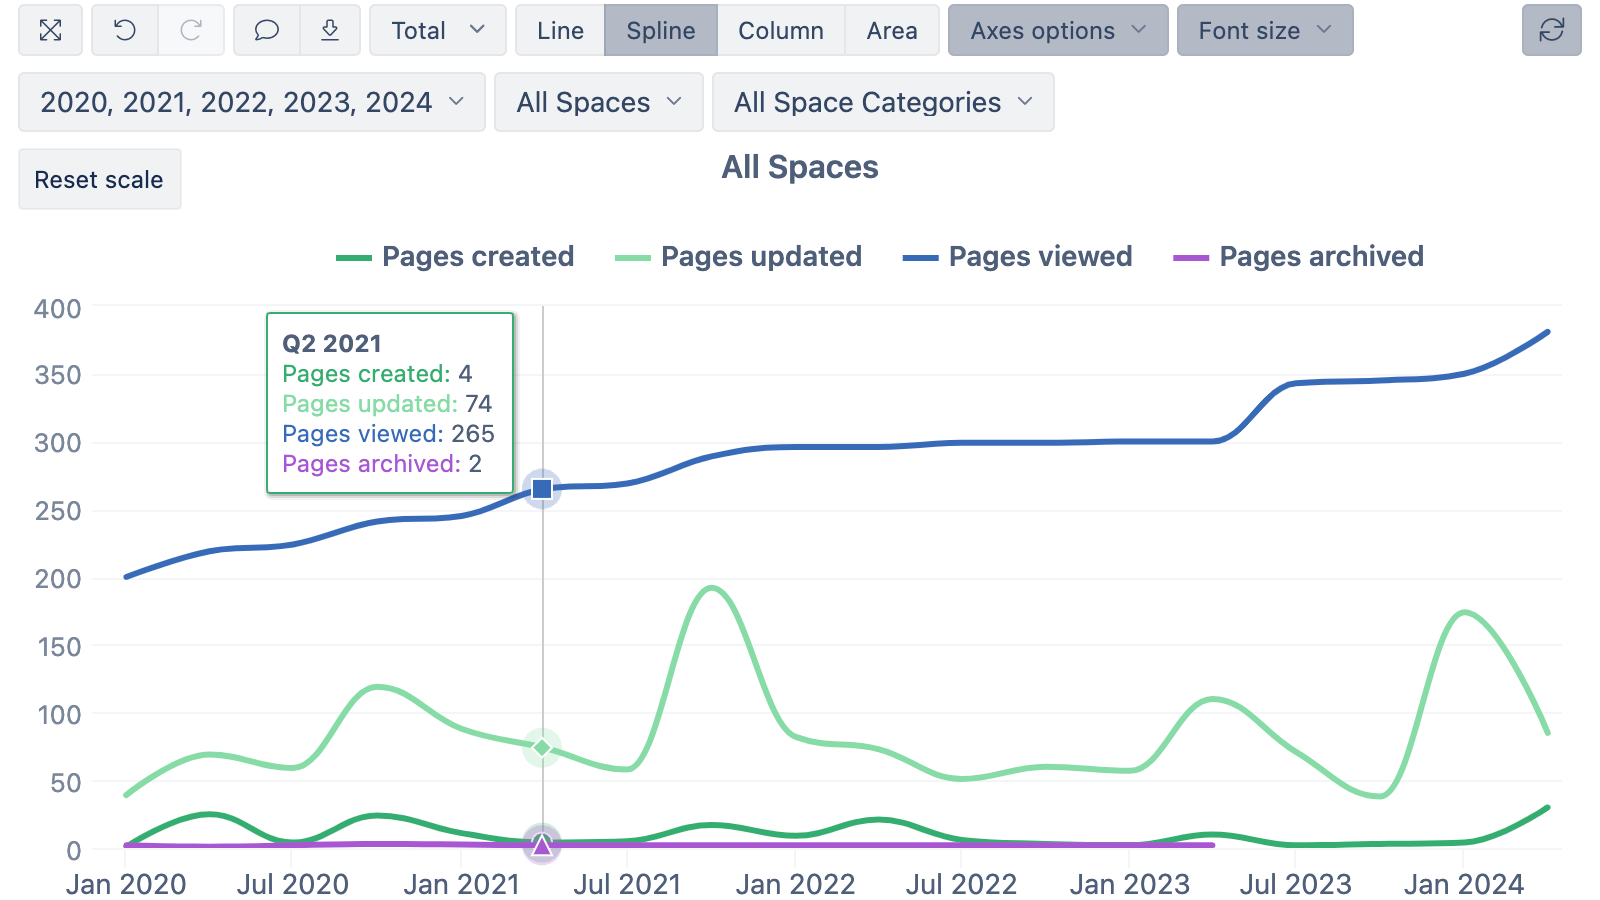
Dashboard provides an overview of Confluence page activity. From key page metrics over a period, to highlights such as page activity over time, top-performing authors, and new page versions.
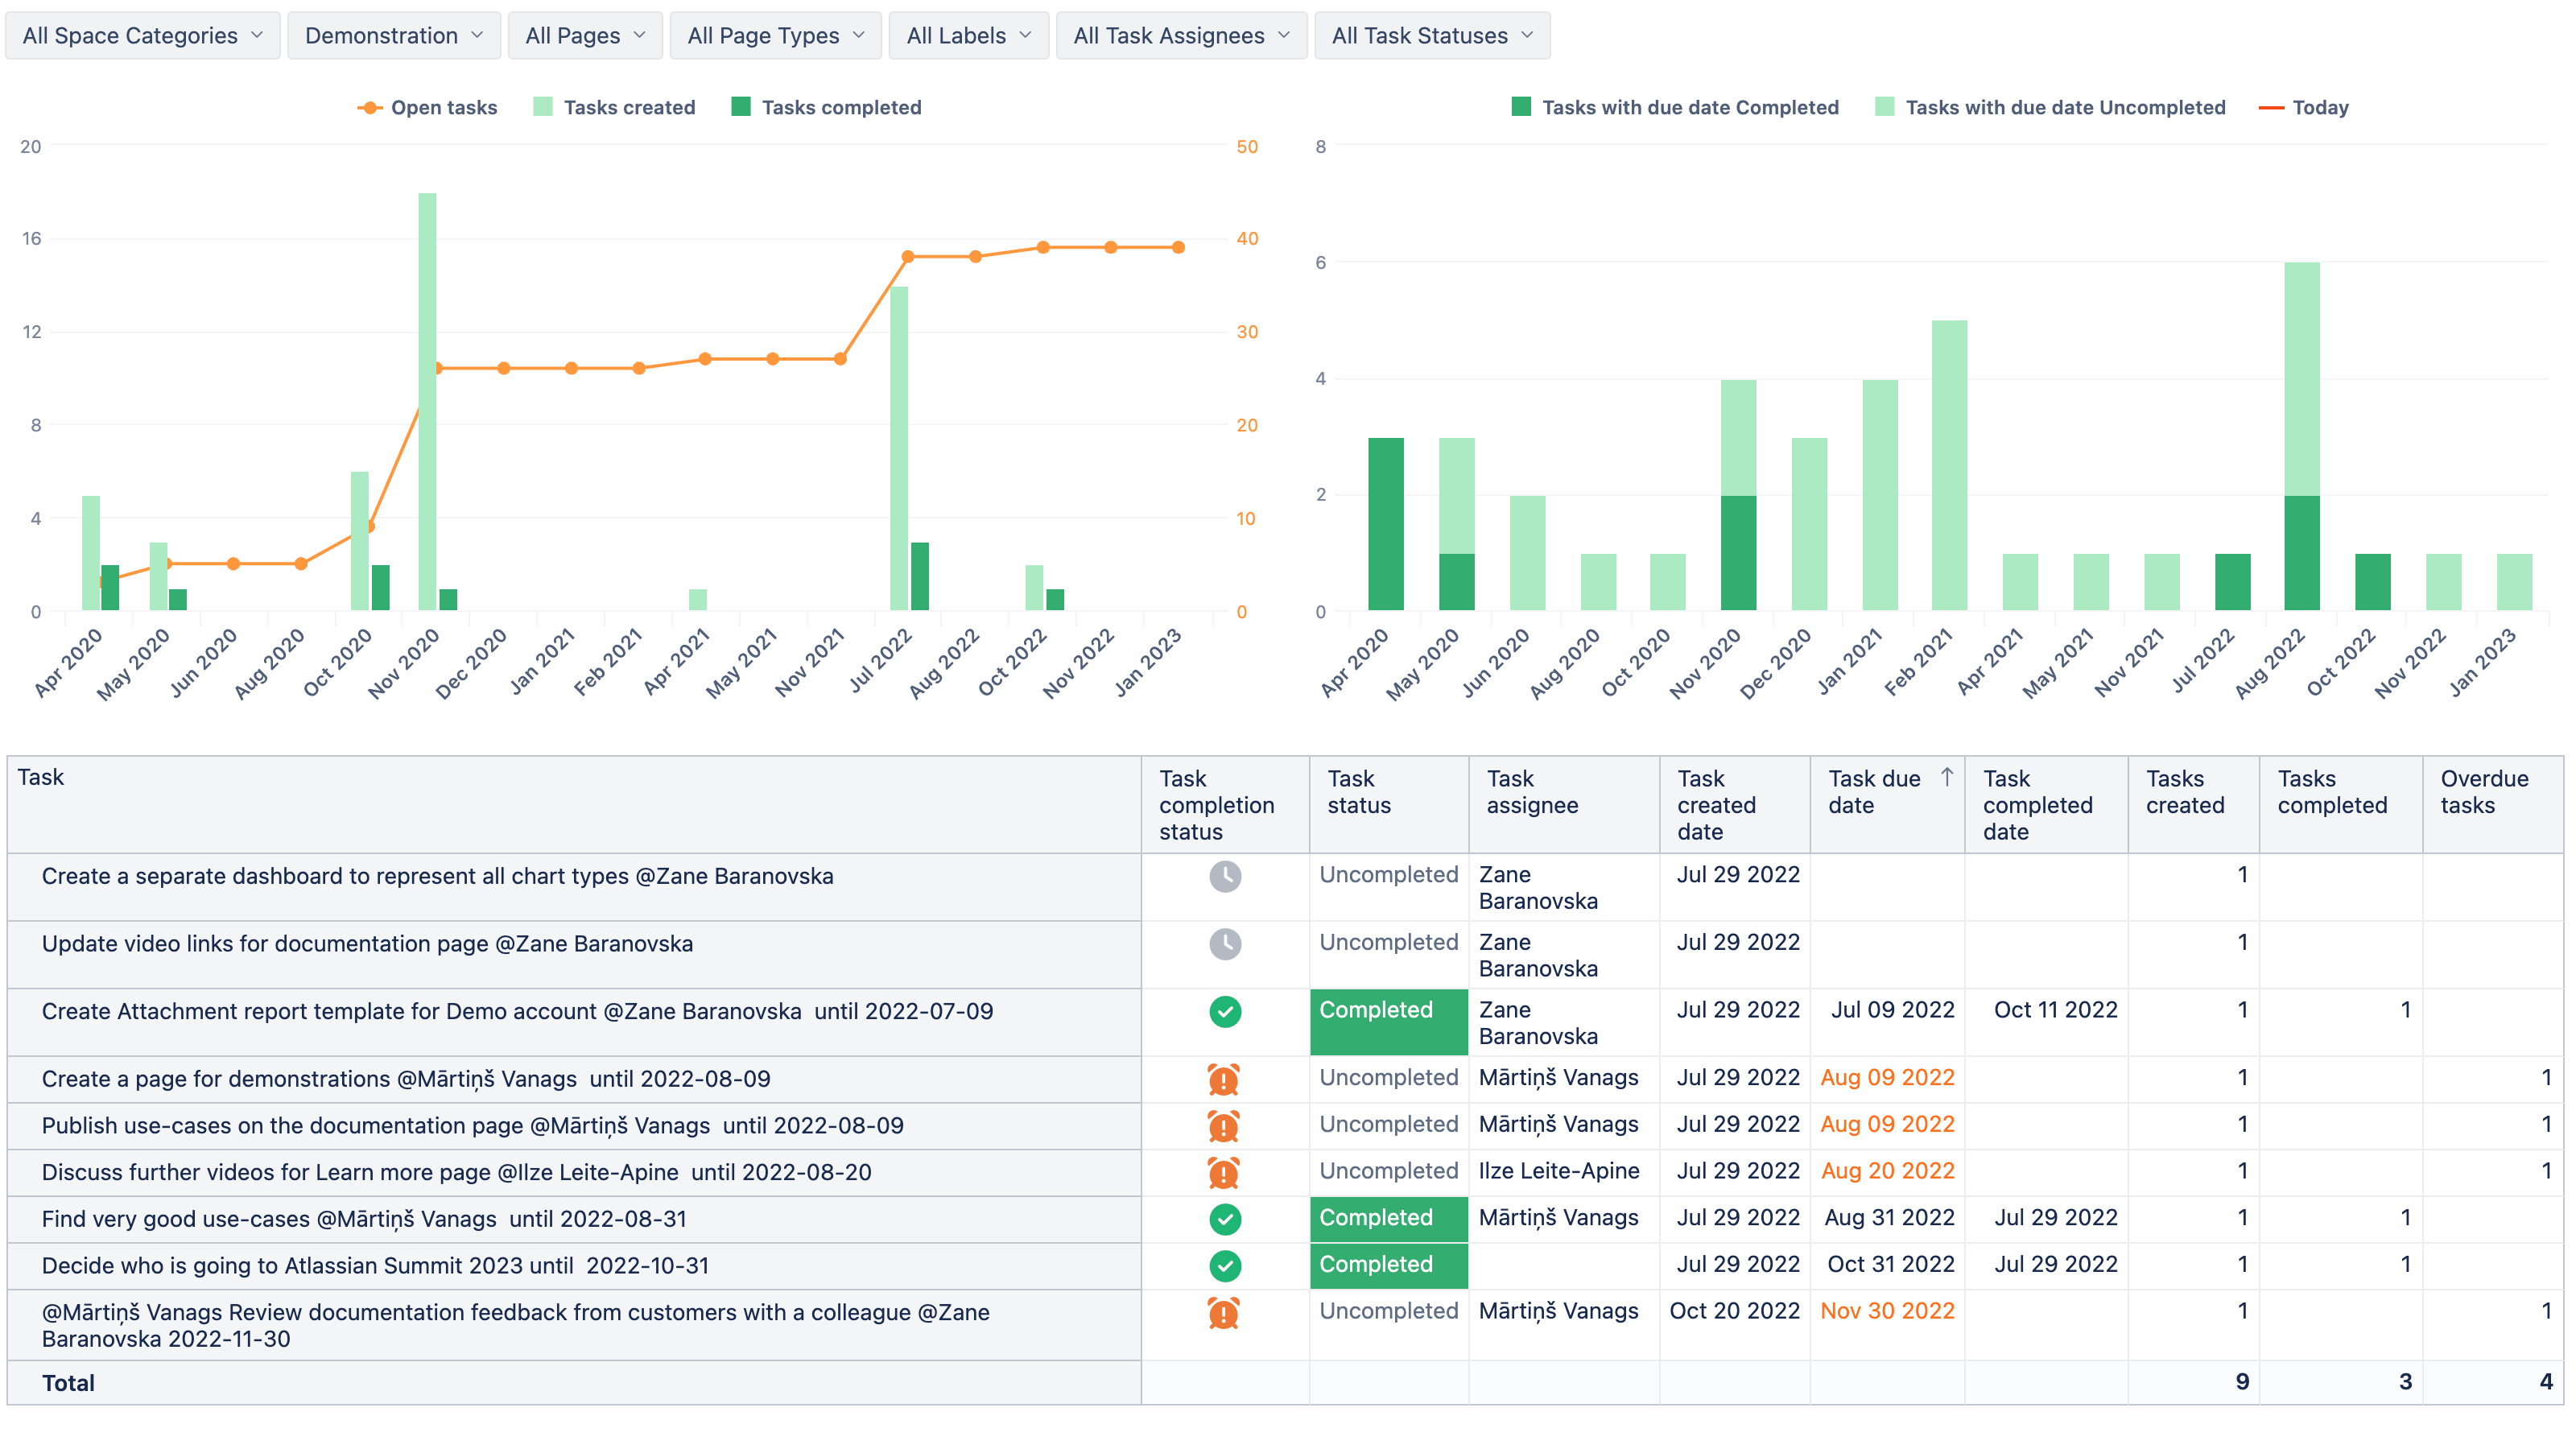
This dashboard offers an overview of tasks created, completed, and open over time, highlights tasks with due dates, and includes a detailed table of all tasks by status, assignee, creation date, and due date.
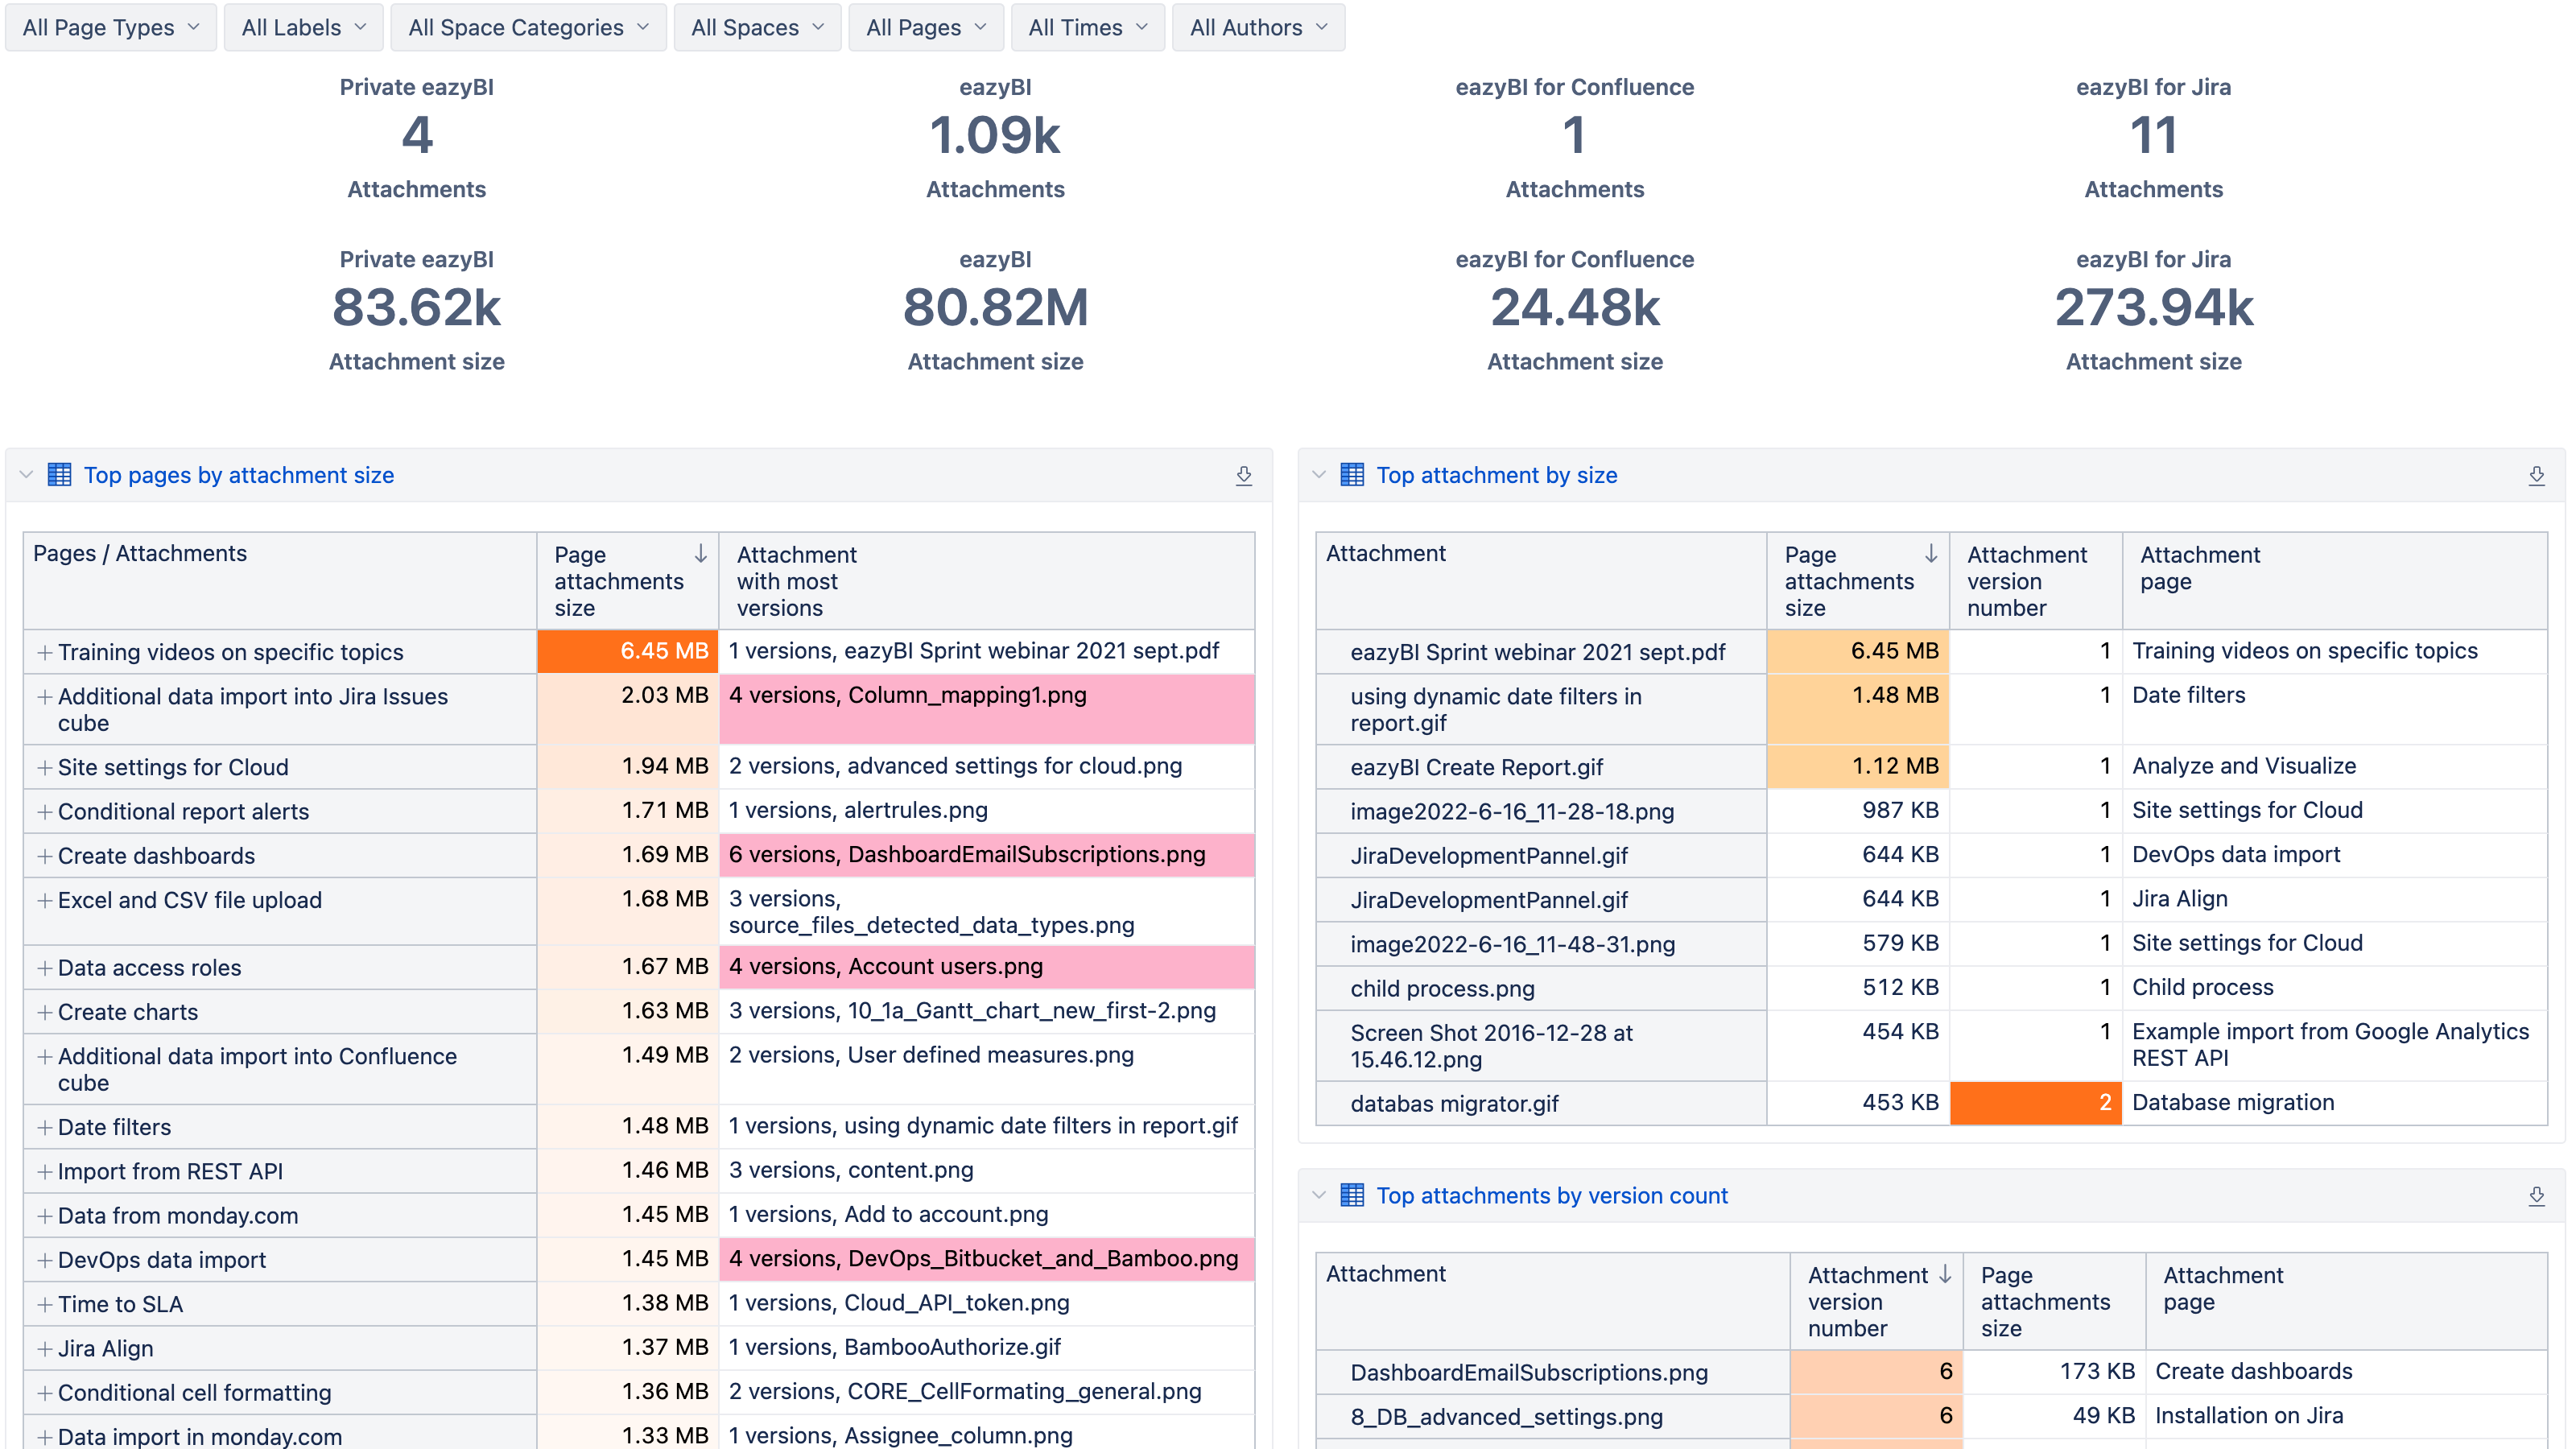
This dashboard provides an overview of Confluence attachments, detailing total attachment count and size by space, top attachments by size, top pages by total attachment size, and attachments with the most versions.
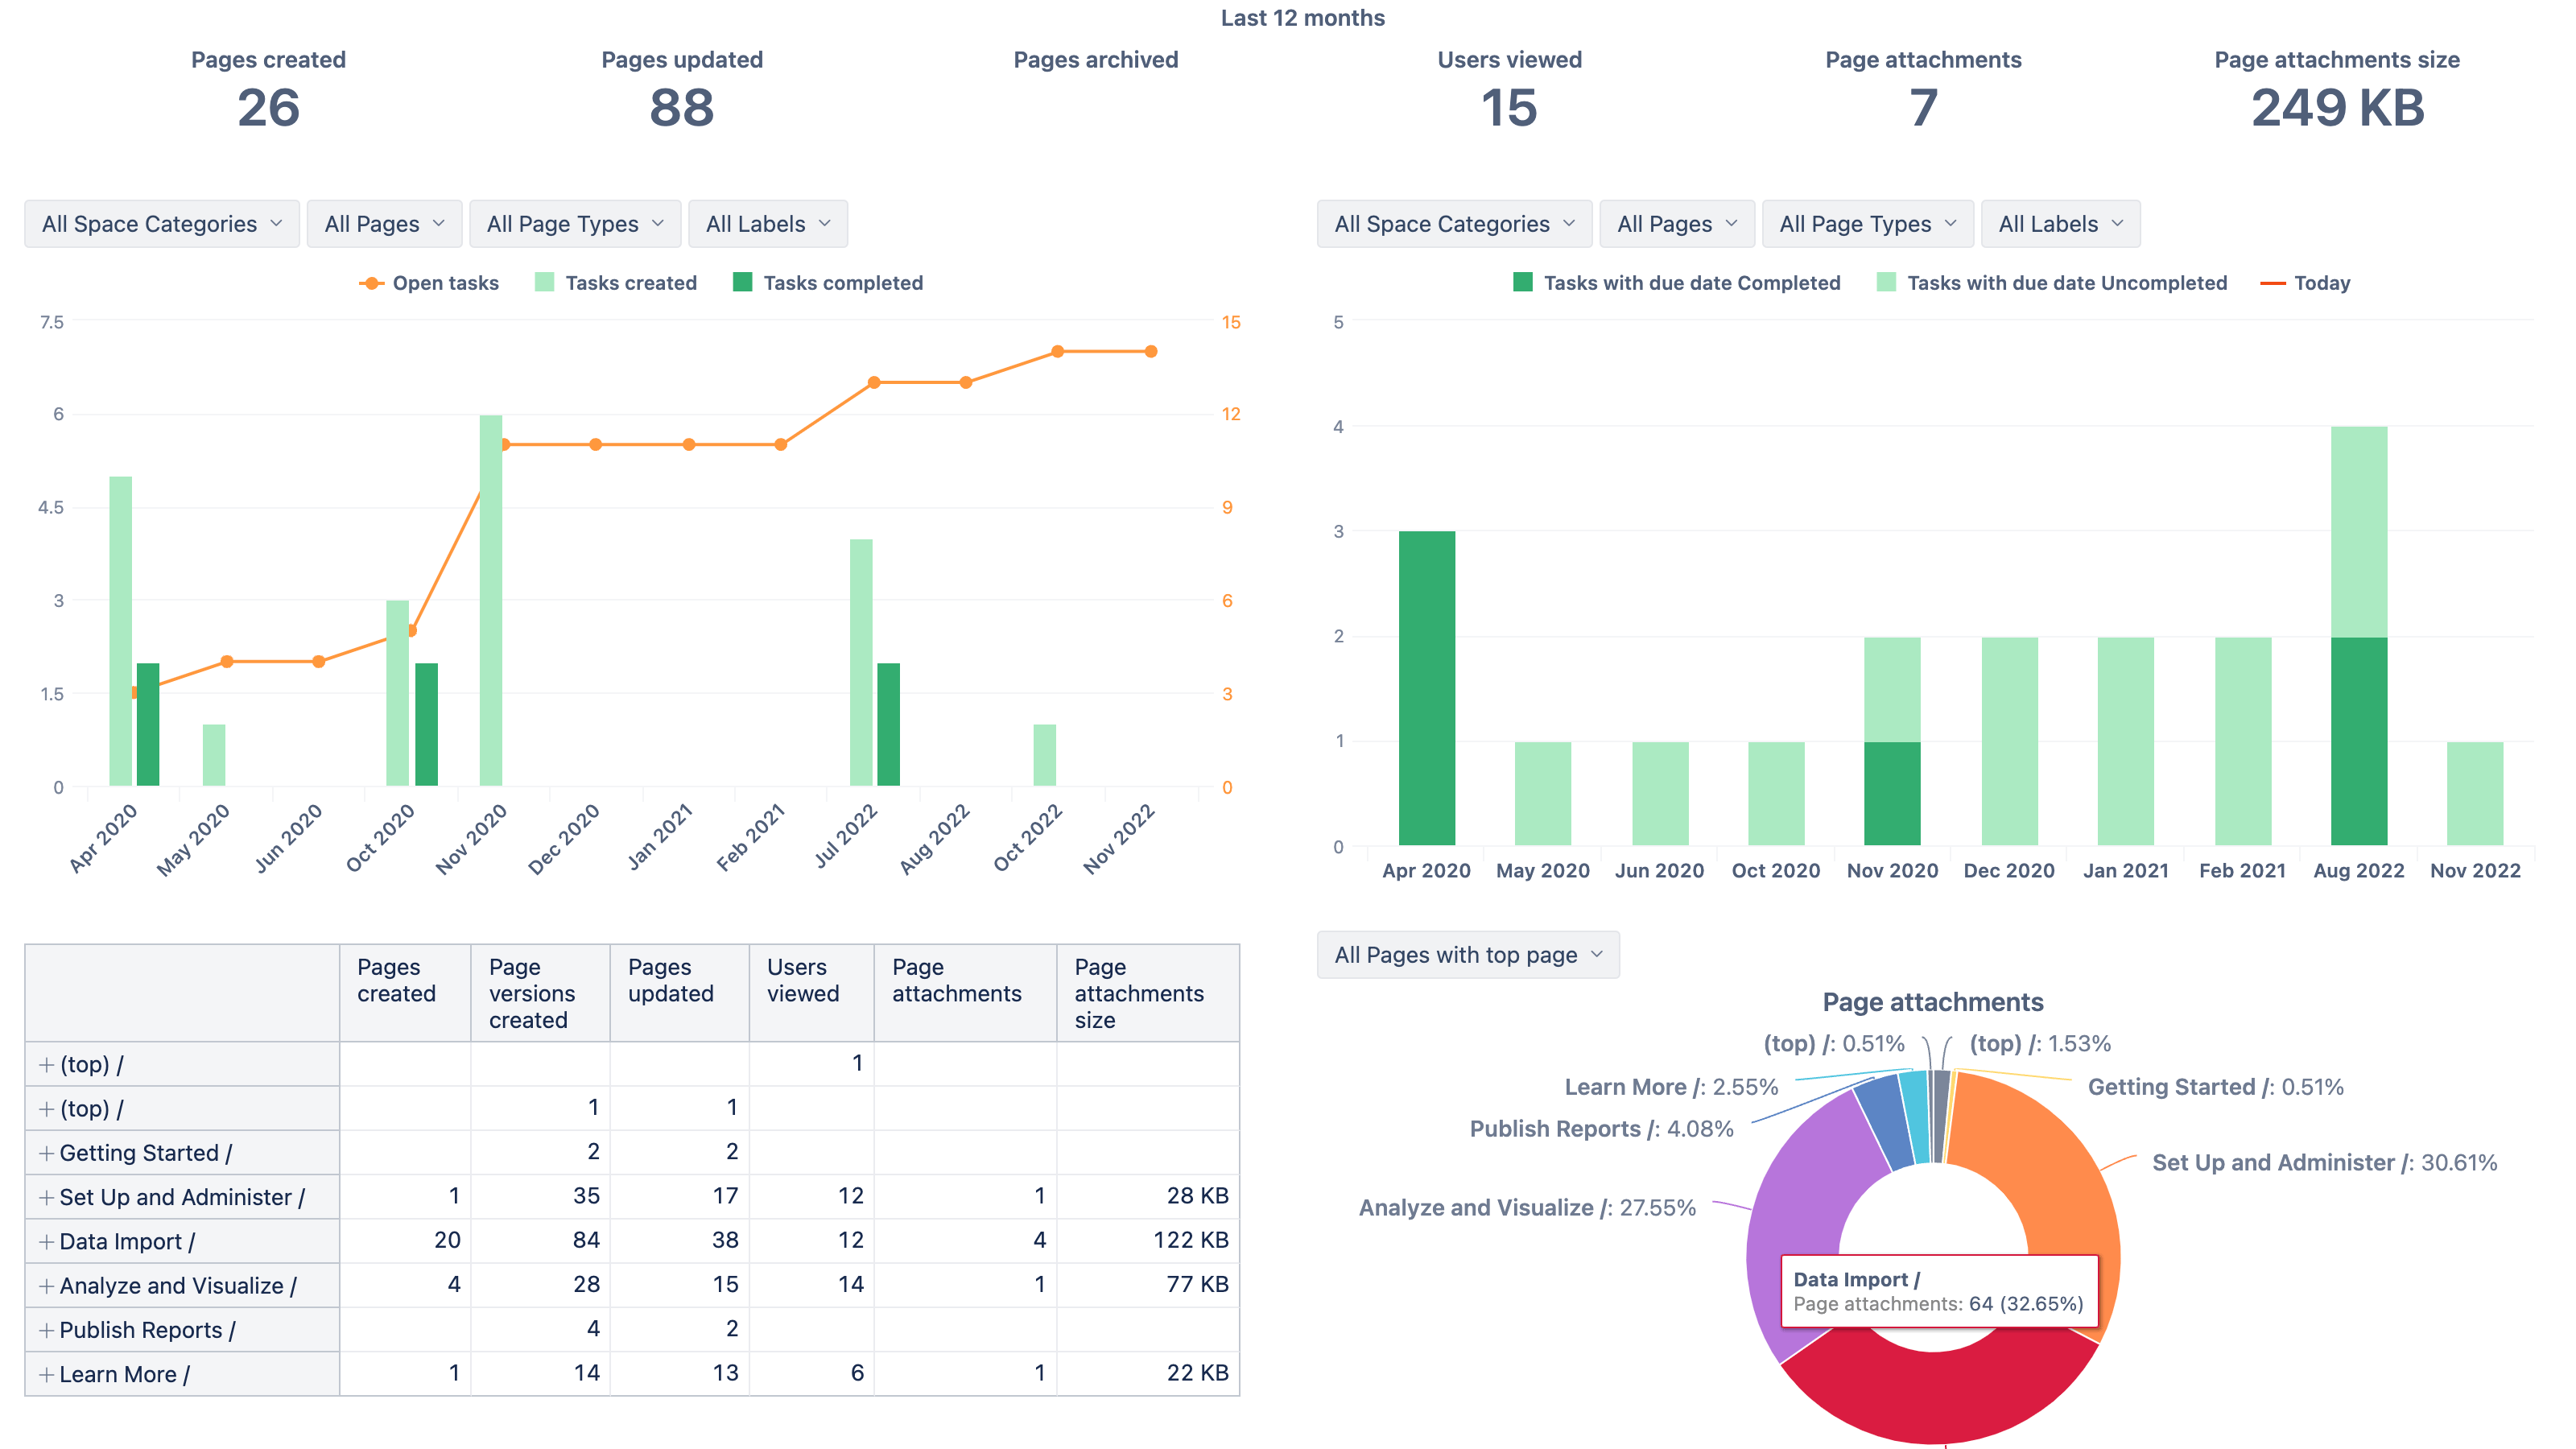
This dashboard provides a comprehensive overview of users activities in Confluence over a chosen time period, including pages created, updated, and archived, user views, created attachments, task completion status, and detailed status of tasks containing page, creation, due dates, and more.
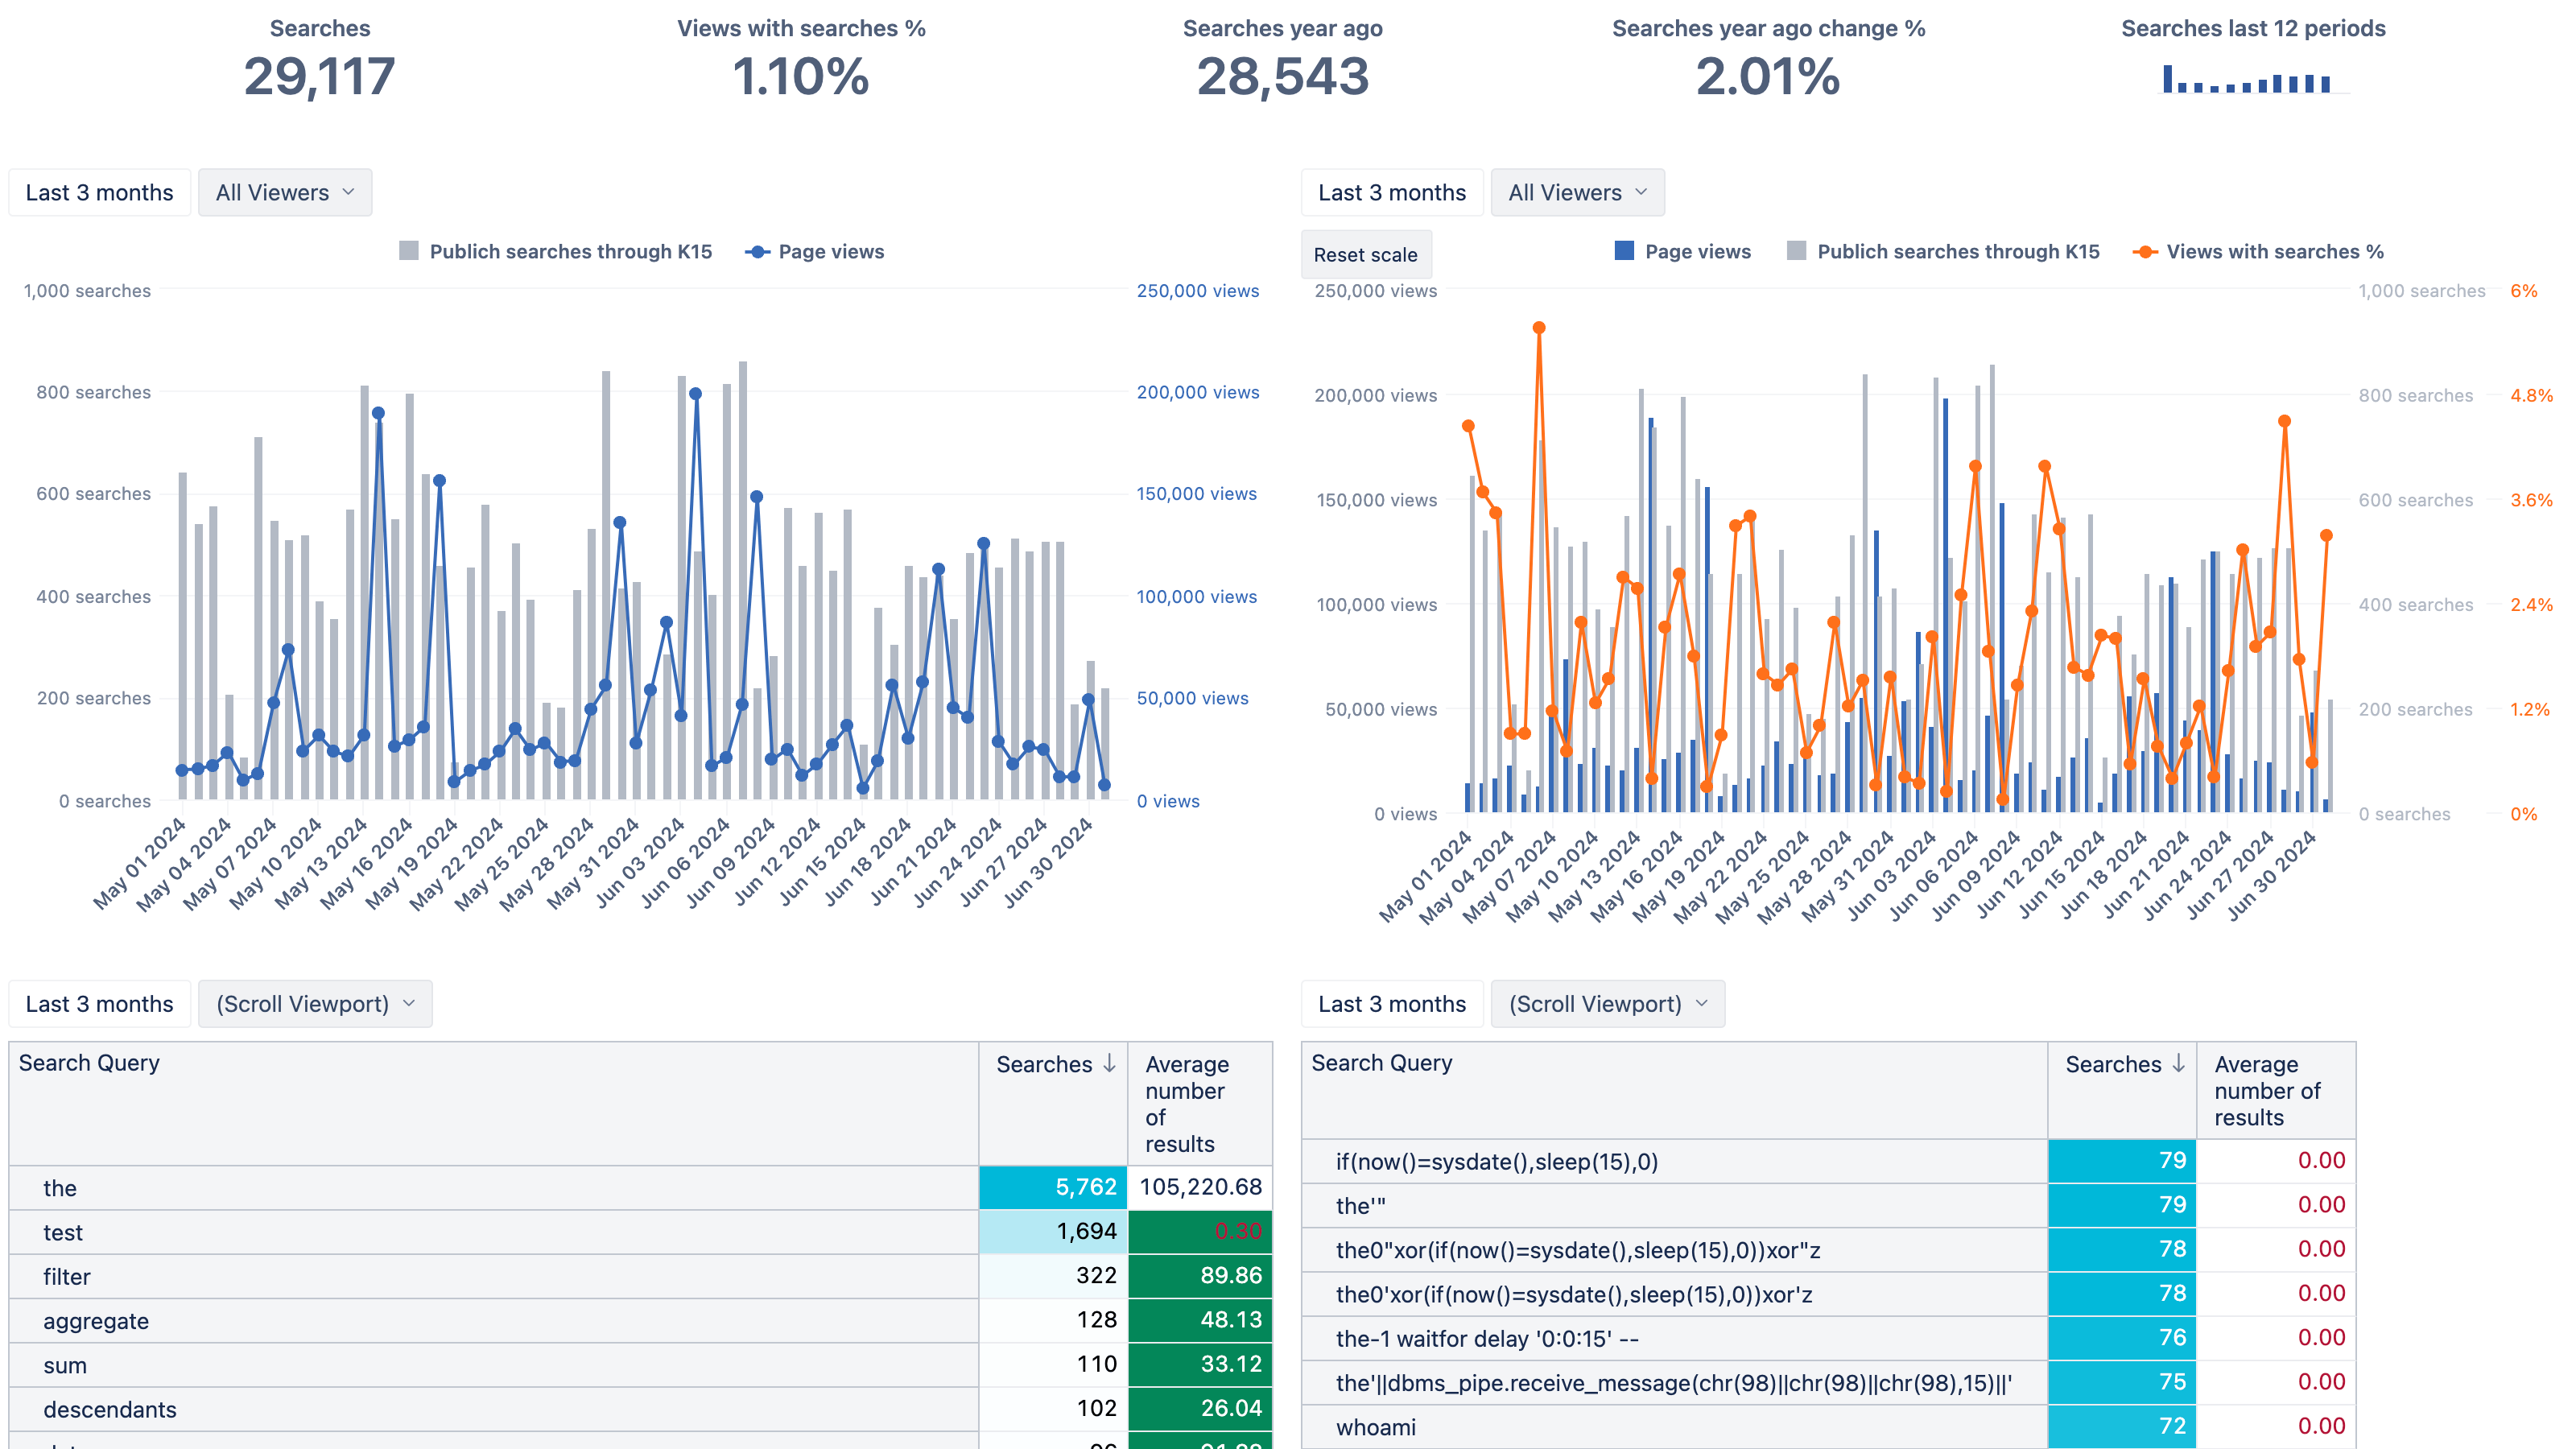
This dashboard provides an overview of Confluence search queries, including total searches, changes over time, search query performance, and detailed metrics such as the number of searches, average results, and most frequent queries.
Enterprise Ready
As an Atlassian Platinum Vendor Partner, eazyBI provides a secure, powerful, and scalable BI solution that grows with your data and reporting needs.

Security & Compliance
- SOC 2 Type II
- Cloud Fortified
- Bug bounty
- Data Residency in the EU and US

Scalability & Performance
- Supports large data sets
- Incremental import
- Dedicated nodes for Data Center
- Low impact on Confluence performance

Management
- Granular permission management
- Usage Statistics
- Template Accounts
- Audit log of changes
Support & Resources
eazyBI’s powerful report builder comes with an extensive knowledge base, a vibrant community, and experienced support.


Partner Network
Tap into our global network of expert partners for top-tier consulting, solutions, implementation, and training—delivered in your area and language.


Start a 30-day Free Trial
Try eazyBI free for 30 days to see if it's right for you. If you need any help or support, feel free to reach out to support@eazybi.com—we're there for you.
I can't rate this add-on highly enough, for how much difference it has made to reporting and visibility in our company.
It's easy enough to use that our Exec team use it themselves with little explanation.
It even works with Confluence macros so we have live data within documents!
I am very impressed about its flexibility to build even very complex reports. There are almost endless opportunities to build meaningful reports. Highly recommended!
The flexibility and possibilities are endless, from simple measures to the most complex data manipulations, eazyBI raises the bar. I was able to deliver the most amazing and insightful reports to our teams.
I love that you can drill-into any chart by any dimension in any order. Start with a top-level chart and drill-in to specific month, then who's got them assigned, etc. regardless of whether the chart is in eazyBI, a Jira dashboard, Confluence page, or anywhere else.
12000+ Installs, 5000+ Customers from 150+ Countries
Thousands of customers from all around the world use eazyBI for reporting to make better decisions at all levels of management.


Frequently Asked Questions
How long is the free trial period?
When you sign up, you’re automatically enrolled on a free 30-day trial period.
Once the 30-day trial period expires, you’ll be billed based on the user tier of your Confluence instance.
Which license should I choose when purchasing the app?
For Confluence apps, you must purchase the app license that matches your Confluence user tier. For example, if you have a 50-User Confluence license, your Confluence apps must be at the 50-User level.
Cloud marketplace applications automatically match the tier of the host product within the cloud site and are unable to exceed the host product tier.
To find the exact license price of the eazyBI for the Confluence for your instance, please use the price calculator on this page.
What platforms does eazyBI support?
eazyBI is available on Cloud, and Data Center. While aligned with Atlassian’s cloud-first strategy, we offer the exact same core functionality on both of these platforms.
Are eazyBI reports real-time?
No, eazyBI gathers data via optimized API requests to collect data as quickly as possible with minimal impact on Confluence performance. During the import, the data is transformed into an “analytical OLAP data cube”, a data structure that overcomes the limitations of relational databases and provides a rapid analysis of data.
Updates are automatic, usually once per day. On Confluence Data Center, updates can occur even hourly or every 10 minutes. You can update data manually at any time or schedule imports to run during off-hours.
Any opened report or dashboard will instantly display the latest imported data, everywhere — in eazyBI, in Dashboards, or Confluence pages.
What is the MDX query language used in eazyBI? Do I need to know it?
Just like formulas in Excel, MDX enables much more powerful reporting, offering limitless possibilities for data exploration and insight generation.
While knowing MDX can significantly enhance your reporting capabilities, it is not a requirement for using eazyBI. You can build powerful custom reports without delving into custom MDX calculations.
Whether you choose to use MDX or not, eazyBI provides all the tools necessary for effective data analysis and reporting.
MDX, or MultiDimensional eXpressions, is a universal standard developed by Microsoft for querying analytical data cubes efficiently. In eazyBI, MDX plays a crucial role in enhancing the flexibility and depth of data analysis.
Are there any helpful resources available on using eazyBI?
Yes, we have vast help & support resources available across different channels:
- Our extensive knowledge base includes detailed getting-started instructions, how-to videos, links to demo dashboards, etc.
- You can reach out to our Support team via Contact with any technical or reporting questions.
- Speak to the active eazyBI community online.
- Get a vetted eazyBI partner via Partners to advise you on the best reporting structure and create it for you.
Why can't I see my historical View stats in the beginning?
In the beginning, Page views, Pages viewed, Users viewed, Spaces viewed measures are empty as eazyBI hasn’t collected data yet.
While data on Confluence page and space meta-data is available instantly, eazyBI will start accumulating the data on page views (who, when, which pages) from the moment when an eazyBI account is set up, and space is selected for data import.
Is our data safe with eazyBI?
Absolutely. eazyBI is SOC 2 Type II certified and was built with security best practice in mind (see our privacy policy here):
- Data is encrypted during transit and at rest.
- Account-specific data imports are stored in a separate database schema, isolated from other eazyBI accounts.
- eazyBI for Confluence Data Center data is stored on our customers’ servers. We don’t use any external hosted services.
- All incoming web requests are authenticated and authorized before gaining access to an account, as well as logged in the Confluence server log directory so you can trace all user activity if needed.
- eazyBI for Confluence Cloud is hosted on Google Cloud Platforms. We take care of provisioning, monitoring, and managing virtual servers, as well as providing support to our subscribers. Customers can choose their data residency location to be either:
- Europe (EU) europe-west1 data center in Belgium.
- United States (US) us-east4 data center in Virginia, US
- eazyBI for Confluence Cloud users are authenticated using Atlassian Connect JWT authentication. Learn more: eazyBI for Confluence Cloud Security Statement
For more information, read our Security page or contact us.