
Agile Business Intelligence Explained
Agile organizations use data for better decision making and to move the business forward quickly. But with data scattered across multiple projects and teams, it can be a challenge to create a common reporting structure.
The lack of centralized data management also impacts the speed and flexibility needed to support business agility.
Modern business intelligence (BI) tools are developed to solve those challenges, but they may come with a hefty investment and involve IT support. What if there was a more cost-effective and efficient way to achieve BI agility?
Yes, you can find BI capabilities embedded in many productivity apps that your teams are already using today!
Built for agile teams, Jira is among the most popular agile management tools that provide competitive data reporting features. Powered up with eazyBI solutions, Jira allows you to instantly generate reports and capture business insights on a single platform.
Innovative companies like Verifone and Cisco are counting on Jira and eazyBI to make critical business decisions and deliver amazing projects. And so can you!
Learn more about agile business intelligence in Jira below.
Traditional vs. Agile Business Intelligence
Before we dive into the implementation of eazyBI in Jira, let’s go through the fundamentals of agile business intelligence.
Traditionally, BI applications are designed to handle repetitive and structured tasks in a waterfall approach. Think basic financial reporting—a routine, yet incredibly manual process with rigid requirements.
The process of gathering business requirements, designing data models, and analyzing multiple databases can be time-intensive. Since the audit only starts at the last phase of development, it often takes weeks or even months to extract relevant data locked in multiple projects. Hence, companies are looking for a better way to reap the benefits of BI investments quicker and, more importantly, to respond to changing business needs in real-time.
Fortunately, the widespread adoption of agile has transformed BI as we know it. When translated into the BI environment, the agile manifesto addresses:
- Individuals and interactions: Involve business users in the project team to identify the questions we can answer with the data available.
- Working software: Deliver a minimum viable product (MVP) and analyze results through iterations.
- Customer collaboration: Instead of generating a comprehensive BI report, agile BI delivers the right information to the right user at the right time.
- Responding to change: Agile BI reflects actual project data to support decision-making when changes arise.
Based on agile practices, businesses aim to create data models that can accommodate changing business goals and market conditions. In a nutshell, agile BI helps to accelerate the time it takes to deliver business value. This new approach allows businesses to ensure a nimble and adaptable BI environment while reducing IT overhead.
Achieving BI agility is simple, once you have the right tools. We’ll talk more about that below.
Enabling Agile Business Intelligence in Jira with eazyBI
Is Jira your mission-critical platform? By integrating BI tools in Jira, you can analyze project data at your fingertips.
Good BI delivery needs to aggregate clean and structured data, especially when your data comes from multiple databases. eazyBI Reports and Charts for Jira app allows you to add and analyze data from external sources like SQL databases, REST API, CSV and Excel files, Google Sheets, and more.
That’s not the only feature that makes the add-on one of the must-have project management apps for Jira. Let’s take a look at these extensive BI capabilities in Jira.
Custom Jira Reports
The app features various customized reports and chart types, from high-level overviews to the most granular level—basically, everything you need to analyze project data.
It’s also that much easier to generate reports with the drag-and-drop interface. Instantly build a reporting dashboard to communicate the project’s performance, including data generated from 3rd party apps. With this functionality, you’ll be able to make informed decisions across Jira and facilitate iterative improvements in tandem with the development team.
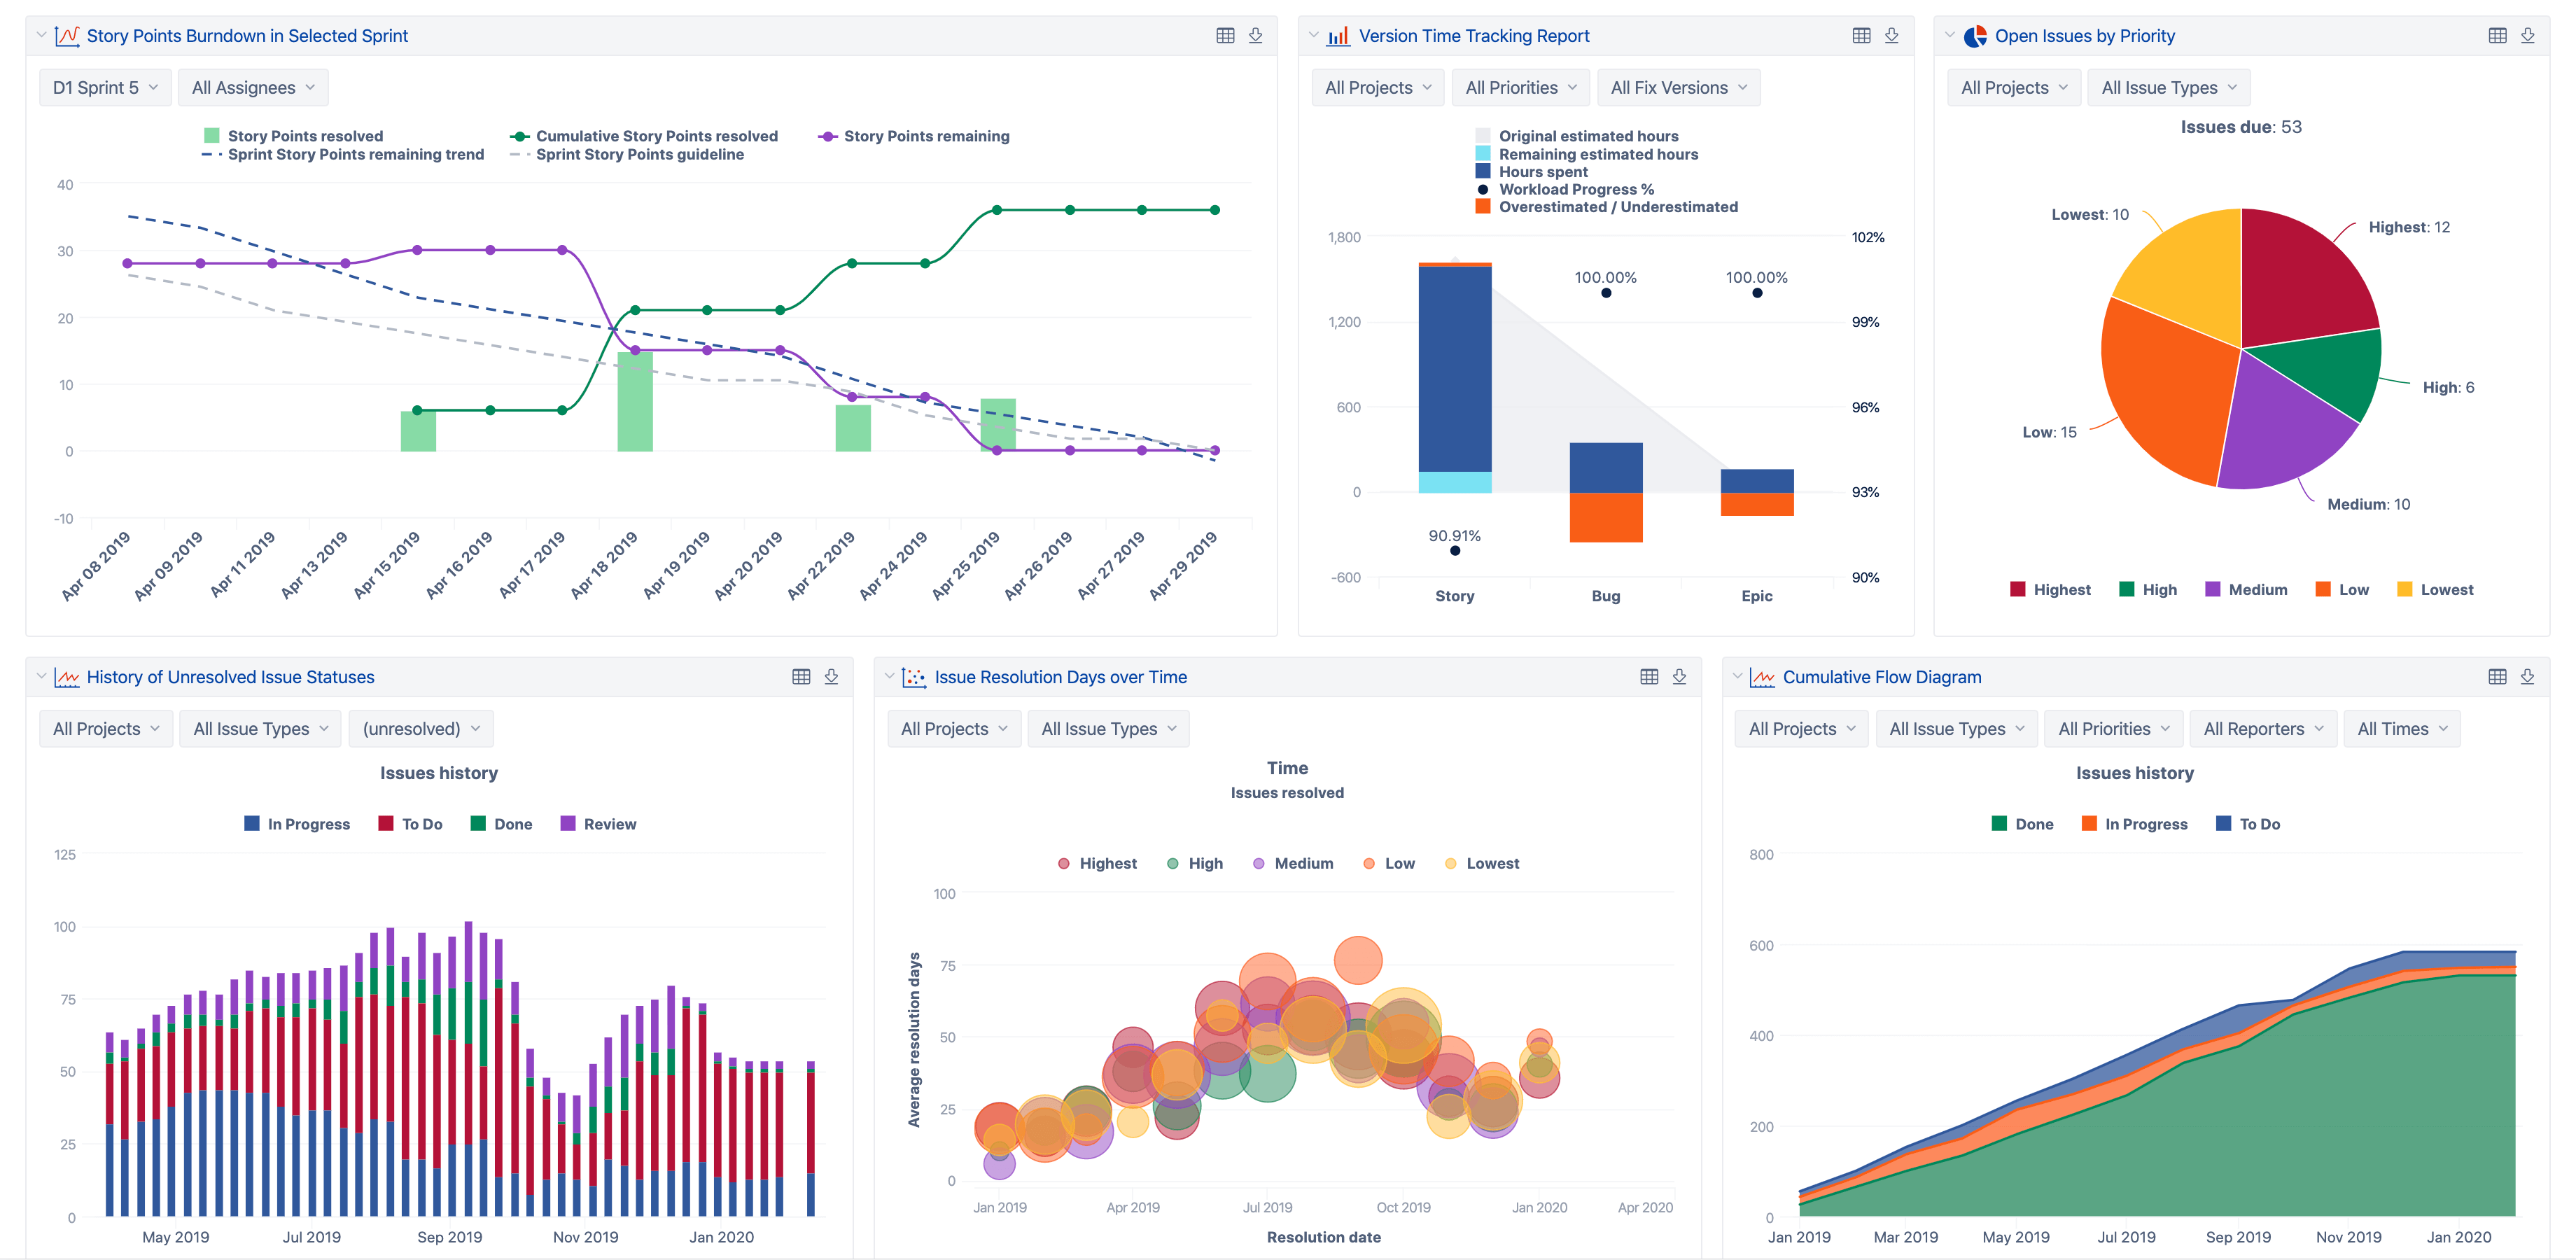
Visualizing your data with eazyBI’s tool provides you with a clearer way to analyze insights.
Regardless of whether your team uses the Scrum or Kanban agile framework, eazyBI helps you drill down key metrics like Sprint reports, burn-up and burn-down charts, versions, and releases. It works with data from Jira Software, Service Desk, as well as other popular apps for testing, project management, or asset management apps, so you can capture insights from multiple projects in one single dashboard.
Read more: Jira Project Reporting Academy
Interactive Data Analysis
Not just generating default Jira reporting charts, eazyBI is extremely powerful when it comes to creating pivot reports.
From the report, you can compile multiple data dimensions and custom fields across Jira projects. Need to run an analysis for instant feedback? Simply drill down your data points or add calculated measures, such as cumulative sum or linear trend, to display accurate information whenever you need it.
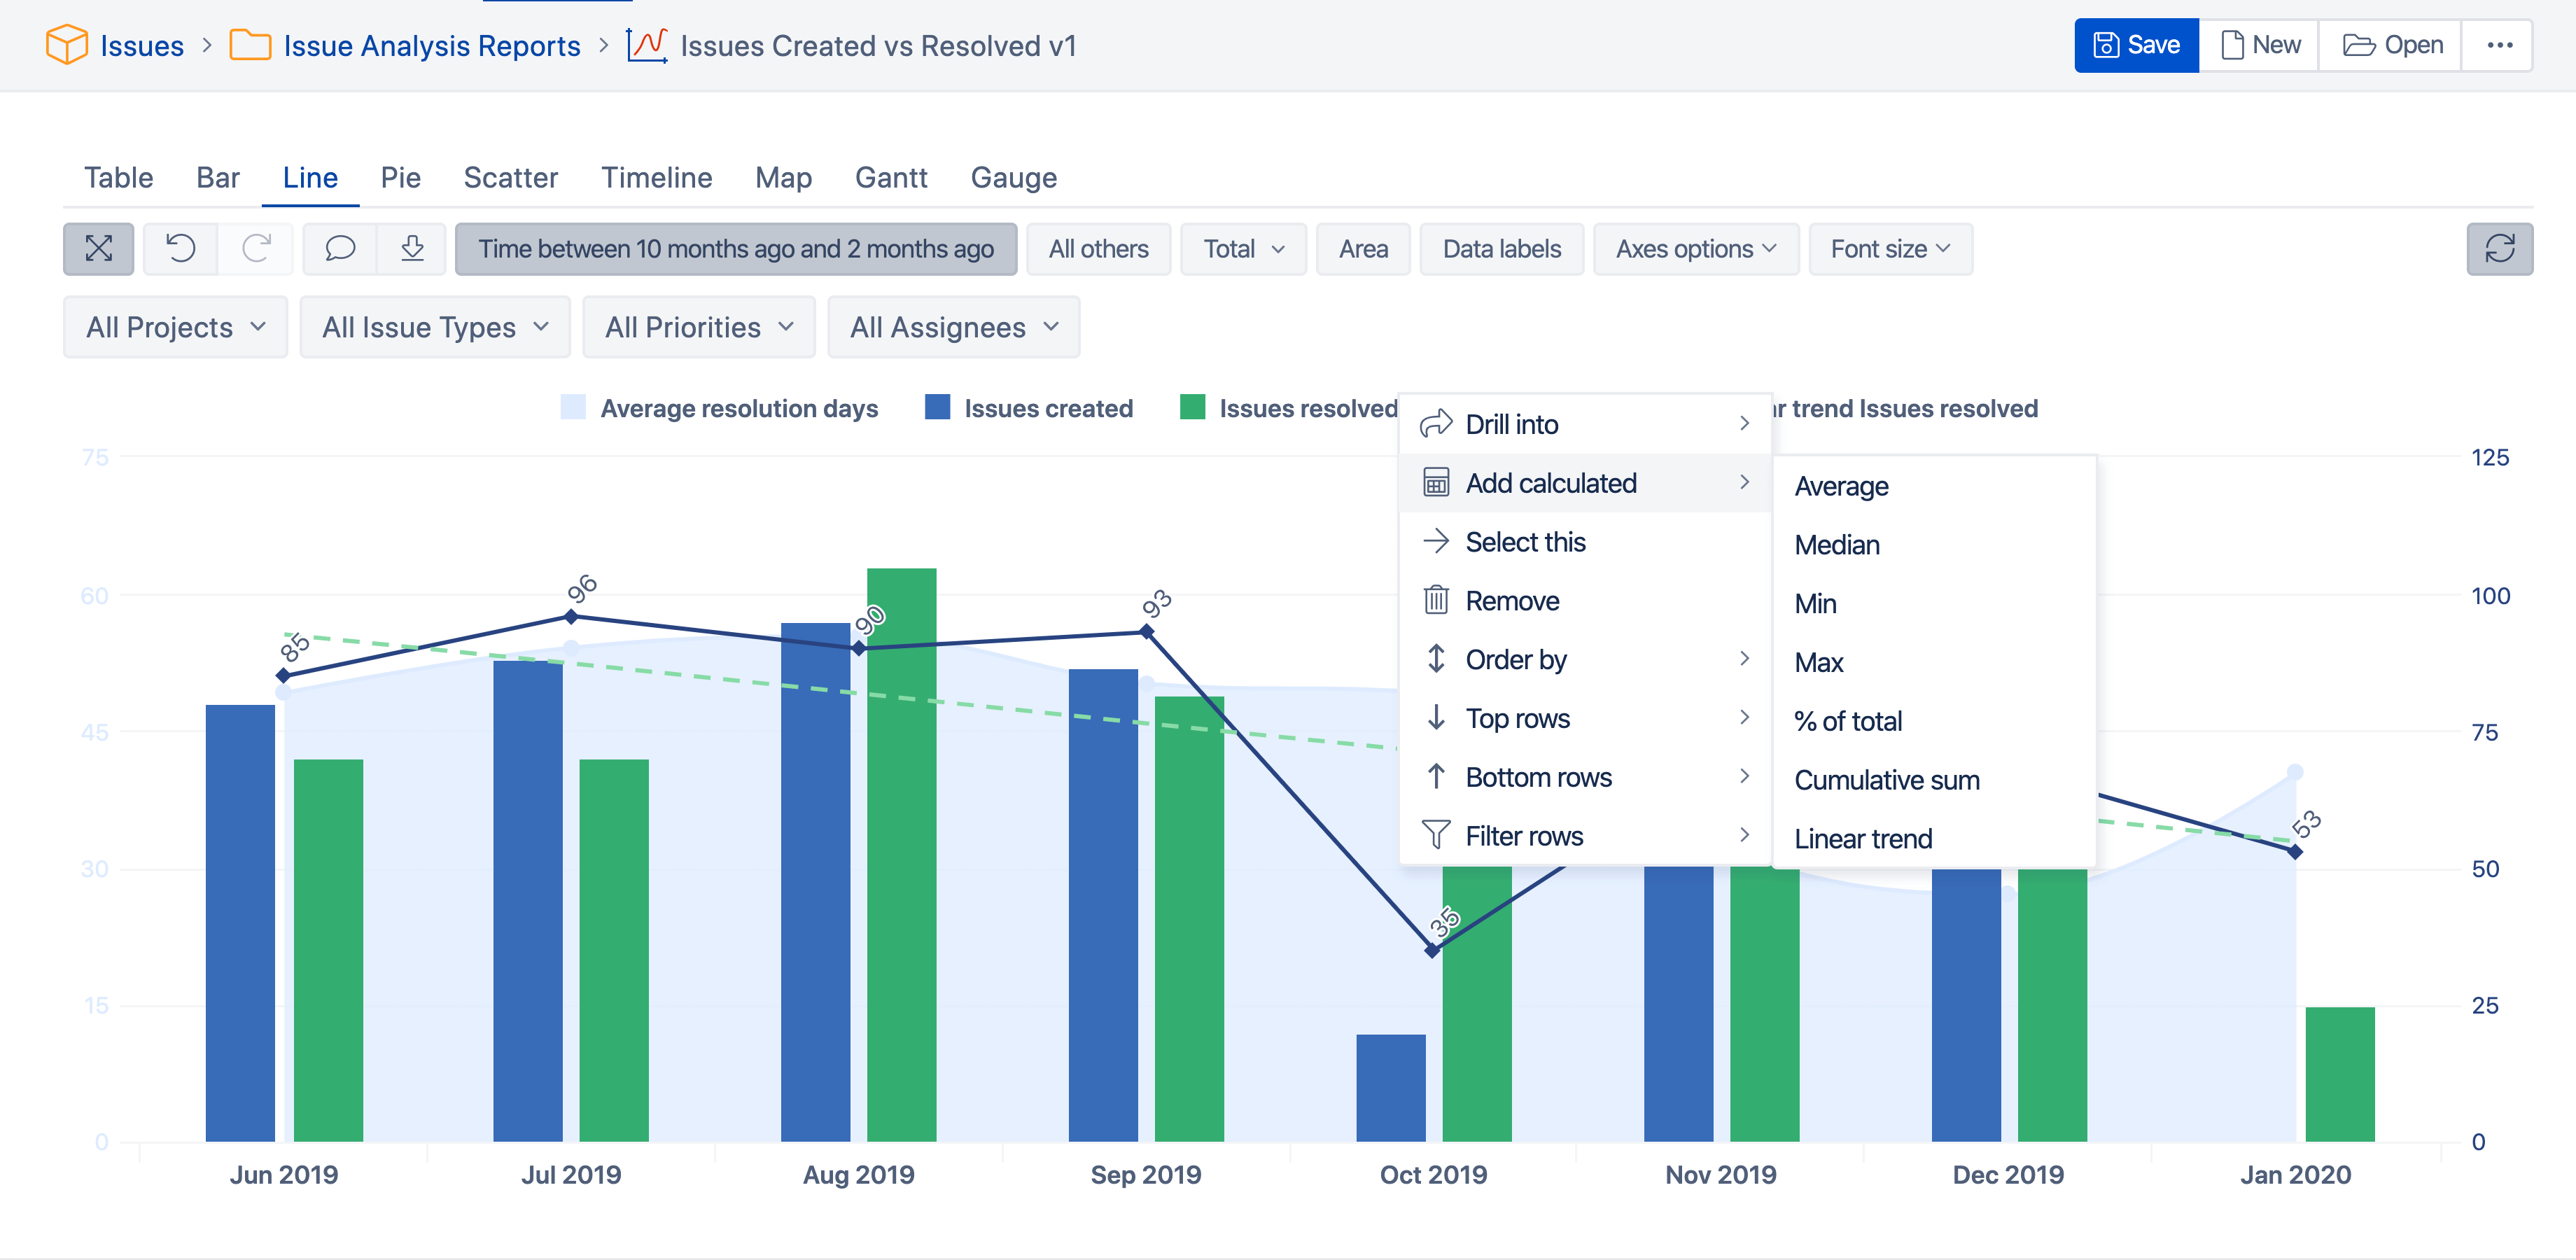
Analyze data points directly from the report.
Uncover trends and insights across data dimensions.
Advanced Metrics Calculation
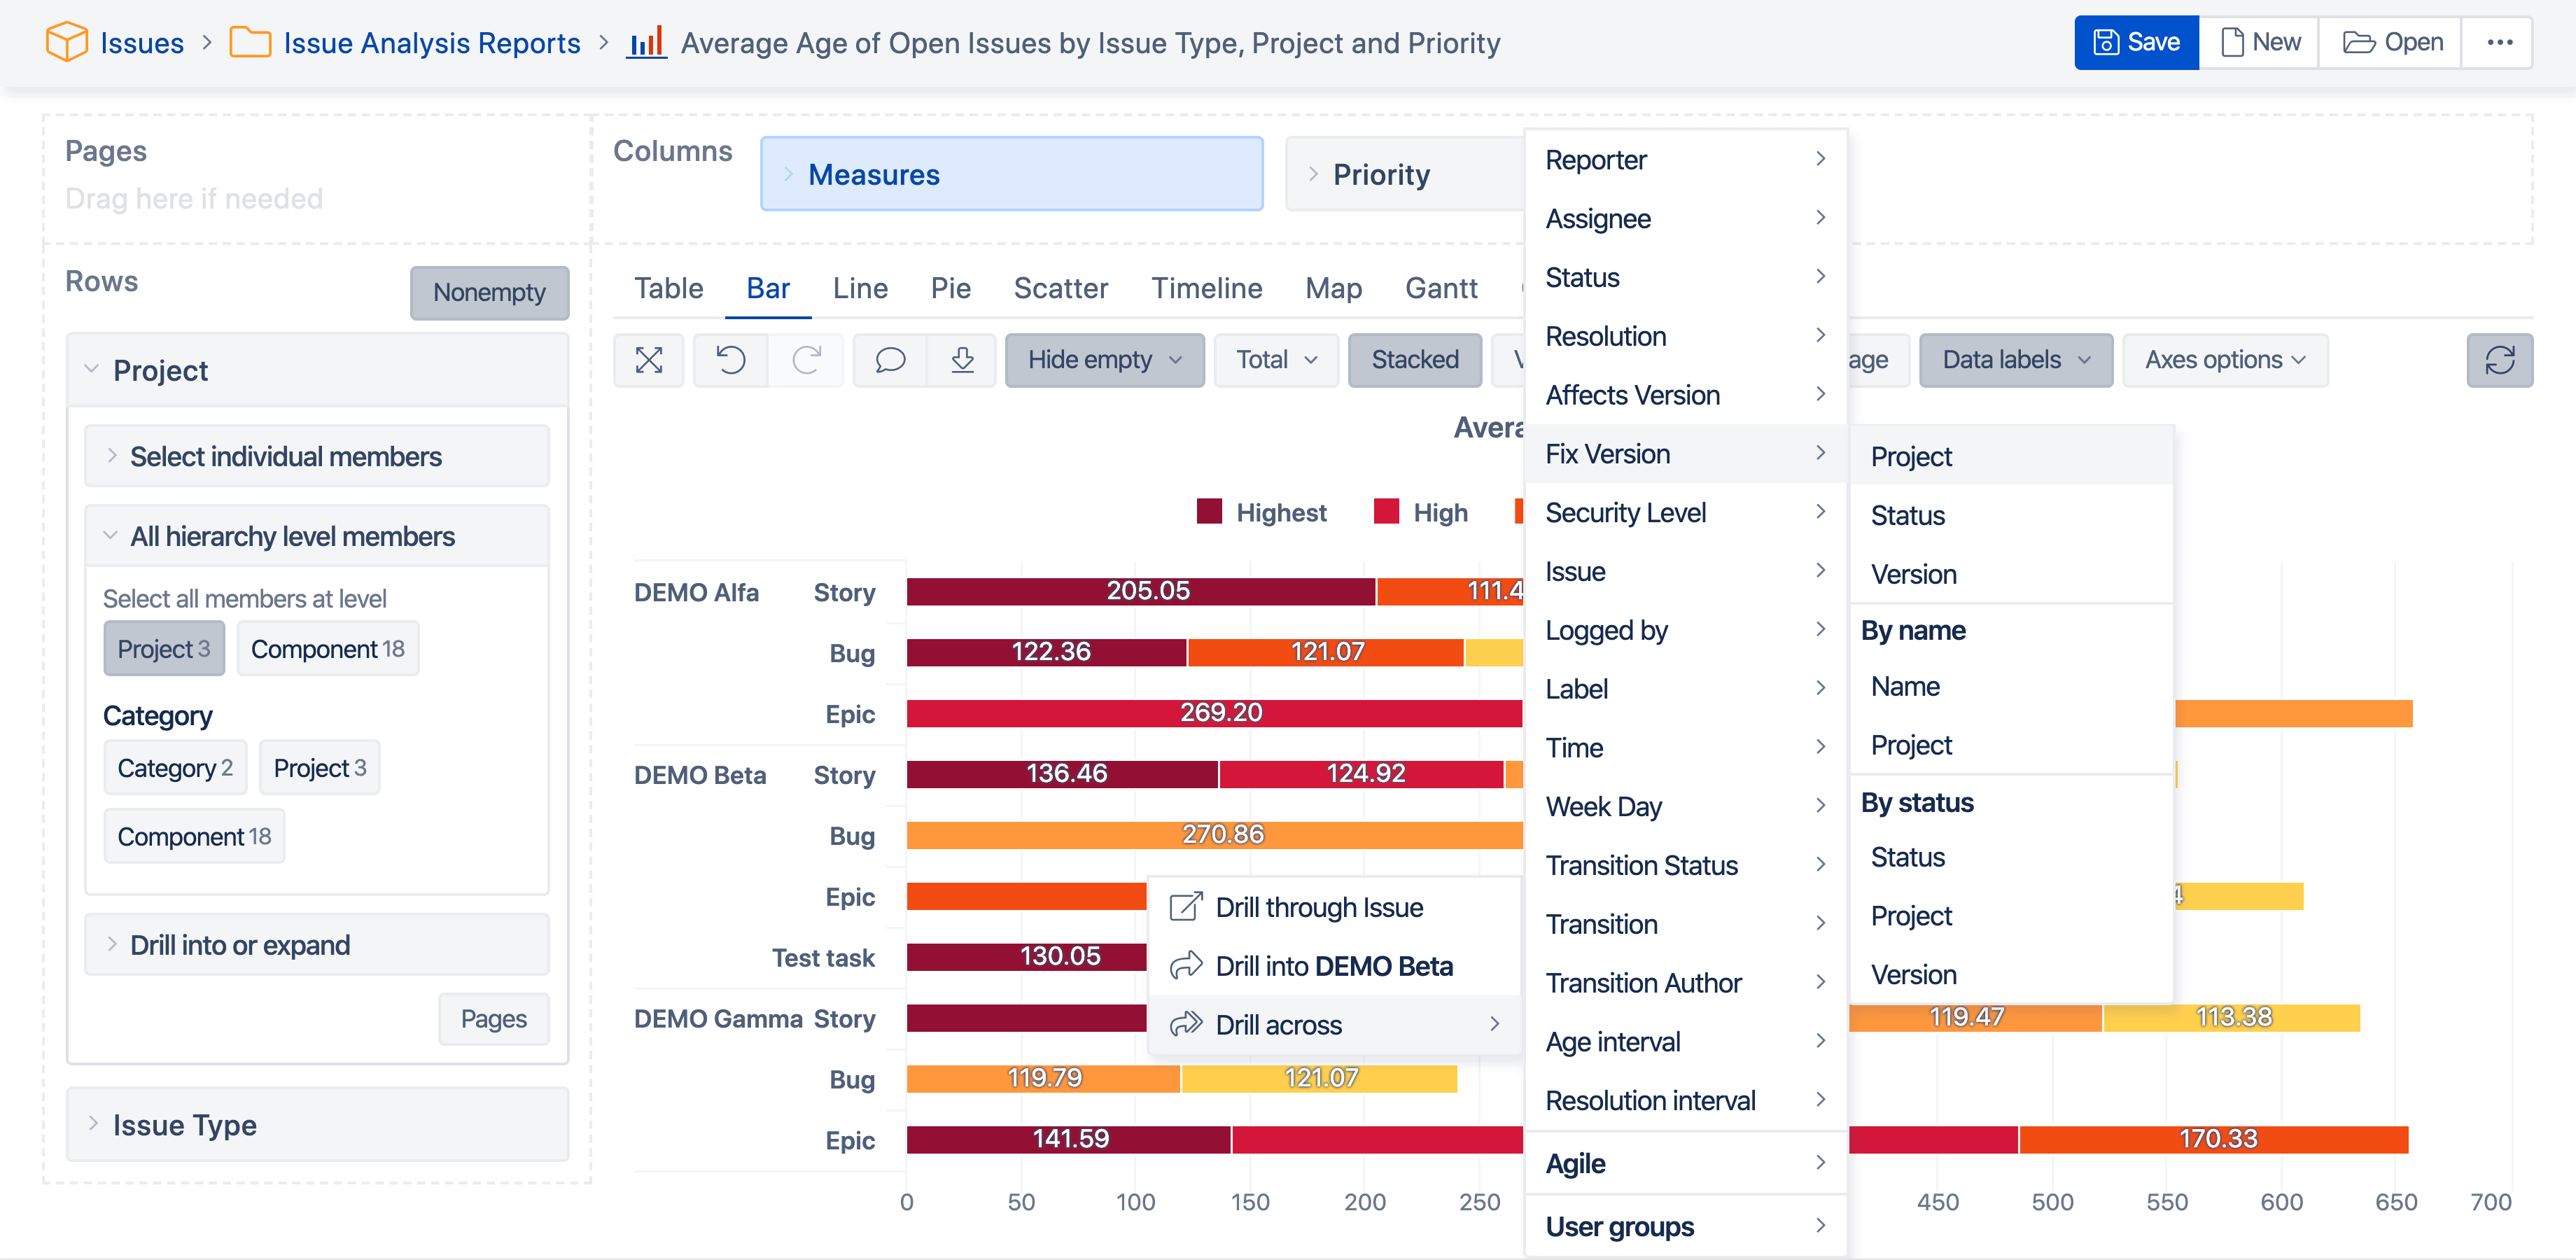
For advanced users, you can create custom data using predefined eazyBI calculations or even create your own formula using the built-in MDX editor.
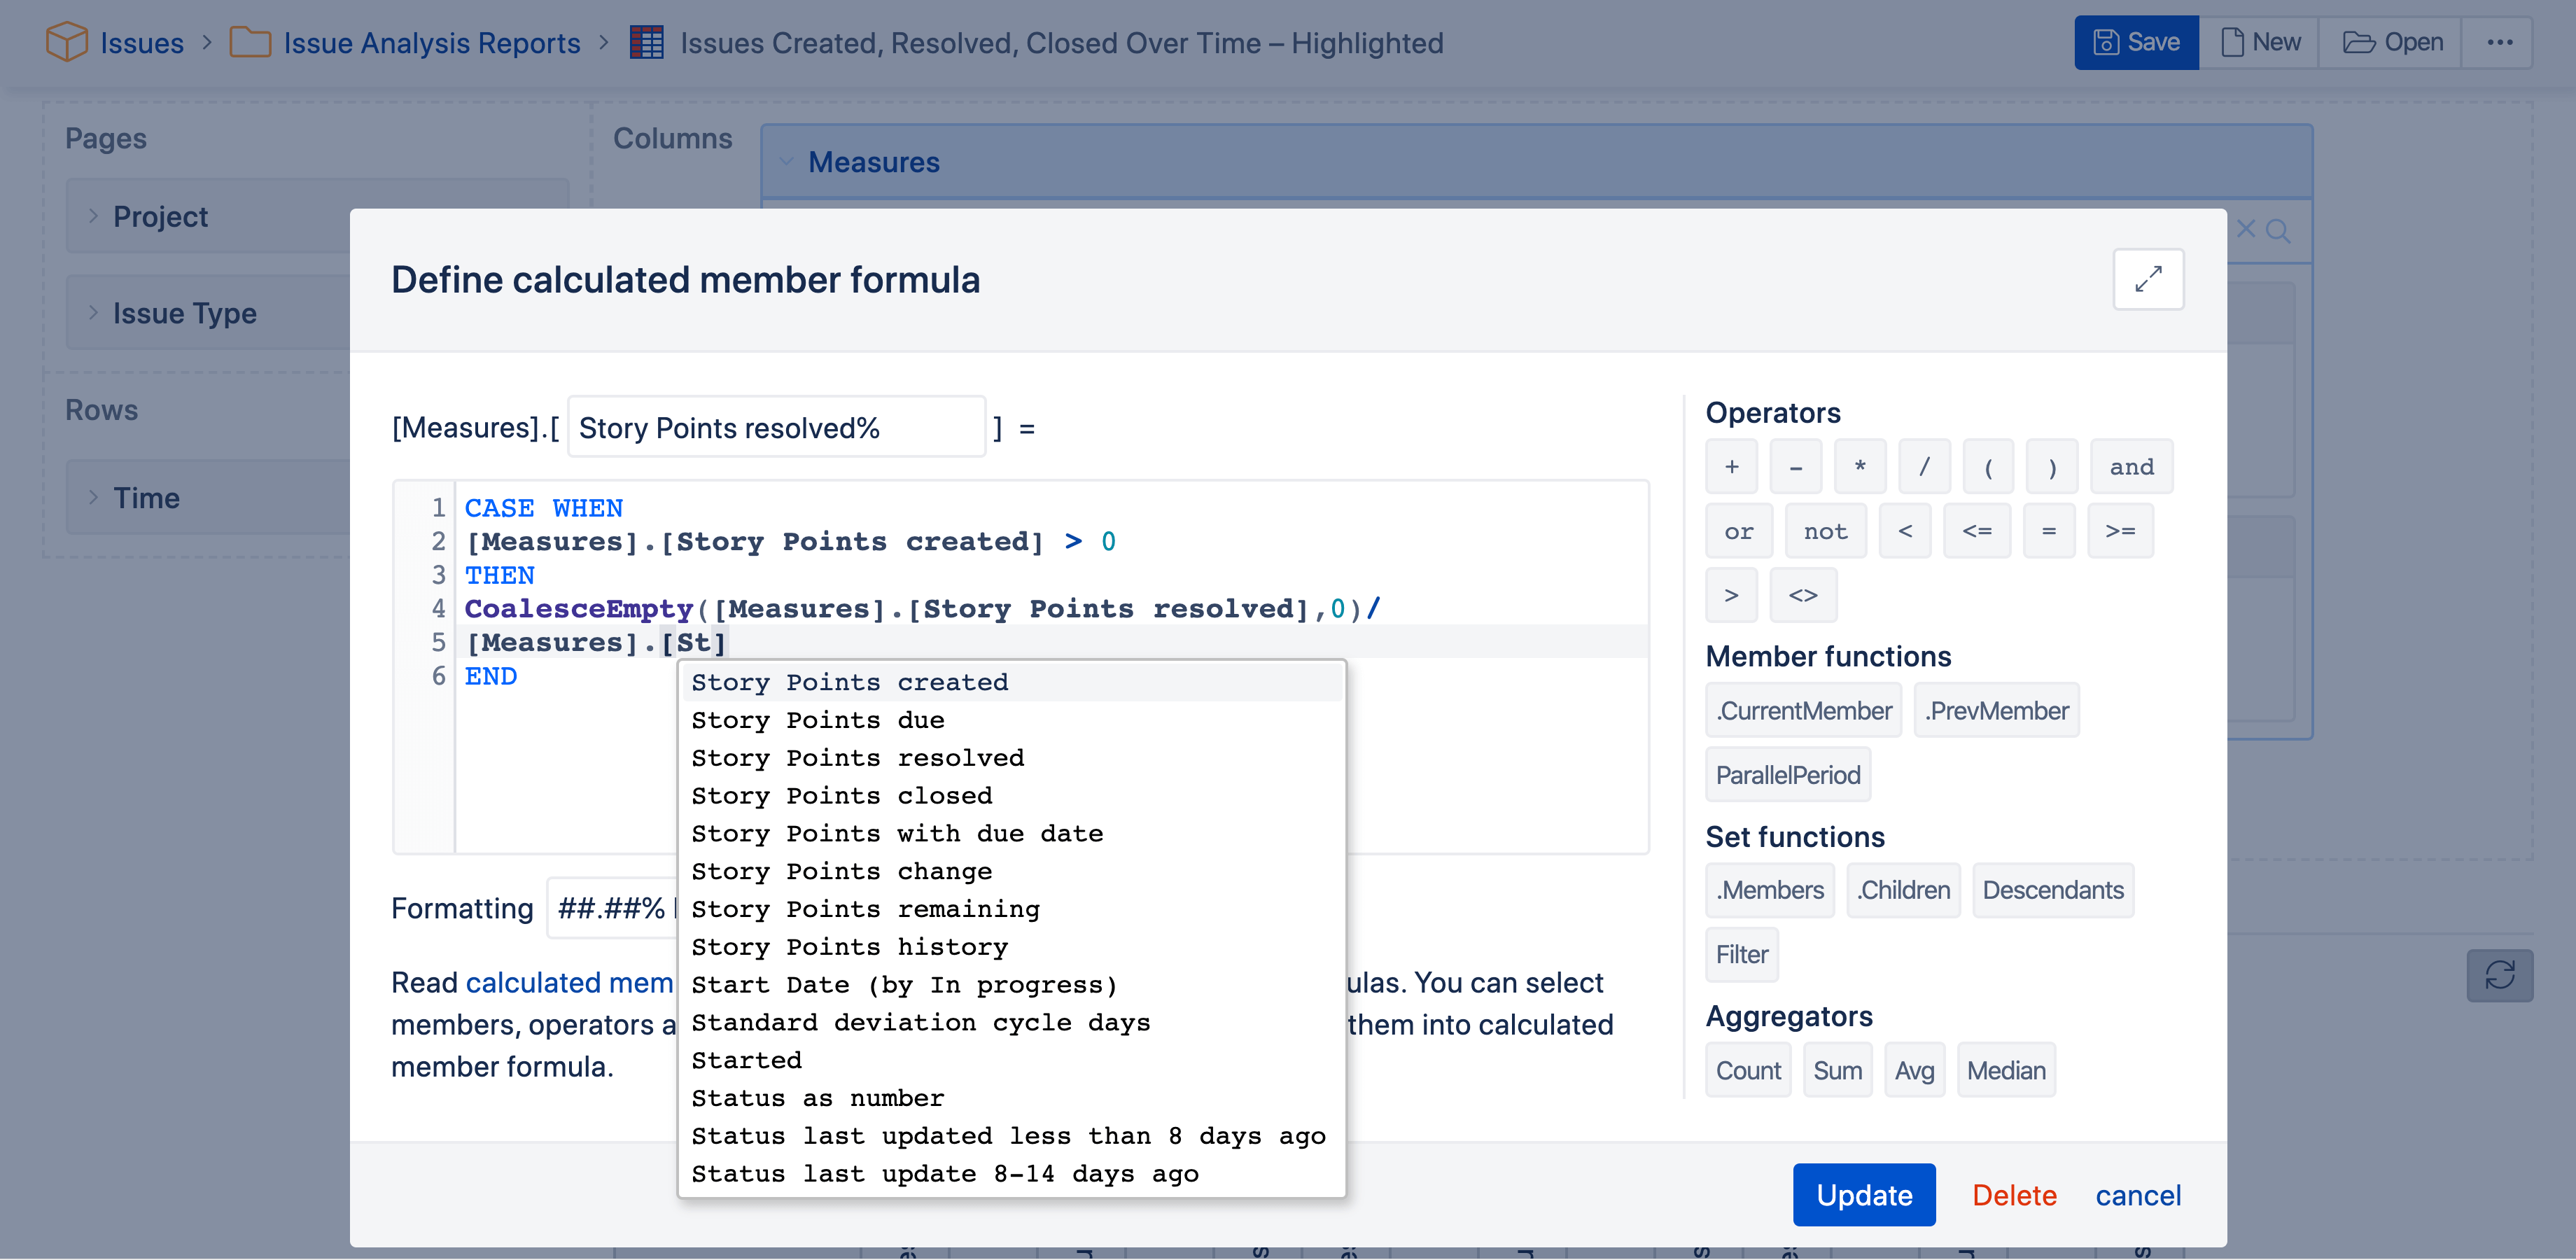
Add custom measures and calculations using an advanced MDX editor.
This additional feature allows you to perform multi-dimensional analysis and analyze business data without any constraints. The best part? You don’t have to be a business analyst or IT pro to navigate our custom calculations. Quickly learn advanced eazyBI through auto-complete and syntax highlighting as you type.
The support center is also packed with a demo report library where you can find helpful resources to get started quickly.
About the author

This article is provided by Ricksoft, Atlassian Platinum Solution vendor, and creator of Atlassian apps WBS Gantt-Chart for Jira and Excel-like Issue Editor for Jira. Ricksoft is a fast-growing organization with headquarters in Tokyo, Japan serving 1,000+ customers and brands including Airbus, Canon, Charles Schwab, Costco, Embarcadero Technologies, F-Secure, Fast Retailing (Uniqlo), Google, Honda, and SpaceX.