
Jira Gantt Charts: How to Create a Gantt Chart in Jira
Gantt charts have been around since the 1890s. It was the first formal project management technique and is still widely used today. The Gantt chart is popular because it is easy to understand, helps people work together, and shows the big picture. It’s a visual tool for keeping track of a project’s tasks, deadlines, and dependencies.
Let’s examine Gantt charts in more detail, including their origins, uses, benefits, and deployment in Atlassian Jira.
What Is a Gantt Chart?
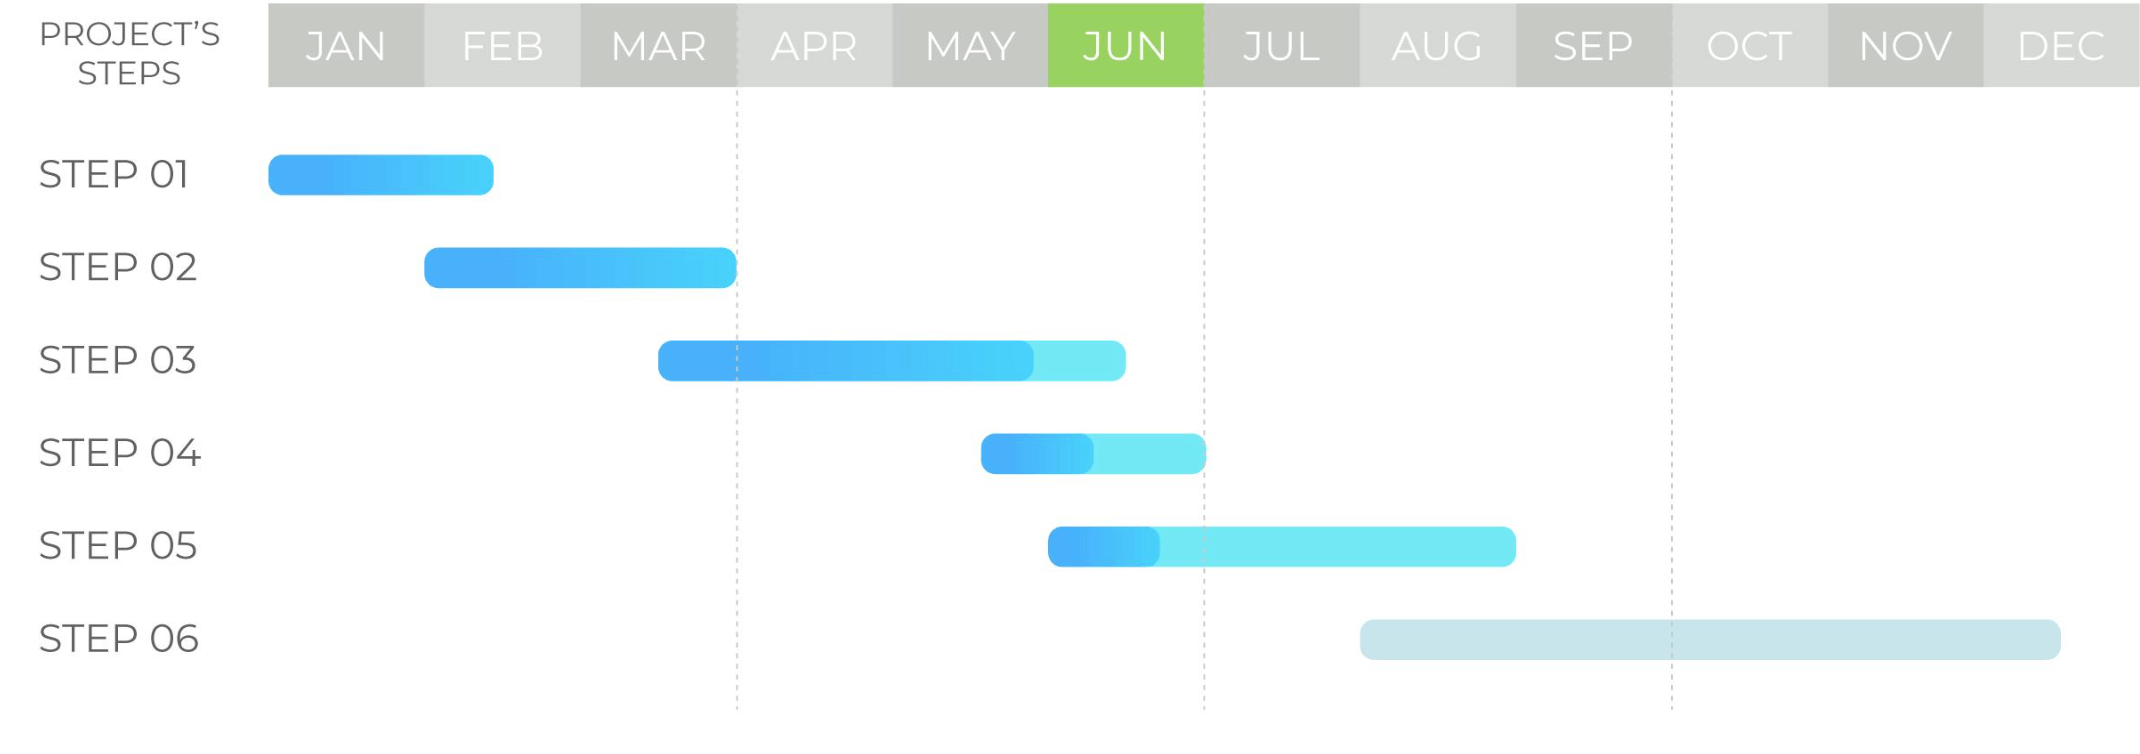
A Gantt chart illustrates project progress and overview at a glance. The chart presents activities in a bar chart where separate bars represent each activity. A bar’s length and positioning on the chart indicate when the activity began, its duration, and its planned completion date.
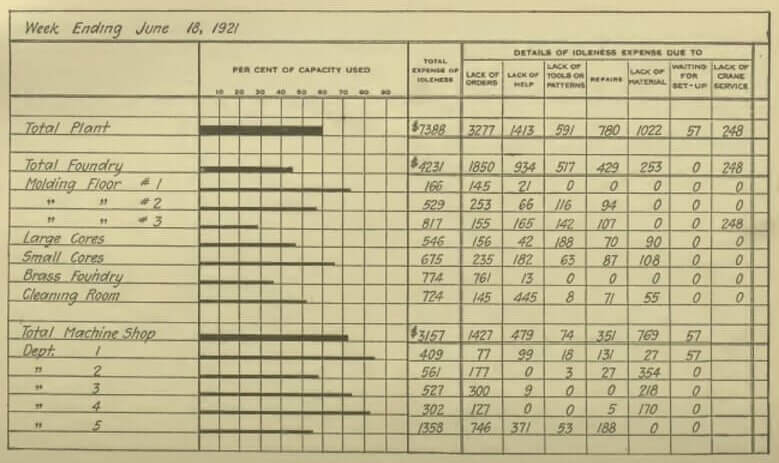
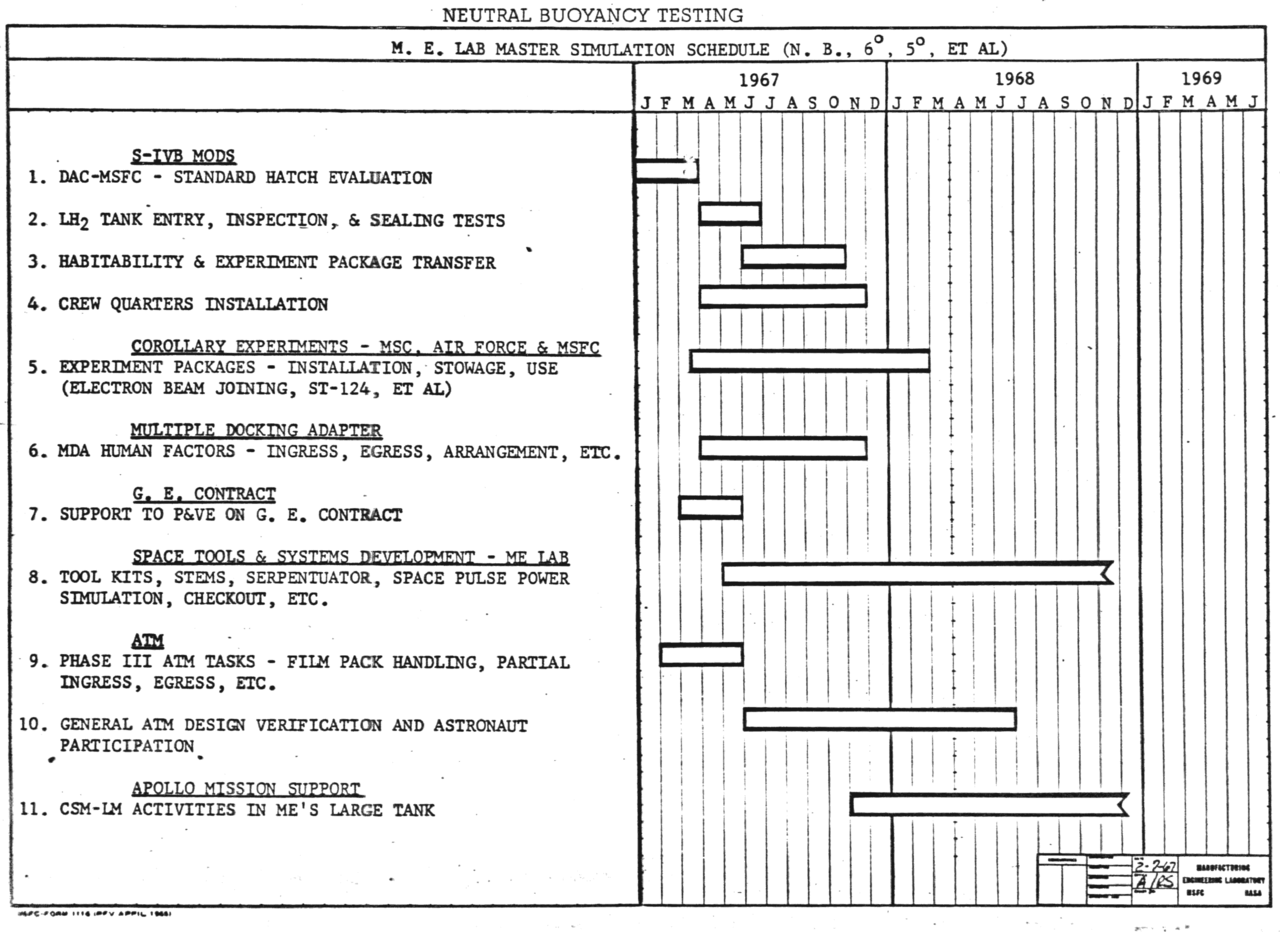
The Origin of the Gantt Chart
The Benefits of The Gantt Chart
While there’s no shortage of project management tools available, what is the benefit of Gantt charts compared to other project management tools?
Gantt Charts Are Great for Project Management and Overview
 Gantt chart is an indispensable project management tool that illustrates a project breakdown structure. You can map out a project’s workflow more effectively from start to end.
This is useful for project managers when walking teams through the different aspects of a project. A broad outline shows all the main ideas, tasks, and requirements. This can be adapted as the project develops, for example, if new requirements arise or certain milestones need to be emphasized.
Gantt Charts Help to Improve Focus
 With Gantt charts, you can narrow projects down to individual sprints and establish how different tasks affect one another and the entire project. This view of task dependencies can be applied to ensure a certain task can only start once a necessary prior one is completed. As such, teams can direct their time, attention, and efforts to the most urgent matter. This is referred to as the waterfall project planning method.
Gantt Charts Offer Improved Deliverability
 Gantt charts are excellent at helping to manage deadlines. Today’s work environment is often demanding, with teams having more complex obligations to fulfill.
Gantt charts provide a way for teams to see the most efficient path to reaching their goals. With Gantt charts, essential tasks are easy to identify well in advance, and project management software with Gantt chart capabilities typically makes it easier to track shifting deadlines. This way, teams are better positioned to deliver on time and within budget.
Gantt Charts in Project Management
The main idea of a Gantt chart is to map out which tasks can be done in parallel and which require a sequential approach. As a result, project managers can assess the scope of work, dependencies, resource allocation, and timescales that affect the project’s end date.
In project management, Gantt charts are used for:
- Creating an initial project schedule—this makes individual responsibilities clear while helping determine how long it will take to get the project done
- Determining interdependencies by defining the relationships between multiple tasks and visualizing the order to follow in executing them.
- Project workflow overview by offering a clear sequence of tasks that have to be done in sequence and those that can be done in parallel
- Resource allocation to ensure everyone is on the same page
- Making necessary adjustments over the duration of the project as things change
- Monitoring and reporting progress at an individual and collective level to prevent the project from going off course
- Managing and communicating the project schedule to participants and stakeholders
- Keeping track of key milestones and achievements
- Identifying and addressing issues thanks to its visual nature: It’s easy to pinpoint what’s falling behind schedule and take the necessary steps to keep the project on track
Gantt Charts for Agile
Gantt charts are not typically used in agile software development. Agile methods favor flexibility over strict planning. However, some agile teams do use Gantt charts to help track their progress and visualize their work. Sprints often contain some task dependencies. Gantt charts can help map those dependencies during sprint planning.
Sprint planning and Gantt charts together can get you the best of both worlds. Agile projects are fluid, flexible, and adaptable, while Gantt charts provide information on deadlines, dependencies, and resource allocation.
Gantt Charts vs Waterfall vs Roadmaps
At first glance, the Gantt Chart, the waterfall chart, and the project roadmap appear to be the same thing. The main differences between Gantt Charts, Waterfall charts, and Project Roadmaps are the purpose and the scope.
Waterfall Project Management
Waterfall charts are often used for large infrastructure projects such as bridges, tunnels, construction, and manufacturing.
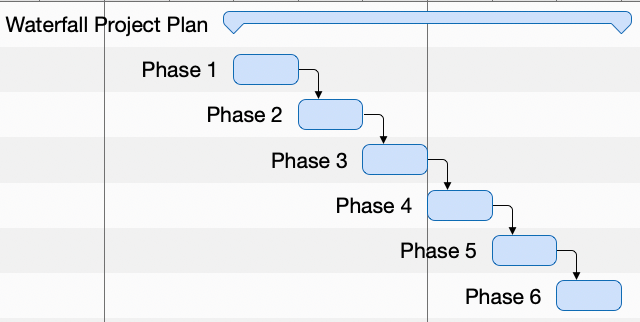
The waterfall project management methodology is essentially a high-level planning tool. It is a sequential process that starts with the concept of an idea and ends with the delivery of a product or service. The main advantage of the waterfall planning approach is its linearity, which makes it easy to understand and follow costs and schedules. However, this can also be seen as a disadvantage, as it does not allow for much flexibility and can lead to missed deadlines.
Gantt Charts vs Waterfall Charts
The Gantt Chart is more like a project tracking tool. It allows for more detail, flexibility, and adaptability throughout the project. For example, one can track project progress, internal dependencies, and deadlines. You can also have parallel "swimlanes". Having multiple concurrent tasks can save time, maximize and optimize resource allocation, and keep the project going.
Gantt Charts vs Project Roadmaps
Roadmaps and Gantt charts are two essential tools for project management. A project roadmap is typically used to communicate the high-level goals of a project to stakeholders. On the other hand, project managers use the Gantt chart as a more detailed planning tool to track progress and ensure tasks are completed on time. Both tools are important for keeping projects on track and meeting all deadlines.
The roadmap defines the "why" behind the project. The Gantt chart establishes the "how".
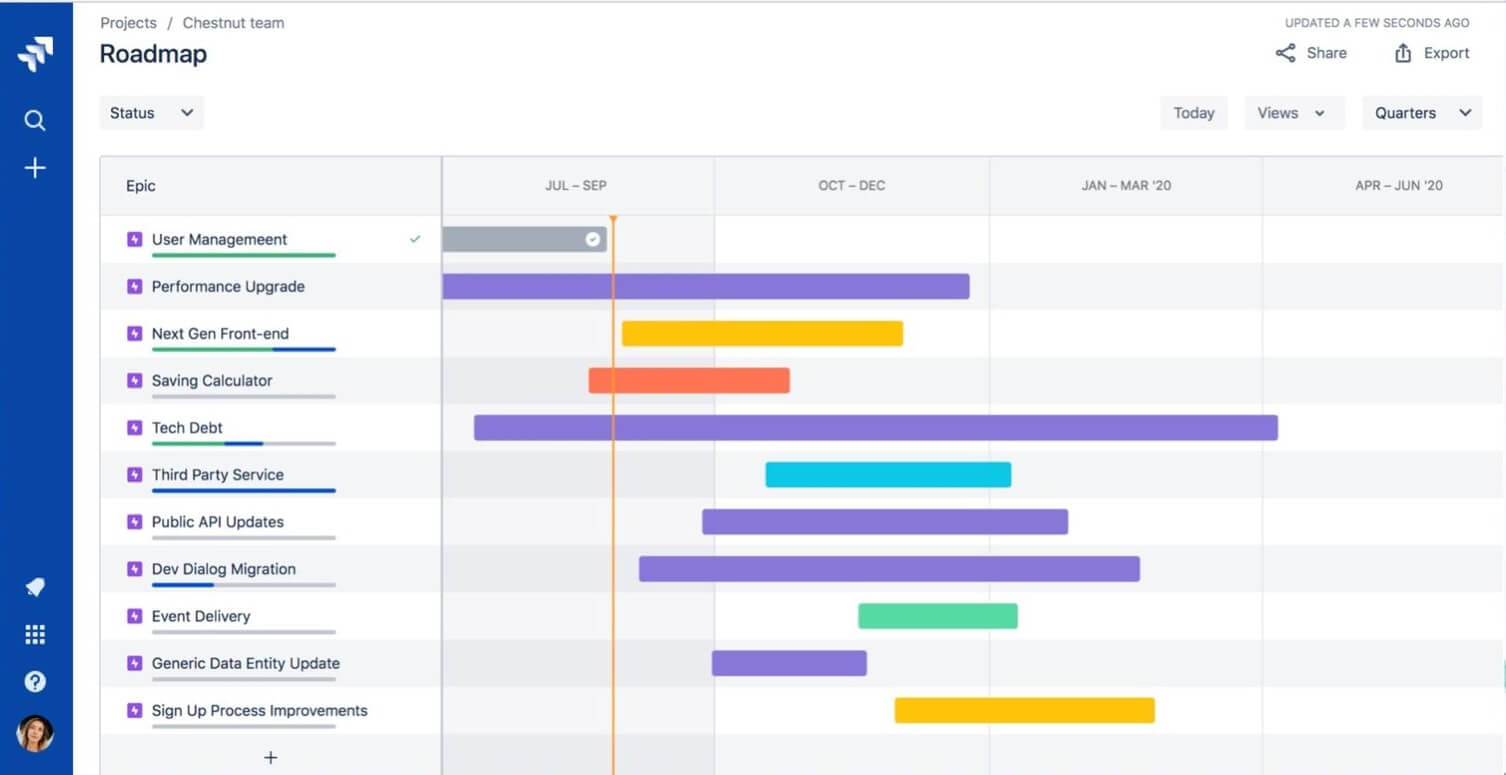
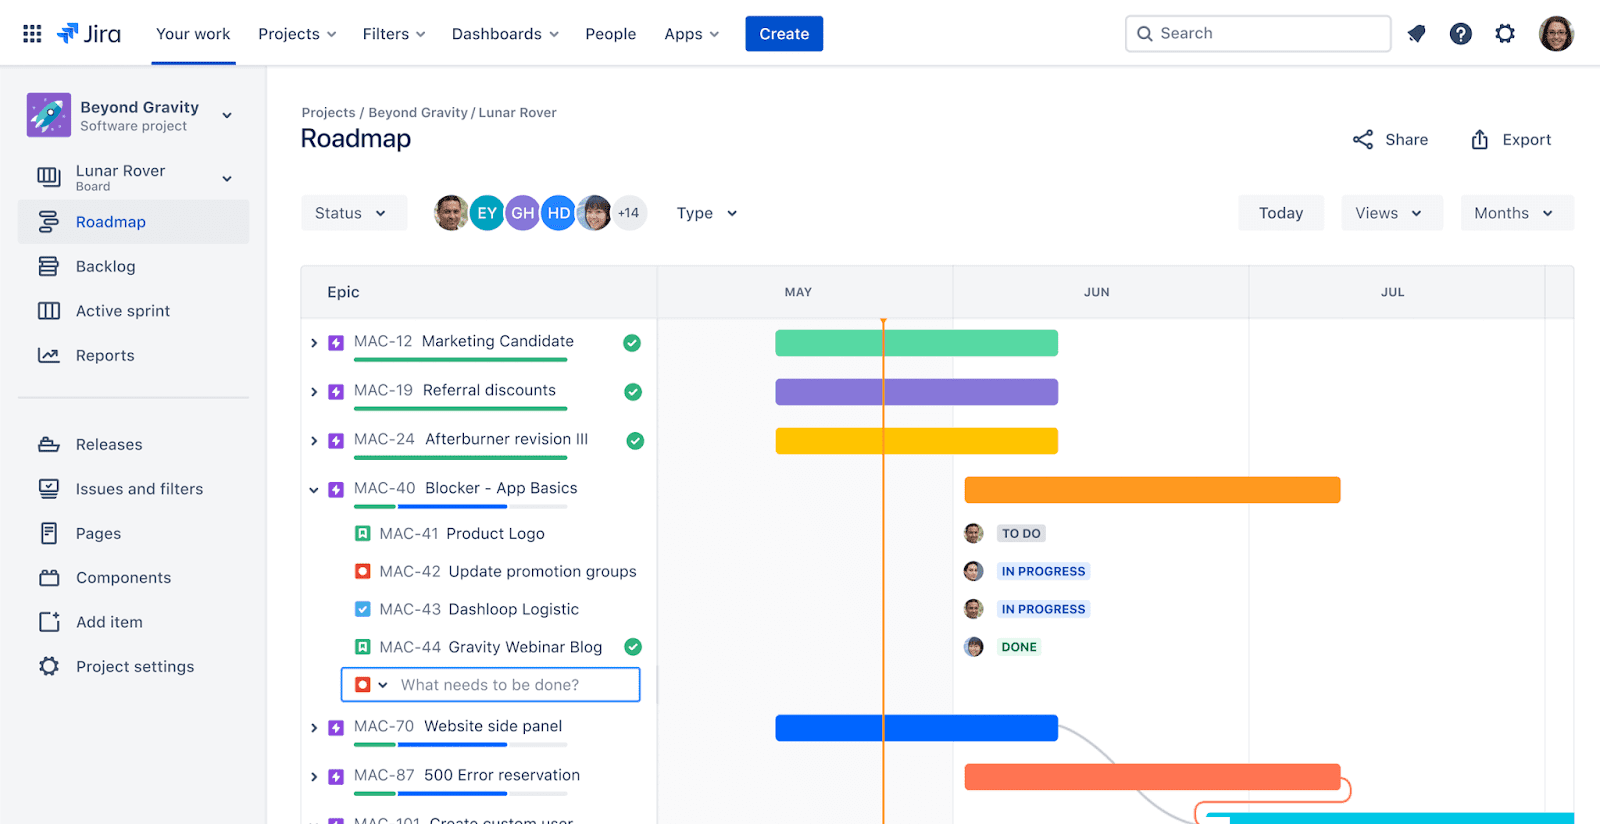
How to Use Gantt Charts in Jira?
While Atlassian Jira offers the Roadmaps feature, it doesn’t offer a Gantt chart view out of the box. To create a Gantt chart in Jira, you must install Jira Gantt chart plugins (a.k.a. add-ons or apps) from the Atlassian Marketplace.
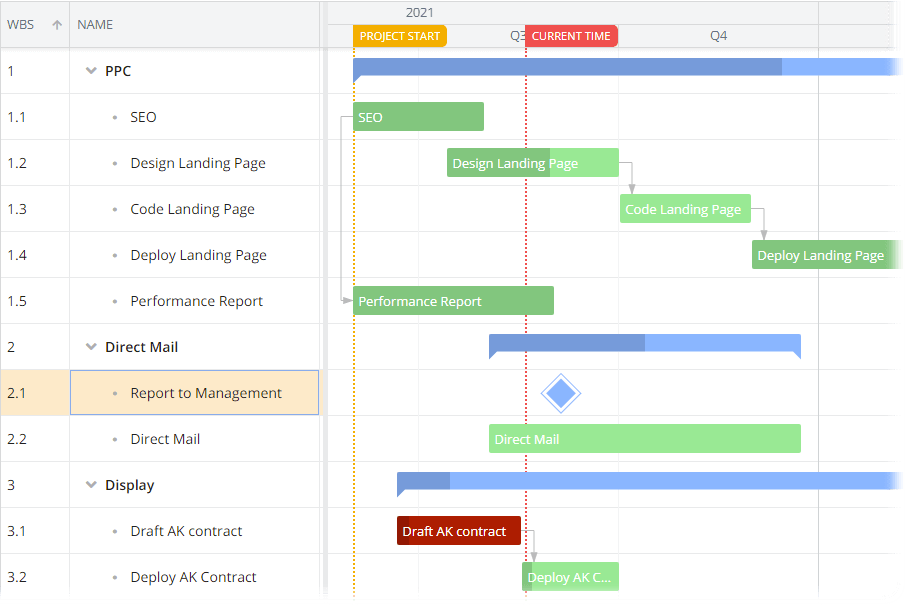
Jira offers two types of Gantt chart visualizations using Jira Roadmaps. The first of these is the project-specific modern Gantt chart. Typically, a project-specific Gantt chart displays time tracking for different tasks and a collapsible task structure and resource management breakdown for Jira projects. This type of Gantt chart is commonly used at a team or department level.
The second type of Jira Gantt chart roadmap is the high-level organization chart. This advanced roadmap helps teams plan, manage, and track intensive projects that require much work. Moreover, advanced Jira Gantt chart roadmaps facilitate cross-team workflows.
Before creating a Gantt chart, you first need to establish the individual tasks to be completed over the course of the project cycle.
Next, determine how long each task will take and the interdependencies between different tasks. This will help you determine a realistic completion timeline.
Jira enhances the Gantt chart with additional features such as collapsible task structures and visualizations of dependencies between tasks.
eazyBI takes this further with room for customization and filtering of different views.
How to Create a Gantt Chart in eazyBI
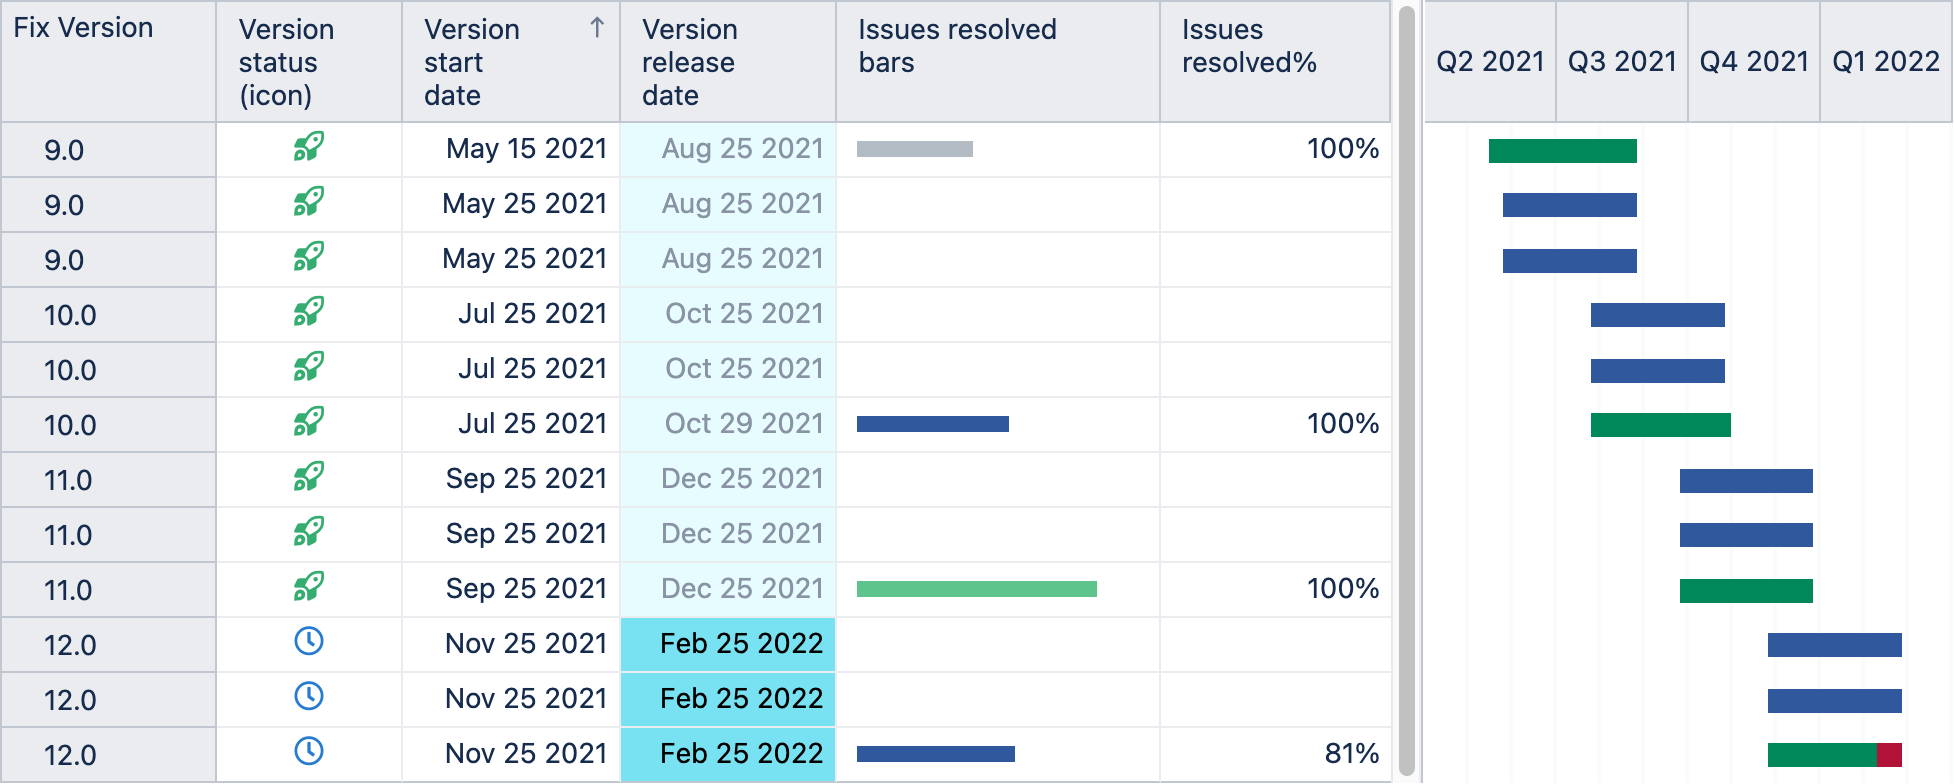
Project teams deal with more than enough complexity in their work on any given day. eazyBI offers an easier way to make the most of Gantt charts. You can create Gantt charts from Issues, Sprints, or Fix versions. The main attributes of any Gantt chart are the start and end dates. You can use any date fields (properties) for your Gantt charts as long as you add them to the first two table columns.
Here are a few more advanced Gantt chart examples you can build in eazyBI.
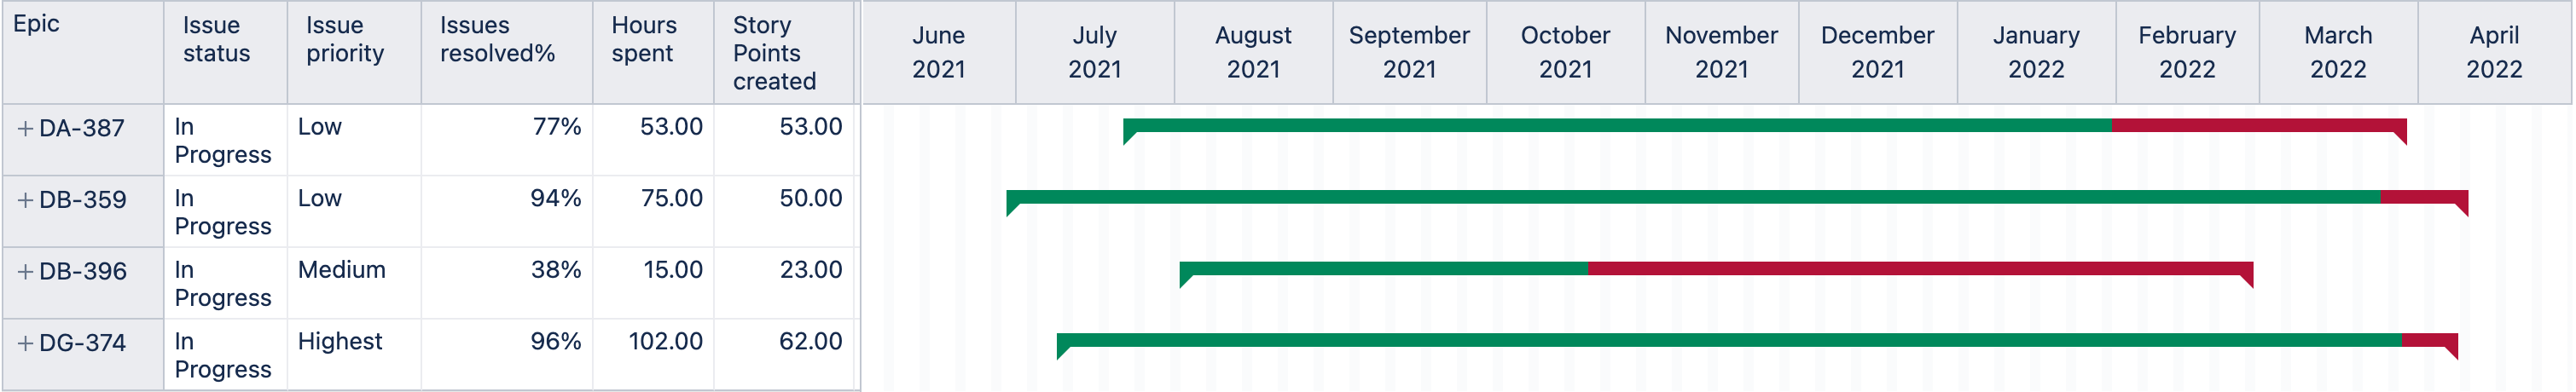
eazyBI Issue Epic Gantt Chart
You can check out the Issue Epic Gantt Chart in the eazyBI demo account. This report shows open epics and issues highlighting key metrics such as hours spent on issues within a given epic. Additionally, the issue epic Gantt chart report indicates story points for issues, the completion percentage, and the issue priority in the selected epic.
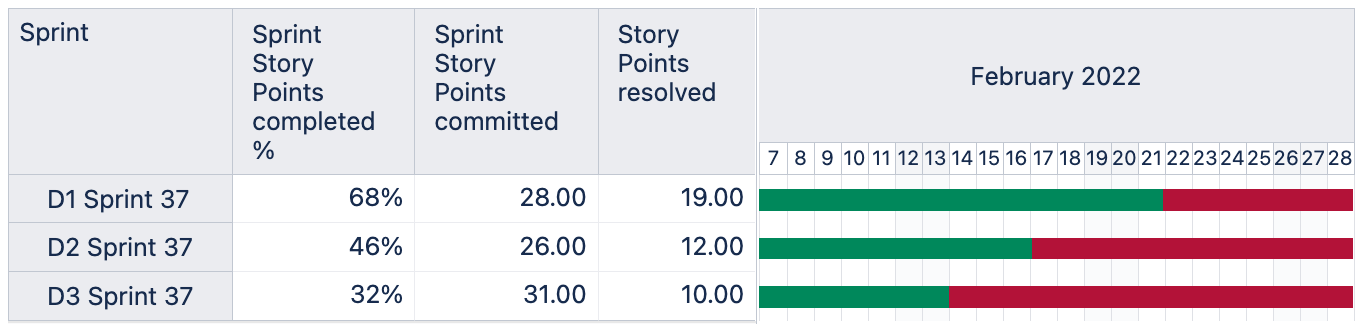
eazyBI Sprint Gantt Chart
This report indicates the progress of a given sprint within an eazyBI project. It uses custom sprint dimensions on rows and sprint-related measures and properties on columns. The "Sprint Story Points Completed %" measure shows you a completion percentage as a number in a cell, but it is also displayed as a green progress bar in the chart.
Make the Most of Jira with eazyBI
You can finally get the insights you need to ensure visibility & transparency with teams, management, and customers. eazyBI is the leading Jira reporting tool that gives you all the company's KPIs in one place - including data from external sources like Google Sheets, SQL databases, CSV, and more.
Creating Gantt charts is just one of the many capabilities that eazyBI offers. Thanks to the seamless integration, with eazyBI Jira reports and charts, you can visualize, analyze, and explore all your data. Build custom reports and project dashboards with a drag-and-drop simplicity without ever leaving Jira.
There’s a lot more you can do. Start a 30-day free trial to explore how eazyBI can improve the reporting side of your organization.