Git Commit Log Analysis Made Easy
Turn your Git commit logs into valuable information. Analyze your Git log and see who, where, when, and what is contributing to your project.
How It Works
A Complete Overview Of Your Git Commits
Git is one of the most popular version control systems for software development. It’s a distributed revision control system built for speed and data integrity, supporting distributed, non-linear workflows.
If you’re a software developer using Git, you might be overlooking very valuable information if you are not analyzing your Git commit log!
- How is your code size changing over time?
- Which files are changed the most?
- Who are the most active contributors and to which parts of the code base?
- What is the ‘Net’ gain of your project contributors? Are they adding code or deleting it?
- Which hours of the day are the most productive?
- On which days of the week are your contributors most active?
Answers to these and many other questions are right there in your Git commit log.
Of course, Git log isn’t very useful in a plain text form with hundreds, thousands, or even tens of thousands of lines and commits.
This is where eazyBI can help:
- Export your Git log to a .txt file from your project directory with
git log --numstat >filename.txt - Upload and import your Git log .txt file into eazyBI and you’re all set.
- Start analyzing in minutes with pre-defined charts, reports, and dashboards.
- Use drag-and-drop interface and advanced calculations to create your own reports and dashboards.
- Export any data to CSV, Excel or share using iframe or OpenSocial gadgets.
Git Commit Log Analysis in eazyBI
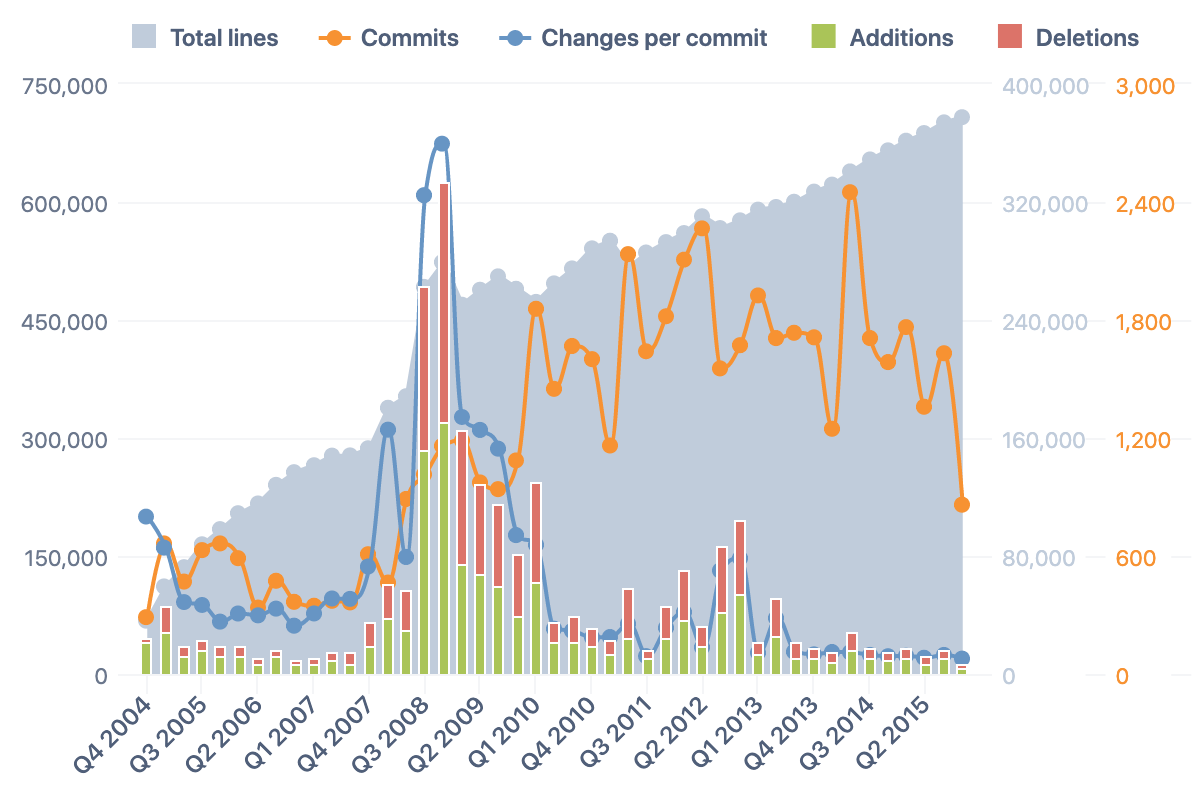
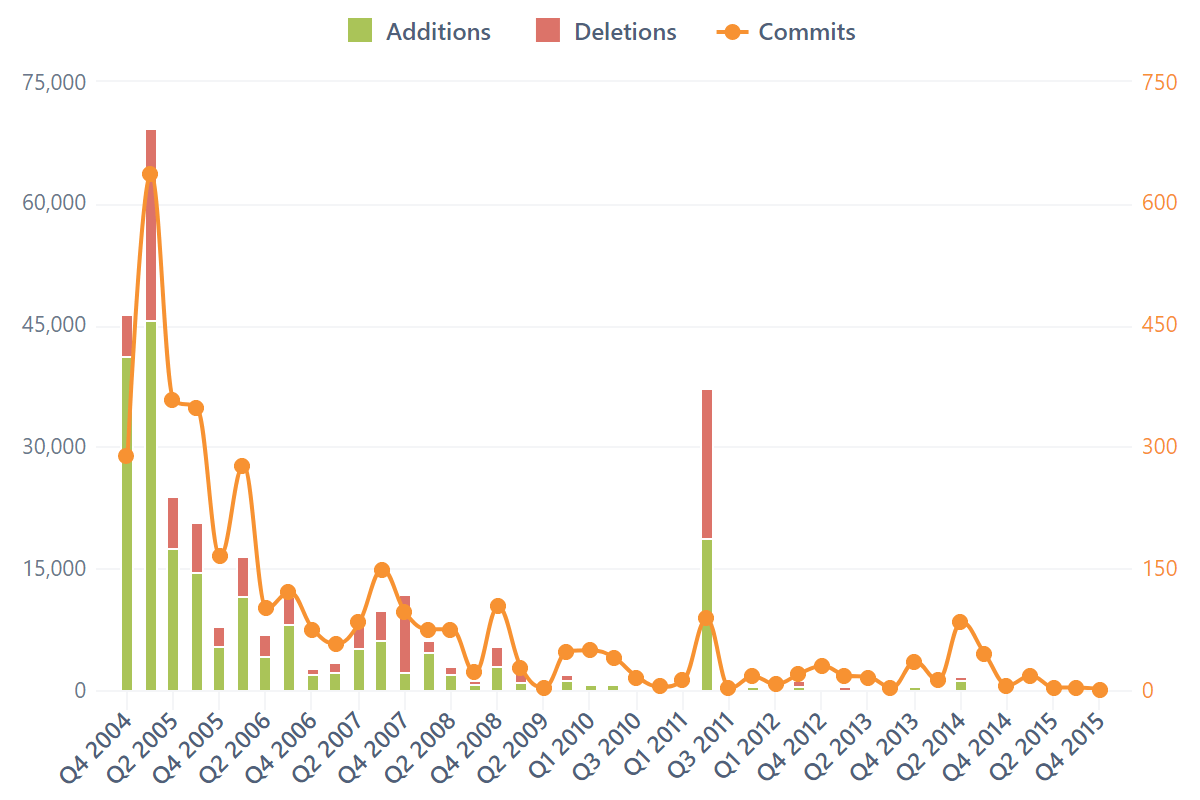
Git Commit Analysis – Changes by Quarter
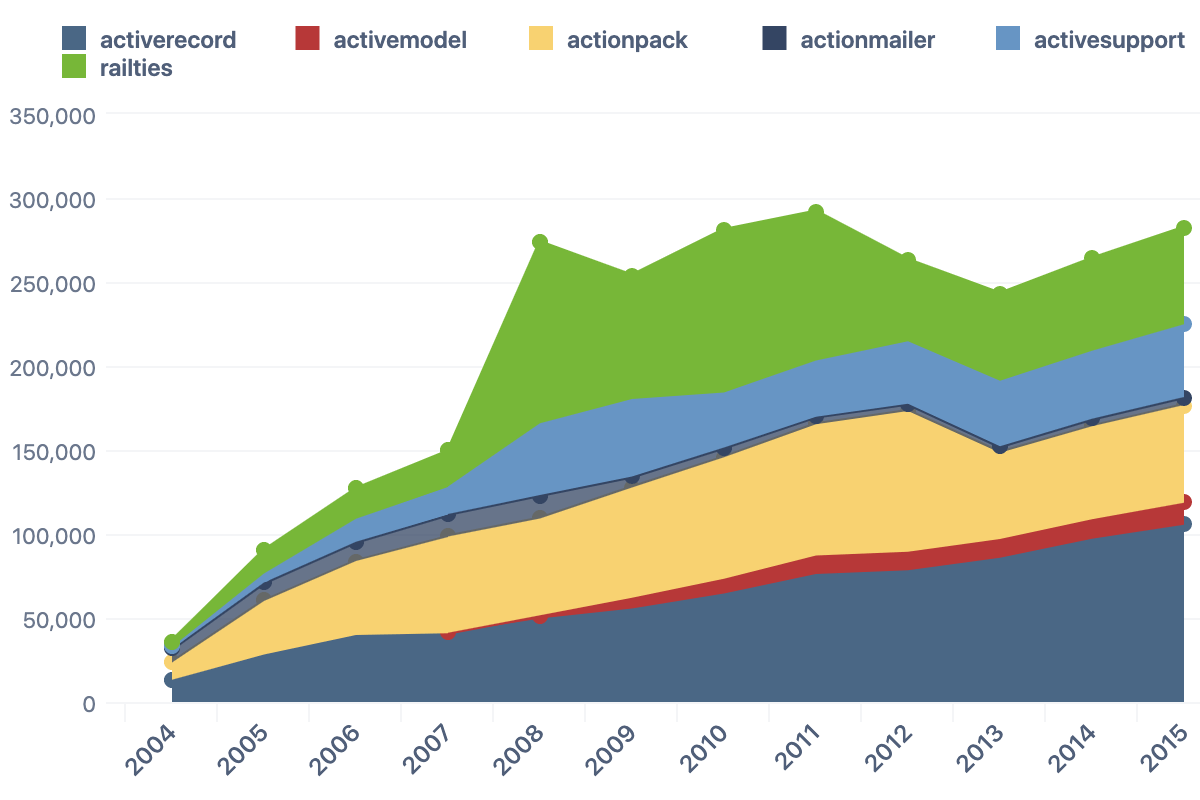
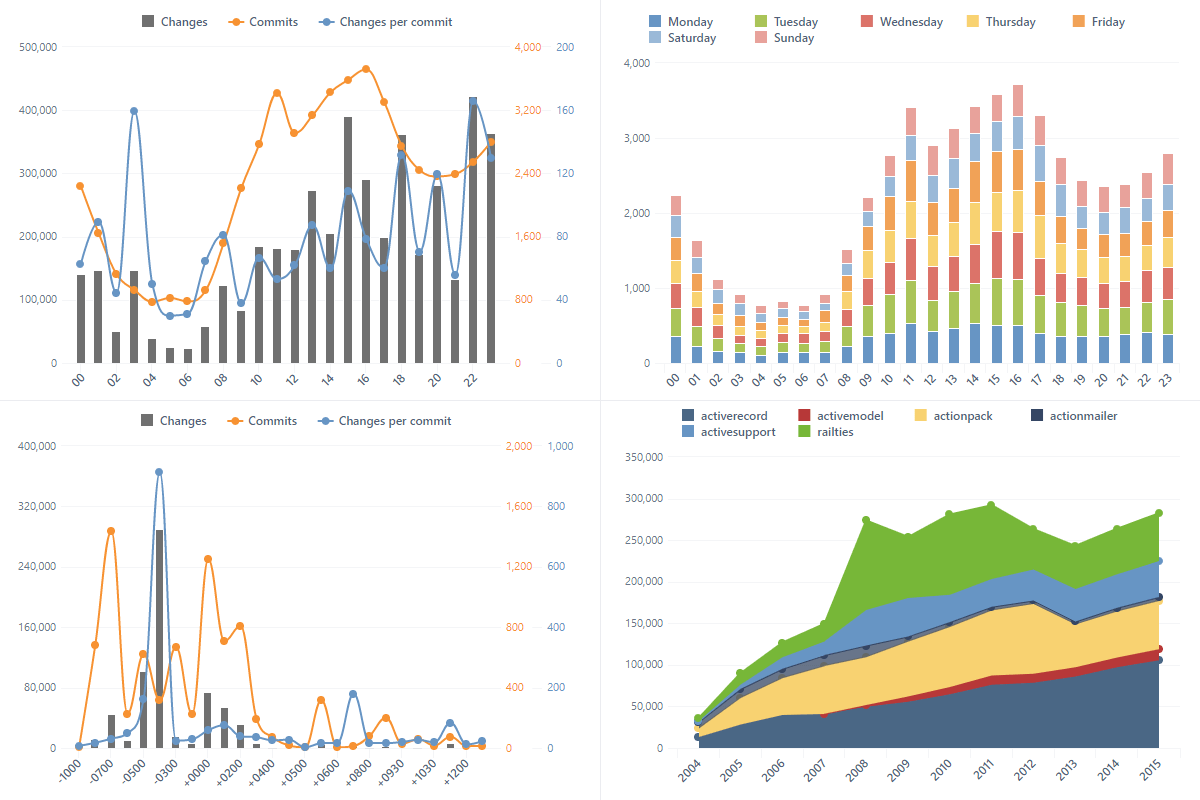
Git Commit Analysis – Main Components by Year
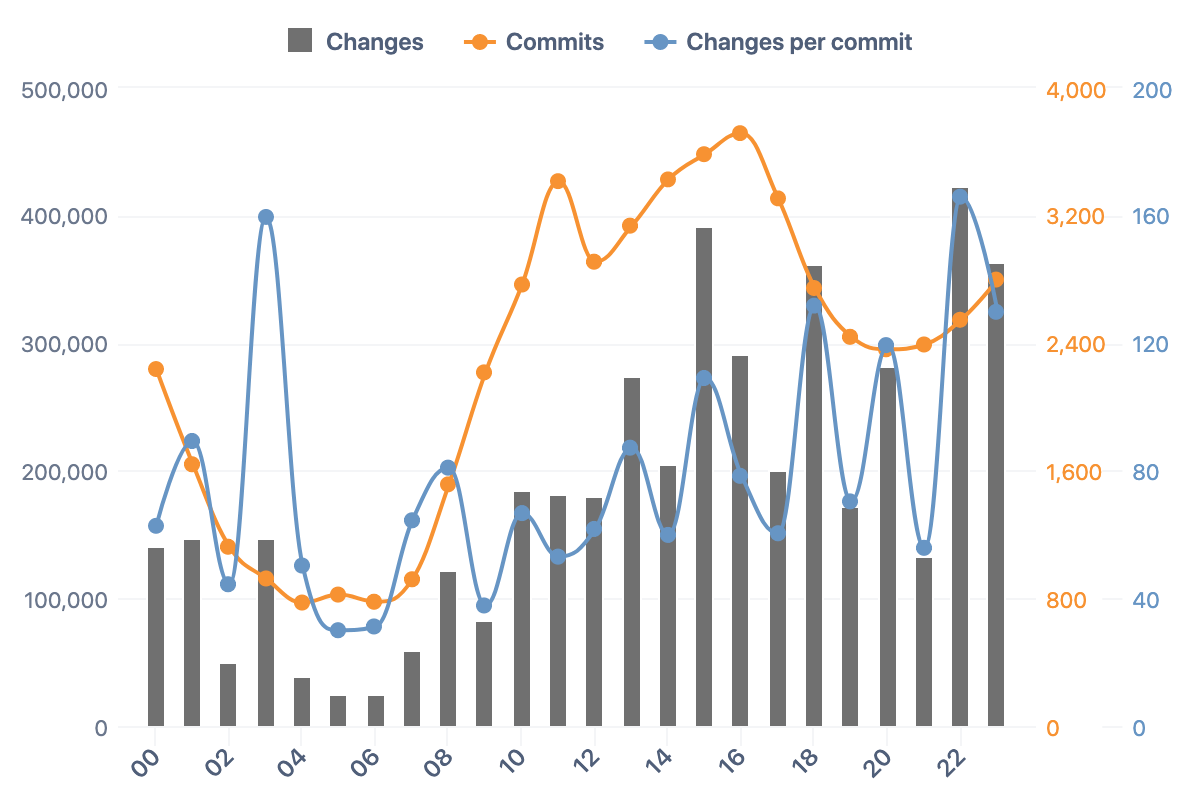
Git Commit Analysis – Hour of Day
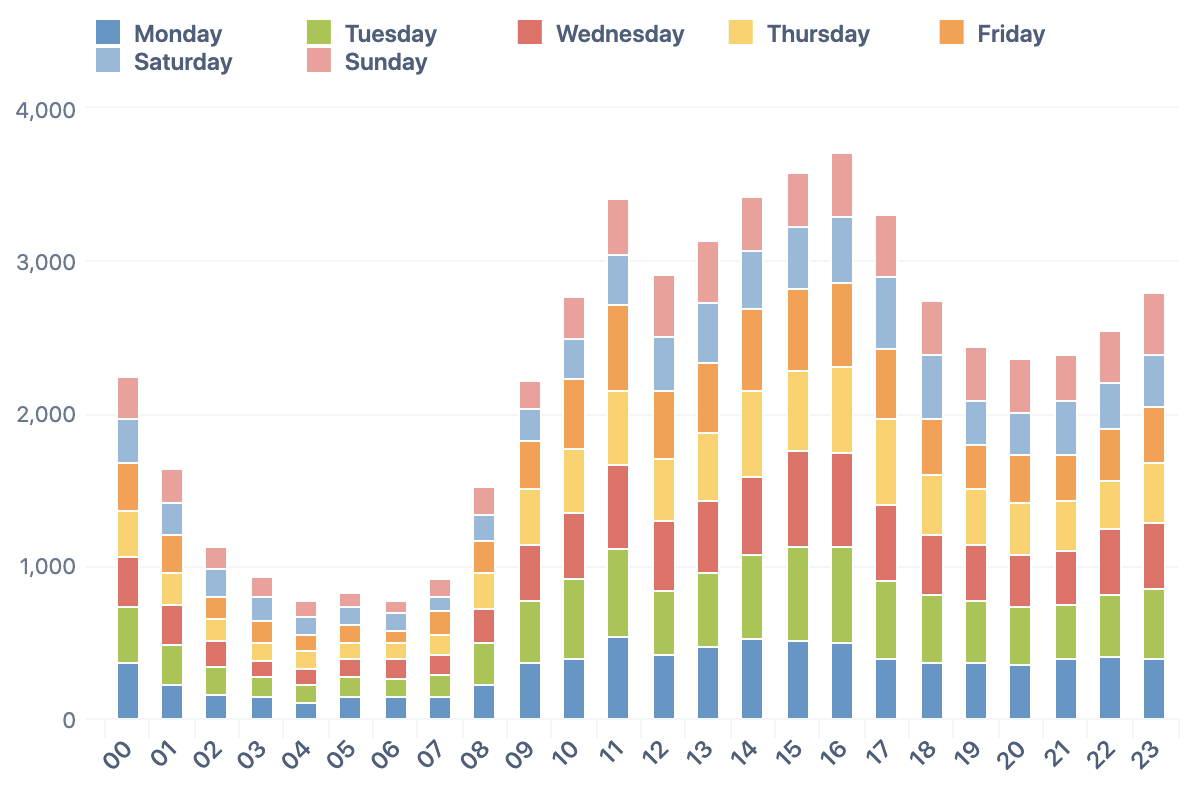
Git Commit Analysis – Week Day and Hour
Git Commit Analysis – Individual Contributions
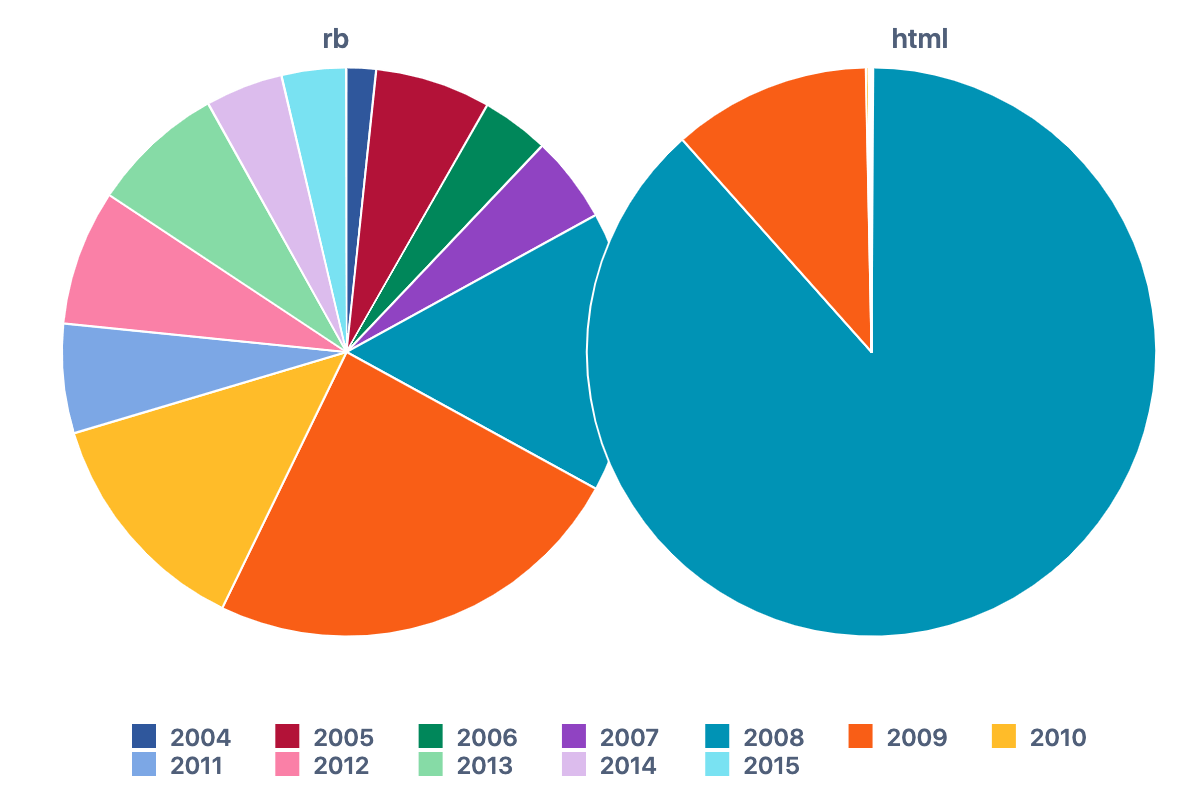
Git Commit Analysis – Top File Changes per Year
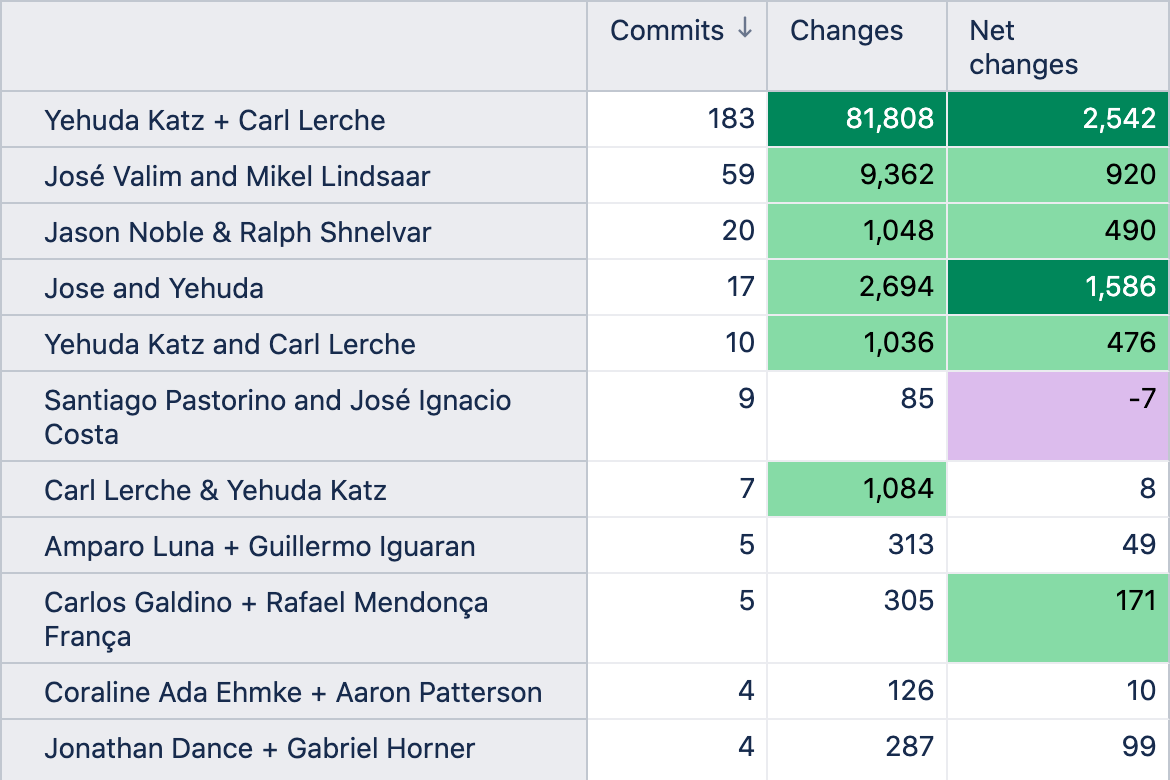
Git Commit Analysis – Most Active Pairs
Git Commit Analysis – Dashboard Example
Start a 30-day Free Trial
Try eazyBI free for 30 days to see if it's right for you. If you need any help or support, feel free to reach out to support@eazybi.com—we're there for you.


Questions, Feedback, Support, and Documentation
Please feel free to contact eazyBI support if you have any questions, feedback, or suggestions. We are always happy to hear from our clients.
For more detailed information on Git commit log analysis, please refer to eazyBI Git Commit Log Documentation.
