
Smarter Service Reporting at Worldline Baltics with eazyBI
At eazyBI Community Days, Valters Paiders from Worldline Baltics shared his team’s journey of improving customer service reporting with eazyBI.
Worldline operates in 45 countries, powering payment technology behind everyday transactions—whether you're tapping a card or paying with your phone. Valters works as a Quality and Card Scheme Compliance Manager and also manages the Jira instance for their Baltics teams, supporting 72 different business processes.
This story isn’t about polished best practices—it’s about what worked in real life, the mistakes along the way, and the lessons learned.
It Started with Customer Complaints
In 2012, Worldline Baltics started using Jira to manage customer service tickets. The process was simple—the customer service team logged tickets, solved what they could, and passed the rest to subject matter experts.
Few months later, customers started to complain. There were too many tickets in progress with no visible results. The customer service team knew about it—but most of these tickets were with other departments like IT, sales, or testing. It wasn’t a customer service problem anymore—it was a company-wide one.
To involve other teams, the company tried to align workflows. That quickly led to an idea of
using different issue types for different teams. It sounded reasonable, but caused more problems. People picked the wrong issue types, tickets went down the wrong workflows, and the data became unreliable. Eventually, those errors ended up in reports and influenced management decisions. At that point, no one could fully trust the data.
Finding the Right Starting Point
Valters recalled a talk from the very first eazyBI Community Days back in 2017, titled “Jira First, Reports Second”, where the key takeaway was that, if you want meaningful reports, you have to design Jira to capture the right data during the workflow—either manually or automatically.
At Worldline, this meant going back to basics. Most customer requests could be categorized by two things:
- Why did the customer reach out? For example, something isn’t working (an incident), or they need more information (a service request).
- How was the issue resolved? Did it involve other teams, cause changes to IT systems, or reveal a root cause?
This basic classification helped standardize the process and ensured they were capturing useful data right from the beginning.
Reporting Needs More Than Just Dashboards
Fixing the Jira workflows was a big step forward, but reporting still needed more. While Jira dashboards were fine for daily tracking, they weren’t enough to identify long-term trends or uncover blind spots.
In 2014, the company started looking for a proper reporting solution. The team explored three options—and chose eazyBI. Despite a learning curve with MDX, eazyBI stood out for its flexibility, powerful ETL features, and excellent support.
Setting Reporting Objectives
When building reports, Valters had an additional expectation – reports shown on dashboards or shared with customers must load in under five seconds.
To meet that goal, the team focused on two things:
- Carefully placing custom fields in the Jira workflow;
- Moving complex MDX calculations to the ETL stage using JavaScript-calculated custom fields.
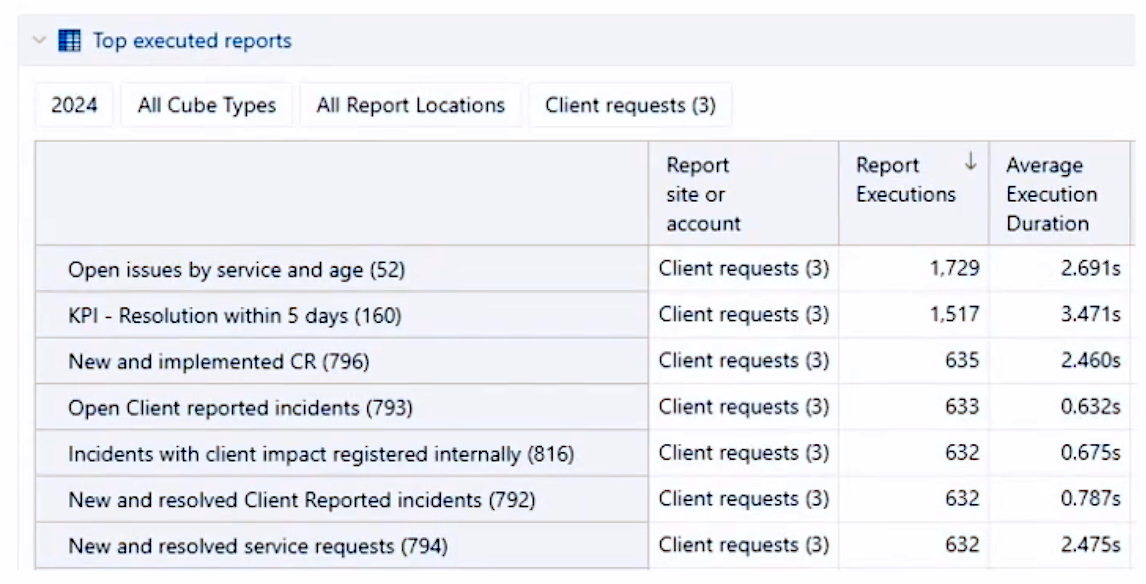
- Performance mattered, and eazyBI’s built-in usage statistics helped them track it.
What Averages Don’t Tell You
Averages are often used to measure team performance—but they don’t always tell the full story.
Valters shared an example of how relying on averages alone can lead to the wrong conclusions.
They were comparing two support teams with similar sizes, workloads, and ticket types.
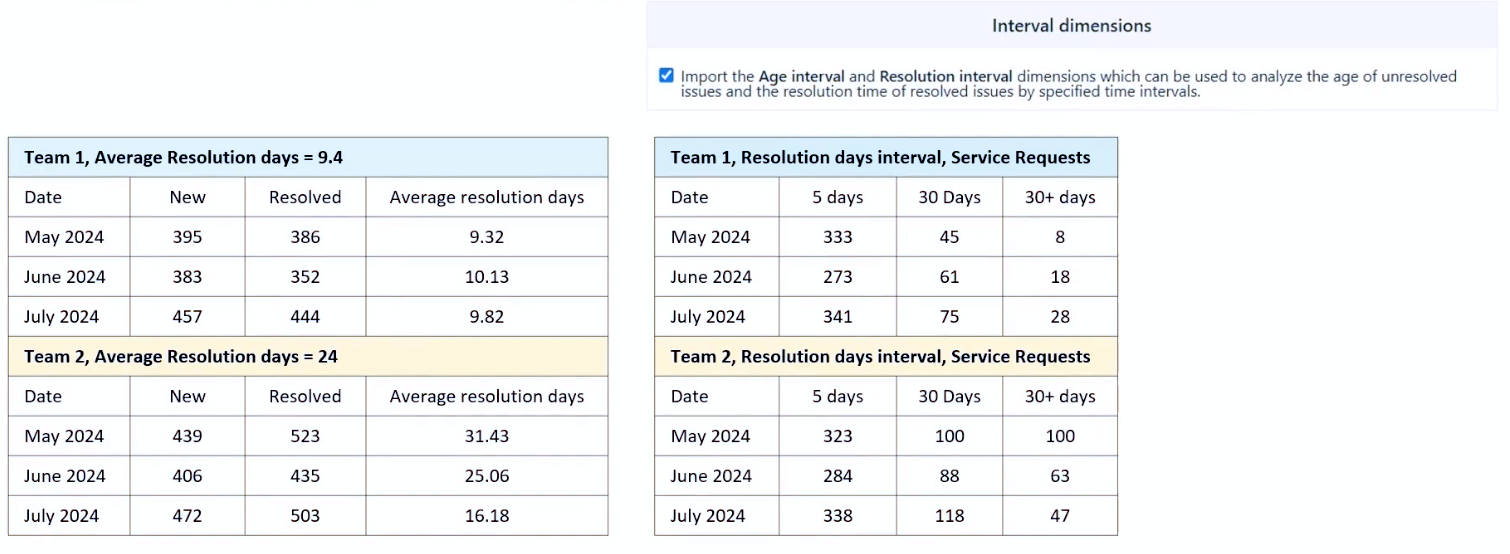
On paper, Team 1 resolved tickets in 9.4 days, while Team 2 took 24 days. At first glance, Team 1 seemed far more efficient. But once they added eazyBI’s interval dimension, it turned out both teams resolved most tickets quickly.
The difference was that Team 2 was actively working on long-standing, older tickets, which pushed up their average resolution time. Team 1 wasn’t tackling these tickets at all.
Another report, Issues Due Over Age Interval, showed that Team 2 had worked hard to reduce a large backlog—while Team 1 was heading toward the same issue of unresolved tickets piling up.
Using Customization to Drive Action
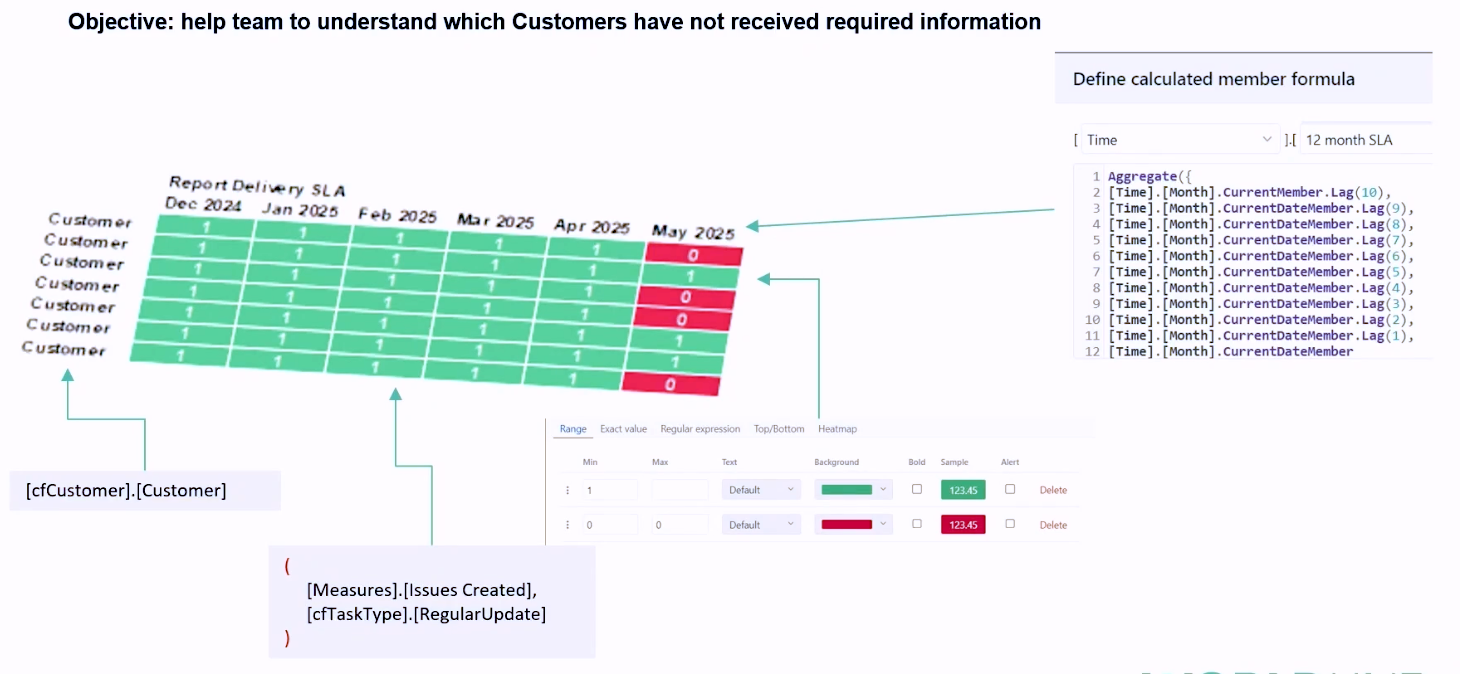
Valters also showed how customization helped the team take preventive action. He built a report that flagged customers who may not have received all the information they should. Report combines customer names, time frames, and a custom field. If a zero appeared in the report, it meant follow-up was needed—often before a potential SLA breach.
Sharing Reports the Right Way
One of the biggest wins came from sharing common dashboards across teams.
Everyone saw the same numbers. Management and support teams used the same reports, which built trust and improved consistency.
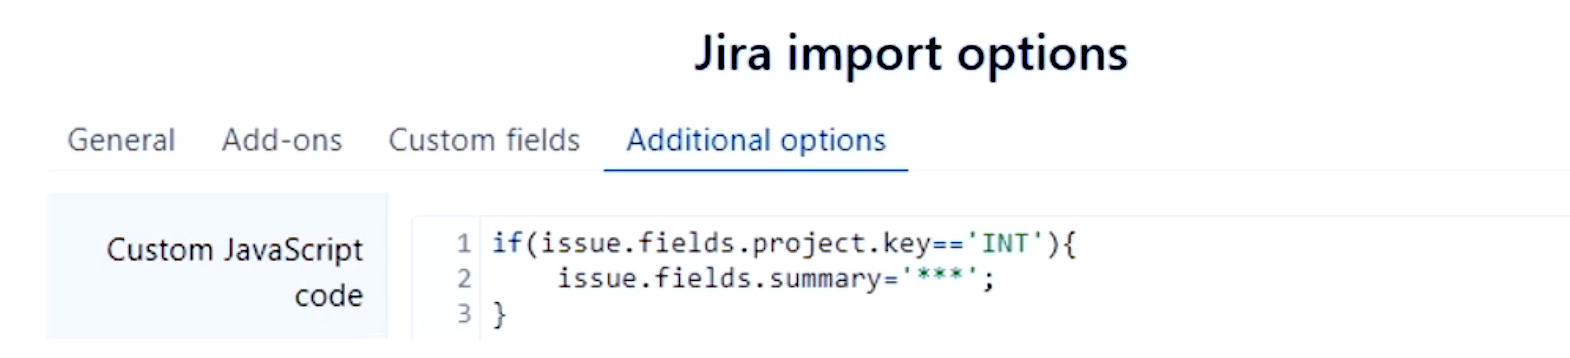
In some cases, they also shared reports with customers. To do that safely, they created separate eazyBI accounts for each customer and used JavaScript in Jira import options to hide or replace any sensitive data during import.
Customer Service Is a Company-Wide Effort
For Valters, the biggest lesson was clear: Customer service isn’t just the job of the support team—it’s a company-wide responsibility.
What worked for Worldline:
- Start by designing Jira workflows that reflect the business process and capture key metadata
- Don’t rely on averages alone—time-based reports often give a clearer picture
- Use centralized dashboards to align teams and management
- When sharing with customers, use separate accounts and define what data stays private
Watch the Full Presentation
Full Worldline case study, with all the visuals and detailed explanations, is available in the presentation recording.