

Adaptavist Test Management Reporting Using eazyBI
Atlassian provides a powerful ecosystem of project management and collaboration tools. Many of those tools complement each other, delivering benefits far beyond each separate tool alone.
A good example of complementary tools are tools for testing and data analysis.
Being a business intelligence, analysis, and visualization tool, eazyBI has created integrations with several test management tools. eazyBI extends and adds value in the form of advanced reporting at all levels of project management and testing management.
Introducing our most recent integration with Adaptavist Test Management for Jira Server.

Update: Adaptavis Test Management has jointed the SmartBear company and is now known as Test Management for Jira
You can learn more about Test Management for Jira (TM4J) integration and available pre-calculated measures in eazyBI documentation page.
Test Management for Jira is the highest rated QA & Test Management add-on for Jira. It is a full-featured test management solution, helping you to coordinate all testing activities including test planning, authoring, execution, tracking, and reporting. It also supports REST API integration with test automation tools to import test results in Jira. With Adaptavist Test Management for Jira you can:
- Organize large test-case libraries using folders and test suites
- Create test runs to track testing cycles
- Use test cases from multiple projects for a test cycle
- Group test runs into test plans for higher level reporting
- Report on test execution status and traceability
- Assign tests to individual testers and environments
- Administer your projects with granular permissions for test activities
- Add custom fields
- Import and export XLS and XML data
Why Would You Need Custom Test Management Reports?
Testing management tools are perfectly suited to perform daily tasks such as creating manual and automatic test cases, managing test steps and expected results, planning test runs, recording test execution results, reporting bugs from tests and tracing them back to the cause, or linking tests to requirements. Most test management add-ons also have their own built-in reports. Those reports are good for a general information overview such as a list of assigned tests, progress and status of a particular test cycle, a list of tests assigned for release (version), and so on. This is often enough to get your job done, but there is much more you could do with your data.
Very often testing is the last stage of the development cycle—right before delivery. At that point, there are many questions regarding the progress of the project, coming from testing managers, development managers, project managers, and stakeholders. For example:
- Is a particular feature completed—developed, tested, and debugged?
- Can we release a version to our customers?
- What is included in the next planned release?
- How much time does it take to test new features in pre-production environment?
- Is the new version of product better than the previous?
- Are our automated tests working/performing?
When trying to answer these questions, you need clear data; a general overview will not suffice. Eventually you’ll need something more powerful.
This is Where eazyBI Can Help

Data analysis is a complex process. eazyBI can provide the missing context and give you tools to look at your data from many different perspectives. You can create custom reports based on your test management data to highlight trends and quickly identify and locate testing issues, bugs, or possible improvements and threats.
In this article, I’ll try to illustrate some ideas of using eazyBI together with Test Management for Jira.
Getting Started With Some Report Examples
When your import your Adaptavis Test Management data, you will see a new sample report folder called “Samples ATM,” containing several Adaptavist Test Management sample reports.
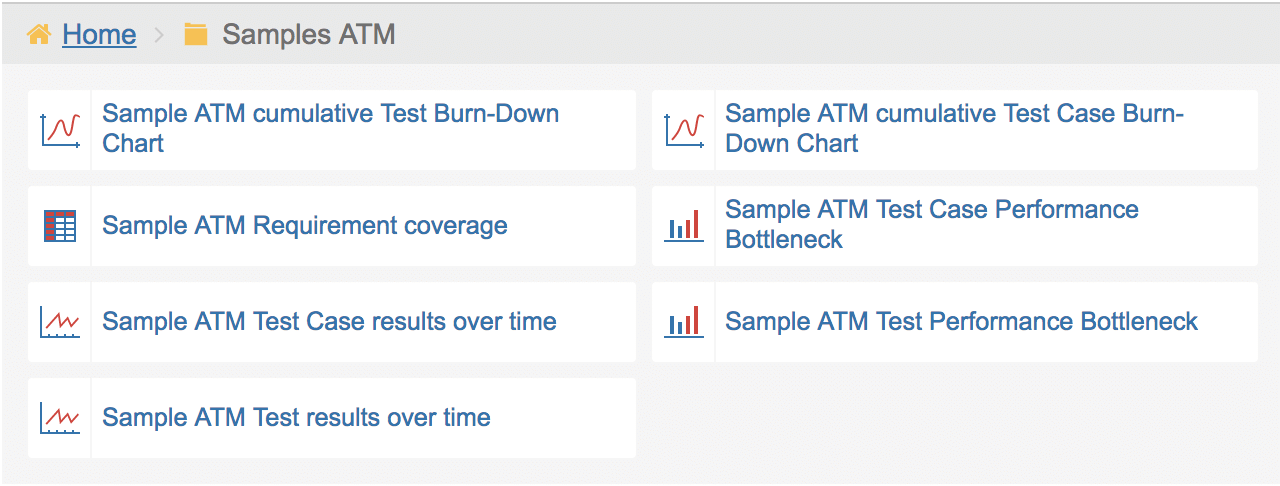
This is a good place to start. Let's review some of these examples.
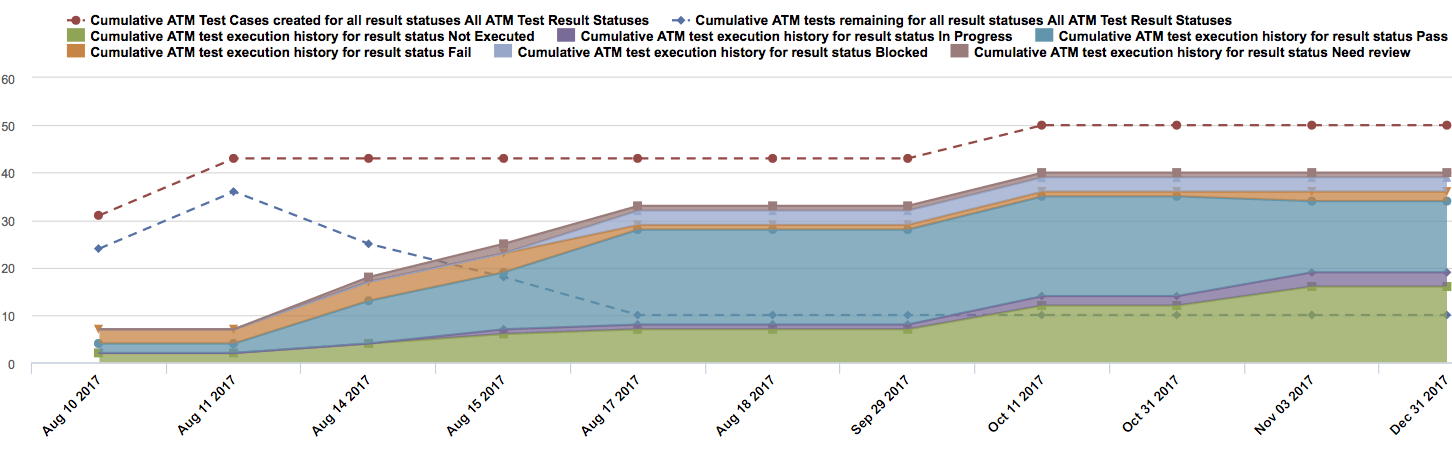
Example 1: Cumulative Test Case Burn-Down Chart
A cumulative test case burn-down chart will give you a high-level overview of all your test cases by their result statuses in time: all test cases, remaining tests, not executed, in progress, pass, fail, and blocked tests.
This chart can be very useful for analyzing the progress of your Test Plan to see how it evolves over time. It is a great way to spot issues more easily, make better project forecasting, and see whether or not the testing goes according to schedule.
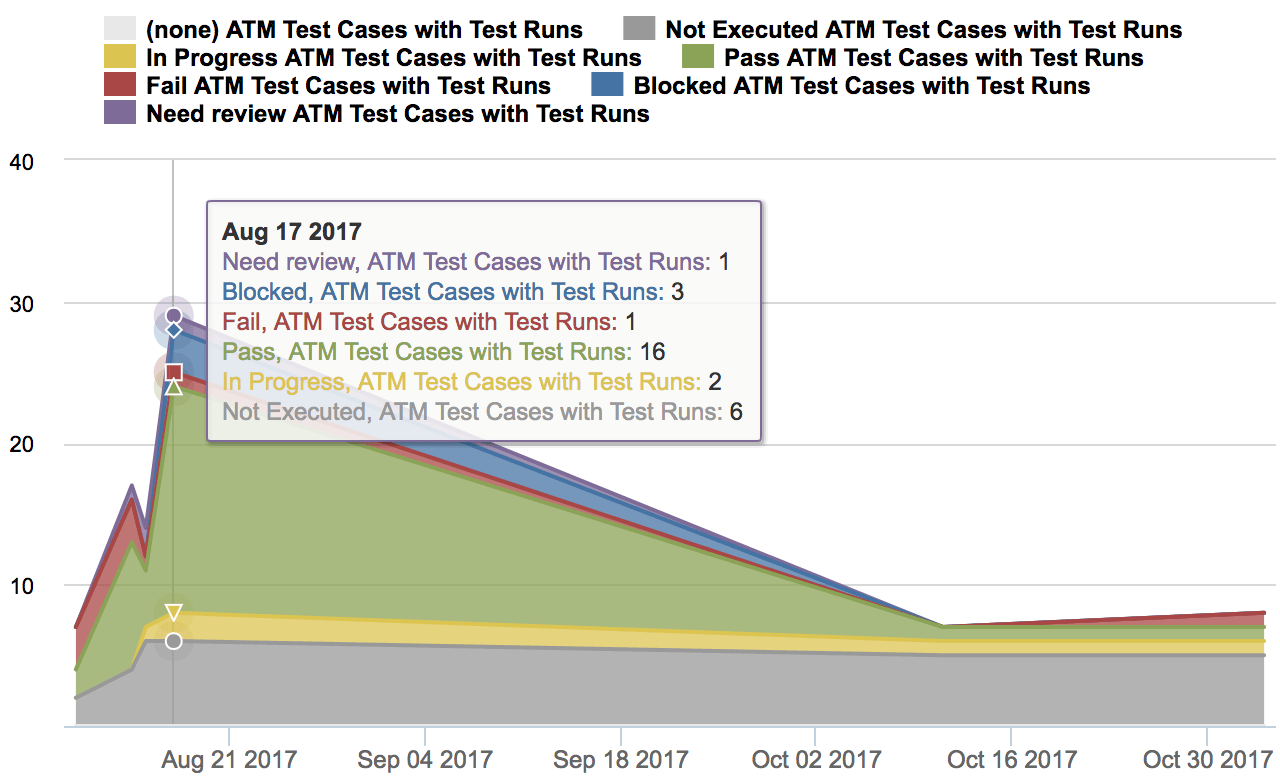
Example 2: Test Case Results Over Time
Alternatively, you might want to see non-cumulative test executions by statuses by day. This will give you an overview of your daily test execution activities and your test distribution by test statuses (not executed, in progress, pass, fail, blocked).
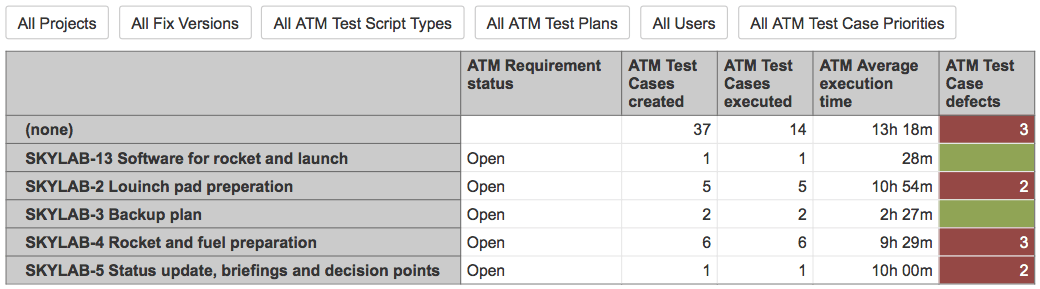
Example 3: Test Requirement Coverage
In addition to looking at executed tests and their completion statuses, there are additional aspects to testing.
You might want to take a look at your list of requirements that your tests should cover. And better yet:
- see how many test cases are created and executed for every requirement,
- estimate how long it takes to execute those tests (on average), and
- quickly check whether or not these tests reveal some defects.
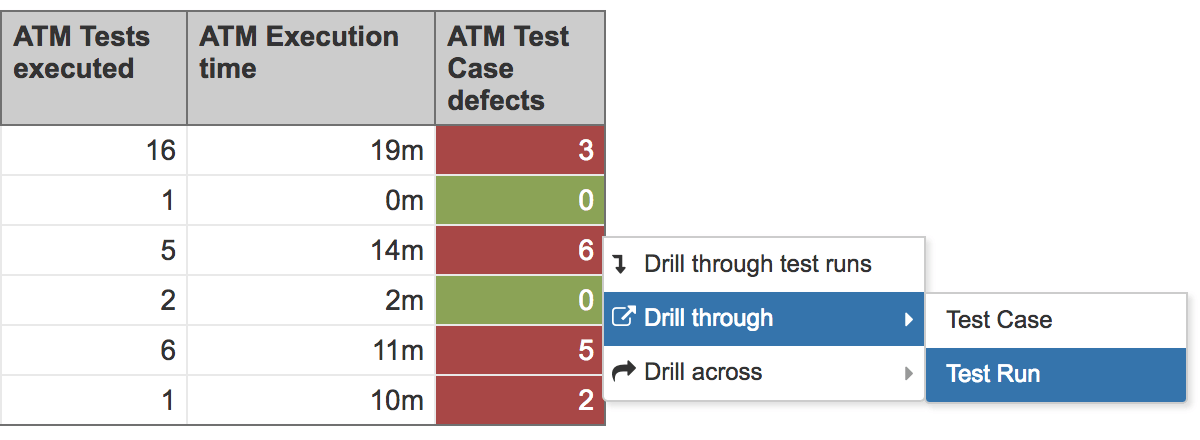
This simple test requirement coverage report does all of that. Use it as your starting point to identify slow performing tests, cases with most defects, or unexecuted test cases
- If there is only one test covering a requirement, you might want to define that requirement more thoroughly.
- If you have many test cases, but you haven’t run all of them, you should ask yourself why.
- If a test cycle returns many defects, it is worth looking into to understand the cause or to change development priorities.
- If you want to release a certain requirement, obtain an estimate on how long it might take to test it.
- If something jumps out of those charts, use the interactive “Drill through” feature to drill into more details and find the cause.
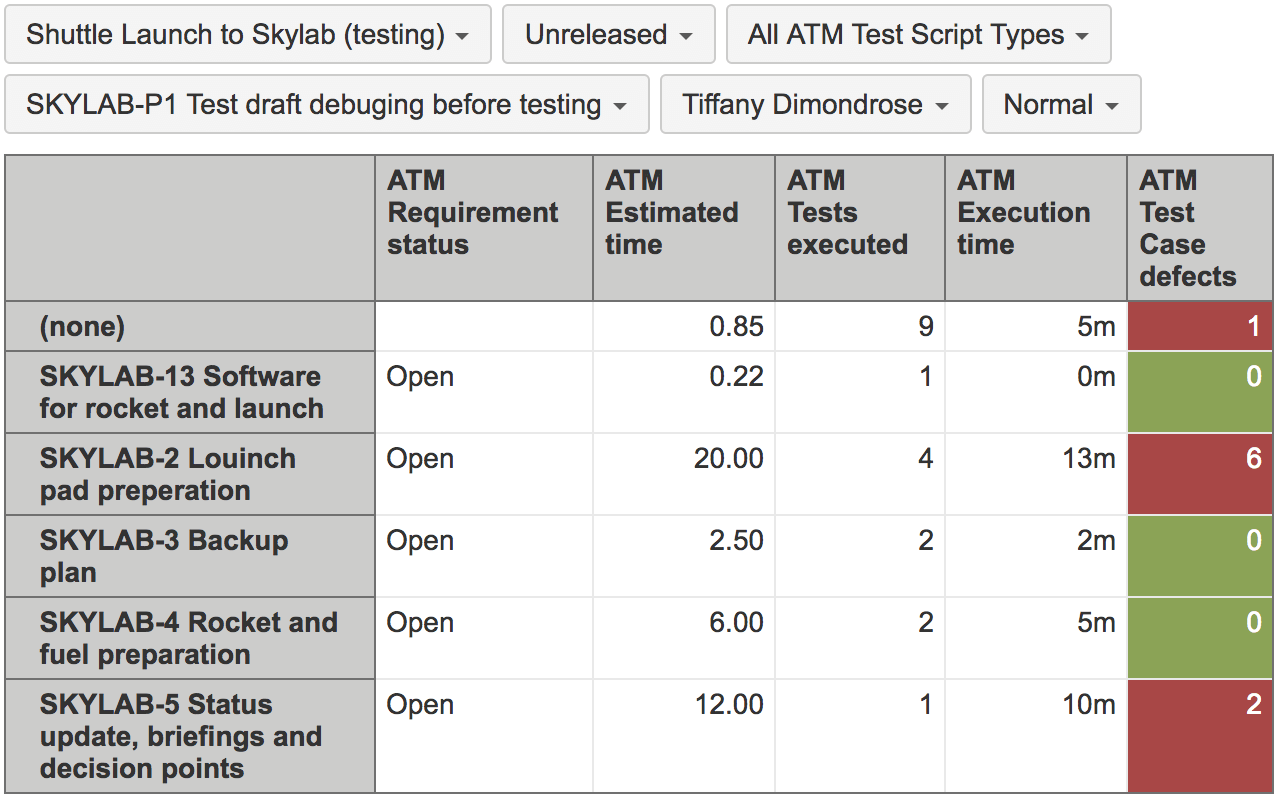
Another way for you to analyze almost any report in eazyBI is with page filters. When you drop a dimension in the “Pages” section, those dimensions will appear as drop-down filters in reports. Then you’ll be able to select one or several members of each dimension and narrow down your report to the specific level of your interest.
In the example below I’ve selected the “Shuttle Launch to Skylab” project and all “Unreleased” fix versions, SKYLAB-P1 Test Plan, etc. I could just as well have narrowed it down by Test Plan, User, Priority, Script Type, or Time — you name it.
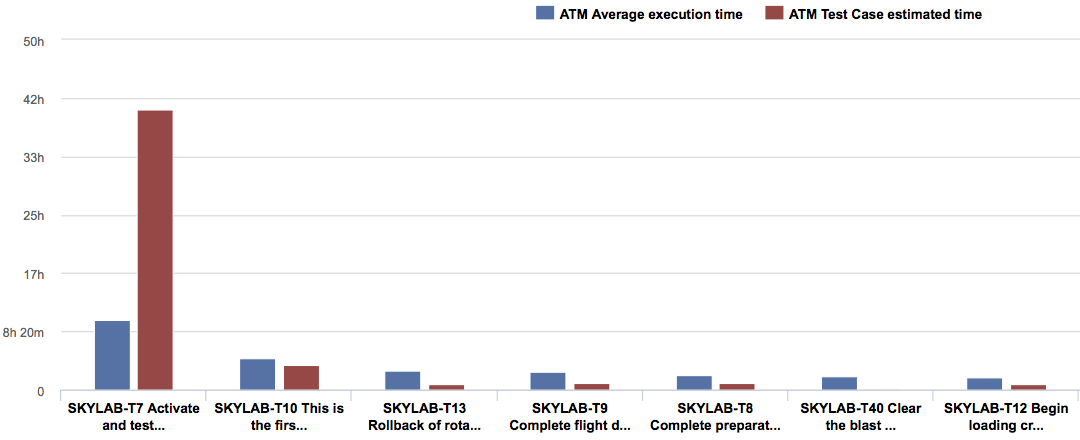
Example 4: Test Case Performance Bottlenecks
Some reports can also reveal your top or bottom performers, threats, opportunities, or outliers. Most of the time, when something is clearly above or below the average level, it is an indication of an issue. For example, if we would list all Test Case time estimations and compare those with actual average execution time, you would quickly identify:
- Slow tests
- Over-estimated tests
- Under-estimated tests
If a test cycle takes an unreasonably long or unreasonably short time to execute, perhaps there is something wrong. Can it be improved? Should you make better time estimates?
With this insight, you can drill into details and find out what caused the result. Happy hunting! =)
How to Import Test Management Data into eazyBI?
The Adaptavist Test Management (ATM) data import is supported on Jira Server instances, starting from the eazyBI version 4.4.0 (released on Nov 3, 2017). Adaptavist Test Management is currently not supported on Jira Cloud.
Step 1: Create an Account and Connect to Jira
Let’s start with a clean sheet by creating a new eazyBI account in Jira.
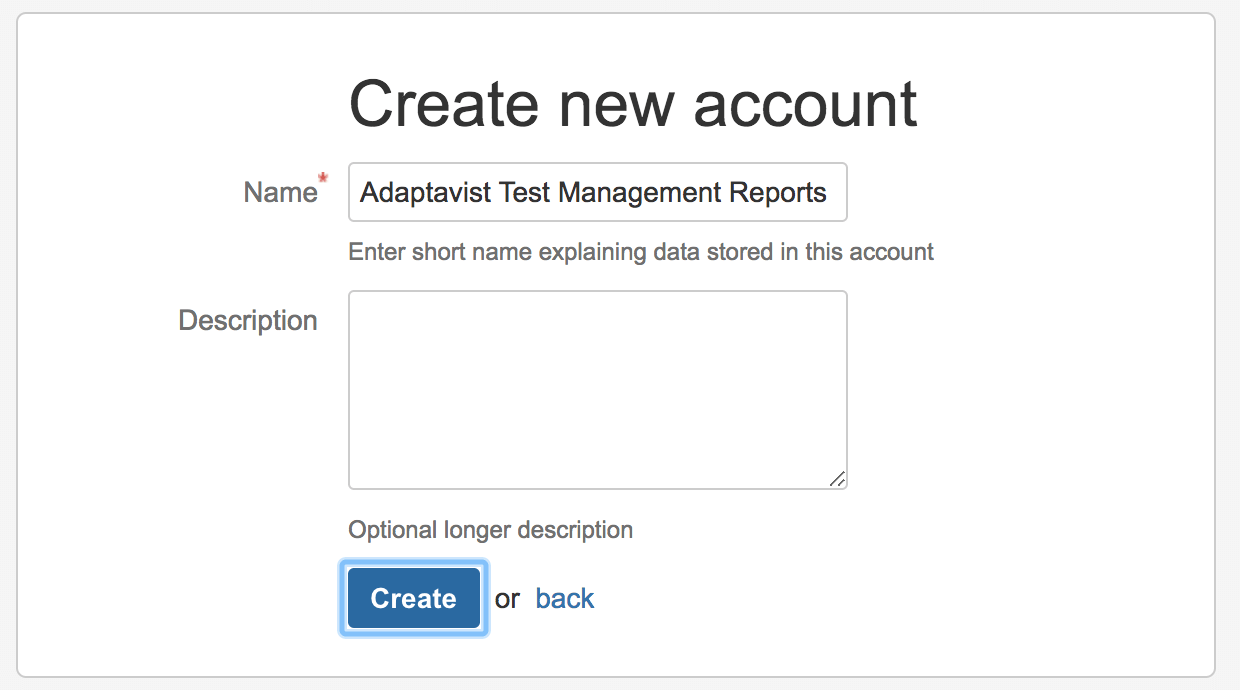
Creating separate accounts by project, reporting goal, or area is always recommended, as this keeps accounts clean, focused, easy to navigate, and compact. Smaller accounts also make reports and dashboards run faster.
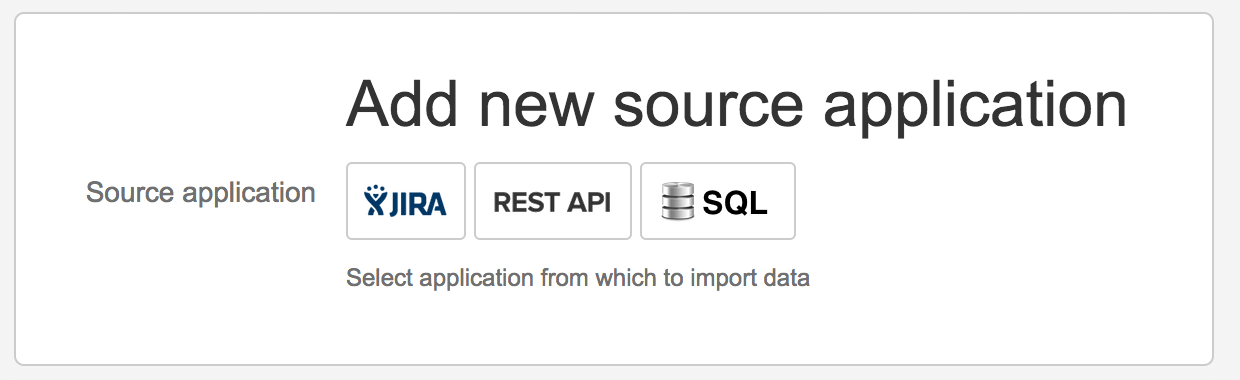
Because Adaptavist Test Management is a Jira-based add-on, let's add Jira as your source application.
Step 2: Import Your Projects, Test Results, and Samples
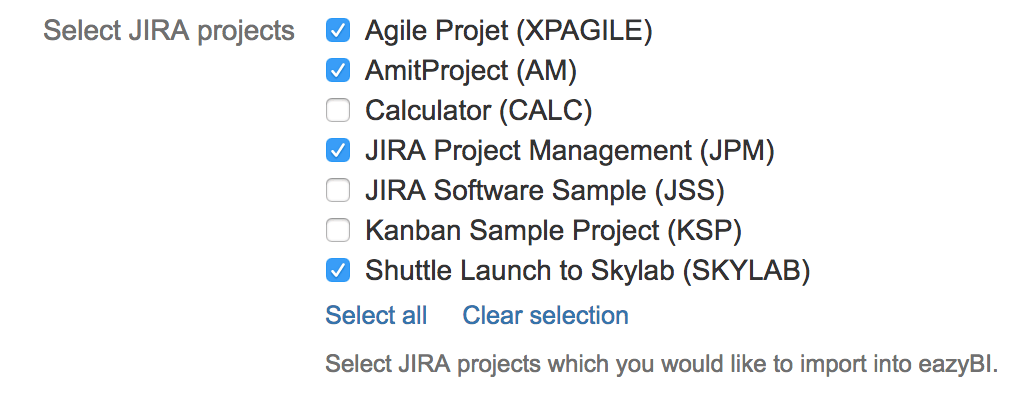
Select those projects which have test management data associated with them.
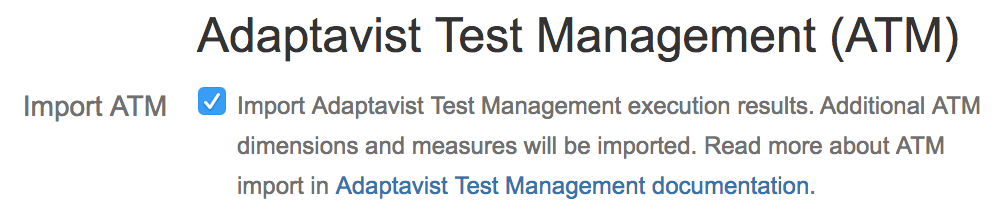
If you have installed Adaptavist Test Management for Jira Server, then, in Jira import options, you will see the Import Adaptavist Test Management (ATM) option.
If you want eazyBI to create a few sample reports, we recommend checking the “Import sample reports” option.

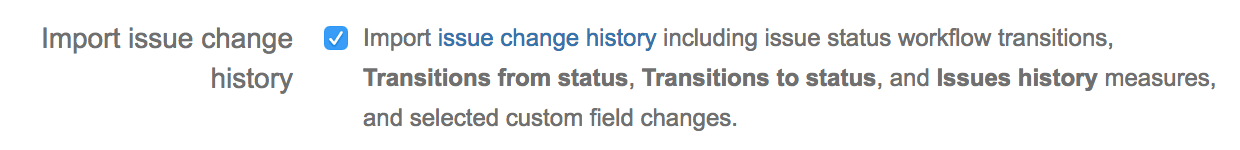
If you want to see how things evolve over time and how issues transition from one status to another, we also recommend importing “issue change history.”
What ATM Data Will Be Imported?
If you want to get the maximum out of Adaptavist test reports and eazyBI, it's usefull to know what data is available to you. Dimensions, measures, calculated measures – it's easy to get confused. Let's cover some basic terms:
Dimensions are the building blocks of data cubes. They can have children and can be organized in multilevel hierarchies. Dimensions help you slice your data based on dimension members. For example the Time dimension has Year, Quarter, Month, Week, and Day members.
Measures are the "meat" of the cube. A measure can be any number, like Tests Created, Test Run, Tests Executed, etc.
Calculated Measures are additional measures that you can add using mathematical expressions.
ATM Dimensions
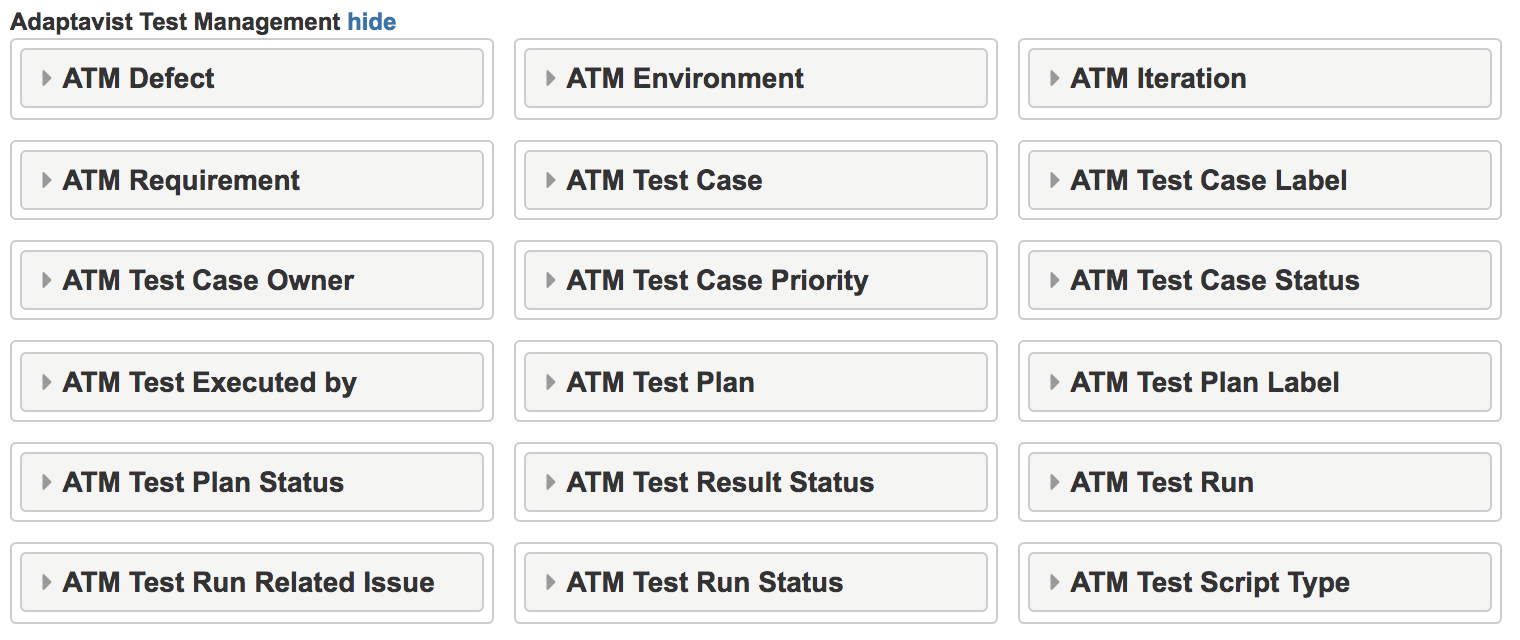
When importing Adaptavist Test Management data, eazyBI takes into account Adaptavist Test Management structure, to create a data model that reflects the same structure, hierarchy, and relationships. On import, eazyBI will automatically create 17 new Adaptavist Test Management dimensions including defect, environment, iteration, requirement, test case, test run, test plan, and other. You can group, aggregate, visualize, and analyze your data based on these dimensions.
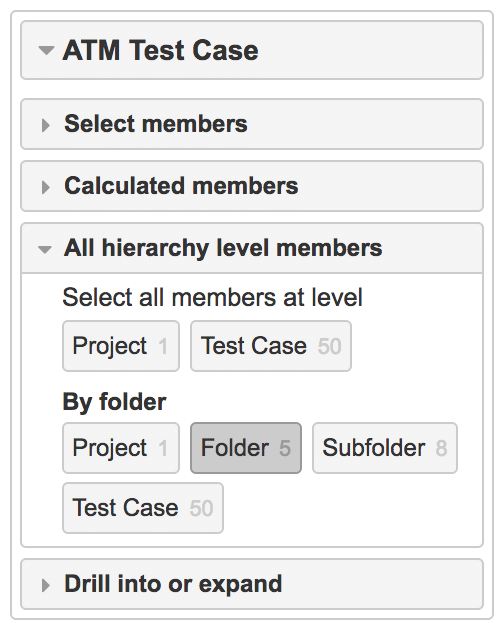
ATM Dimension Hierarchies
eazyBI will hierarchically organize Test Cases, Test Results, Test Runs, and Test Plans by Jira Projects or by Adaptavist Test Management folder structure. This allows you to neatly organize your tests in folders and then see the same structure in your reports.
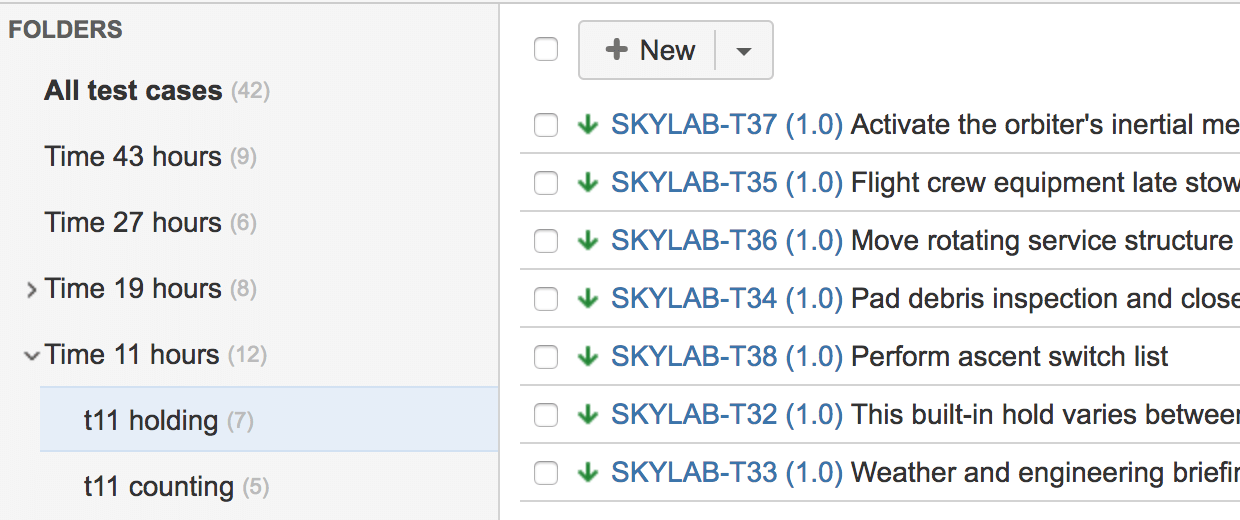
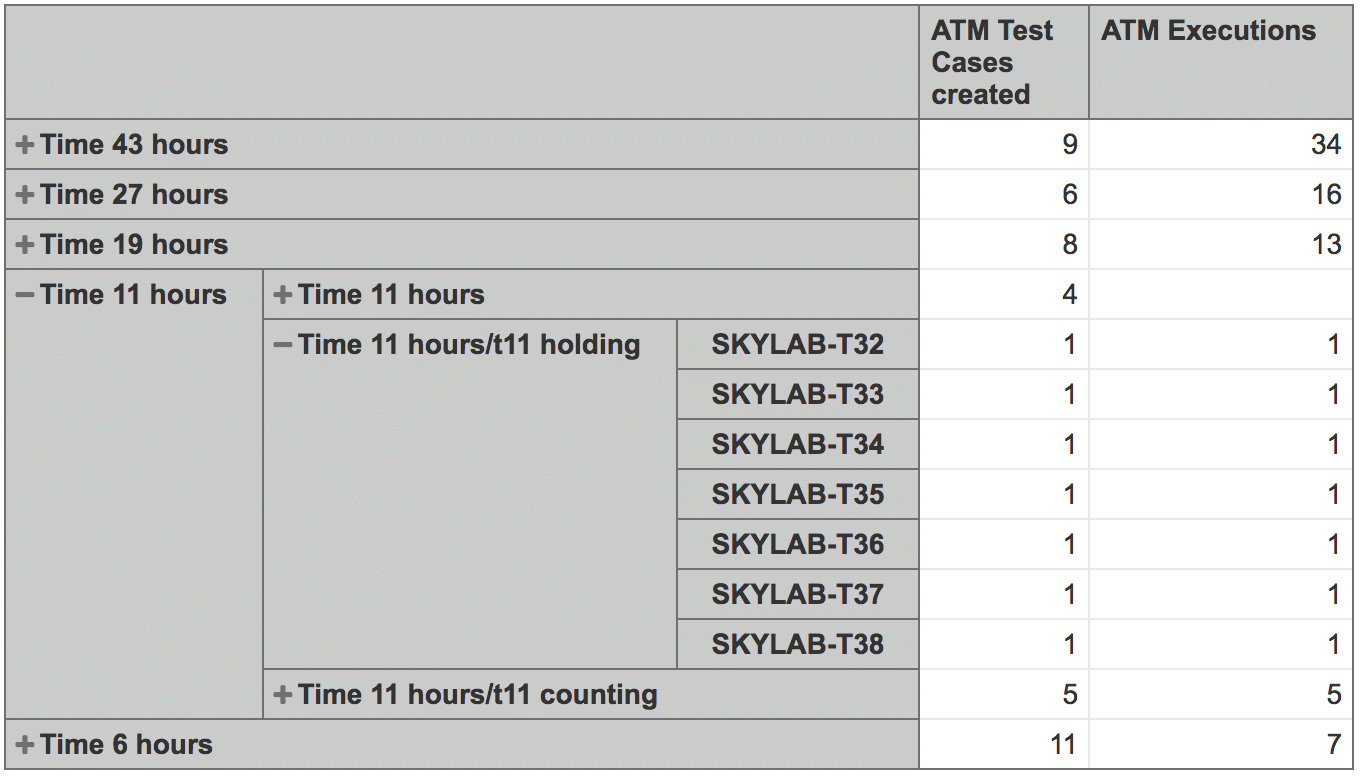
As you can see in the report below, it is the same Folder / Subfolder / Test structure as in your Adaptavist Test Management tests page in Jira.
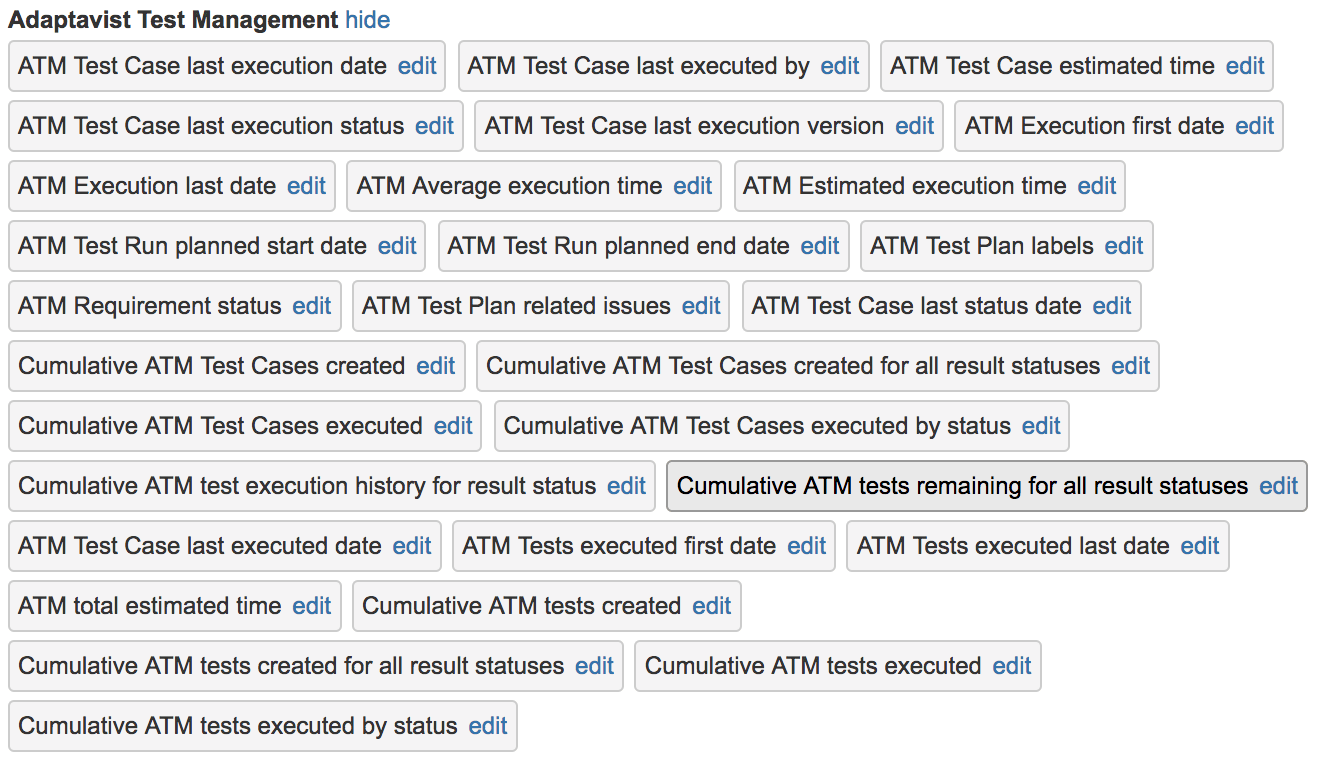
ATM Measures
eazyBI will also create and import 15 test management measures such as created, run, executed, or scheduled tests, as well as registered defects and test execution time.
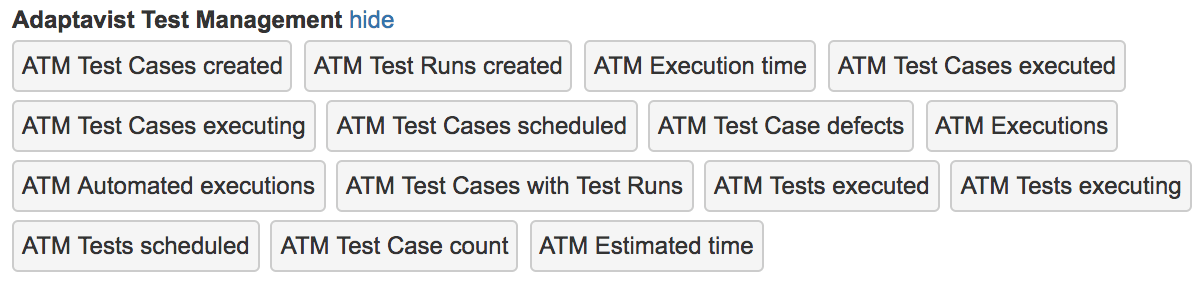
In addition, eazyBI will create about 30 custom calculated measures, greatly extending a set of tools you can use in your reports.
About the author

Before joining eazyBI, in her previous career, Zane worked as a testing manager, QA process manager, and a testing engineer. In some projects they used Jira for quality assurance processes. To create reports and analyze testing data, everything was exported to Excel before creating reports. Now she’s happy to share how eazyBI can be used to create advanced custom reports more efficiently.