
Descriptive, Predictive, Prescriptive Analytics with eazyBI
At eazyBI Community Days, Dace Kvalberga from flex.bi shared a forward-looking perspective on dashboard – focused not only on understanding the past, but also on making better decisions for the future.
While many businesses still only focus on historical data analysis, the real value comes when data becomes a tool for planning, improving, and guiding action. That’s where dashboards can evolve – from simply showing what happened to helping teams see what’s coming and decide what to do next.
Helping Visionaries Turn Ideas into Action
Dace works closely with business owners who are often big-picture thinkers – focused on where things are headed. Her role is to translate those abstract goals into practical dashboards that support decisions.
One playful example came from a recent event in Japan, where the flex.bi team created a themed dashboard for a sushi café. This small delivery-only business faced two typical problems:
- How to earn more during limited working hours (Monday – Friday, 9 a.m. to 5 p.m.)?
- How to staff more efficiently to keep up with changing demand?
That scenario became a way to explore three levels of analytics – descriptive, predictive, and prescriptive – and how each one contributes to better decision-making.
Descriptive Analytics: What’s Happening Now?
The first step was using descriptive analytics to understand what’s going on:
- Sales by location and item type;
- Order volume and delivery speed;
- Average order value;
- Customer breakdown by area.
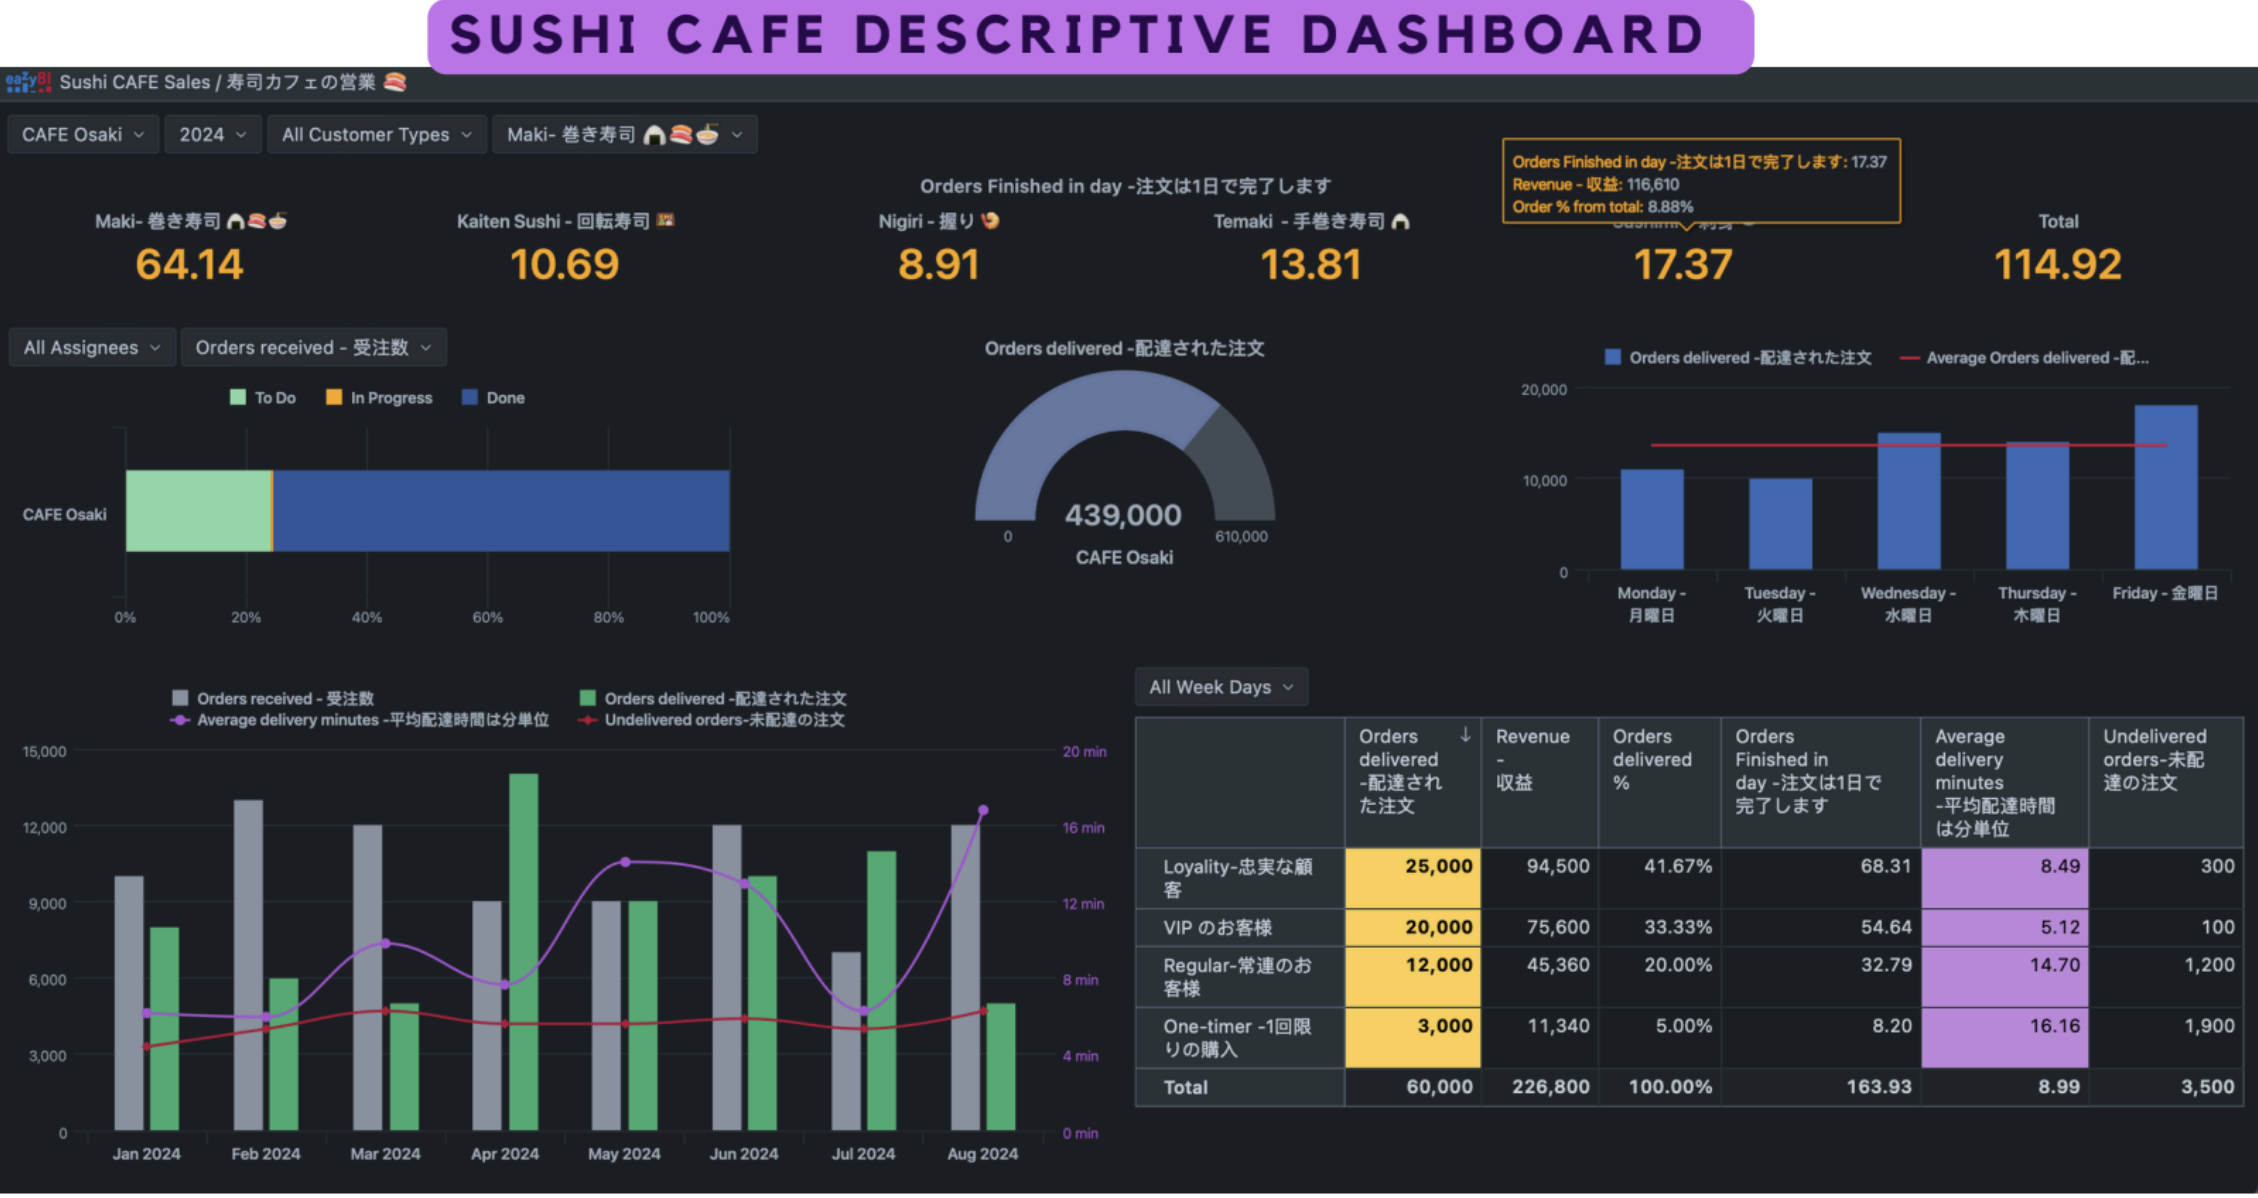
While simple, this type of dashboard gives everyone a common view of business performance. Even small visual touches – like sushi-type emojis – can make it more intuitive, especially in cultures like Japan’s, where playful design is part of the user experience.
Predictive Analytics: What Might Happen?
Moving beyond the current snapshot, predictive analytics helps estimate what could happen next. For the sushi café, this meant:
- Sales forecasts based on current performance;
- "What if" scenarios;
- Trends by day or item, showing when to promote certain products.
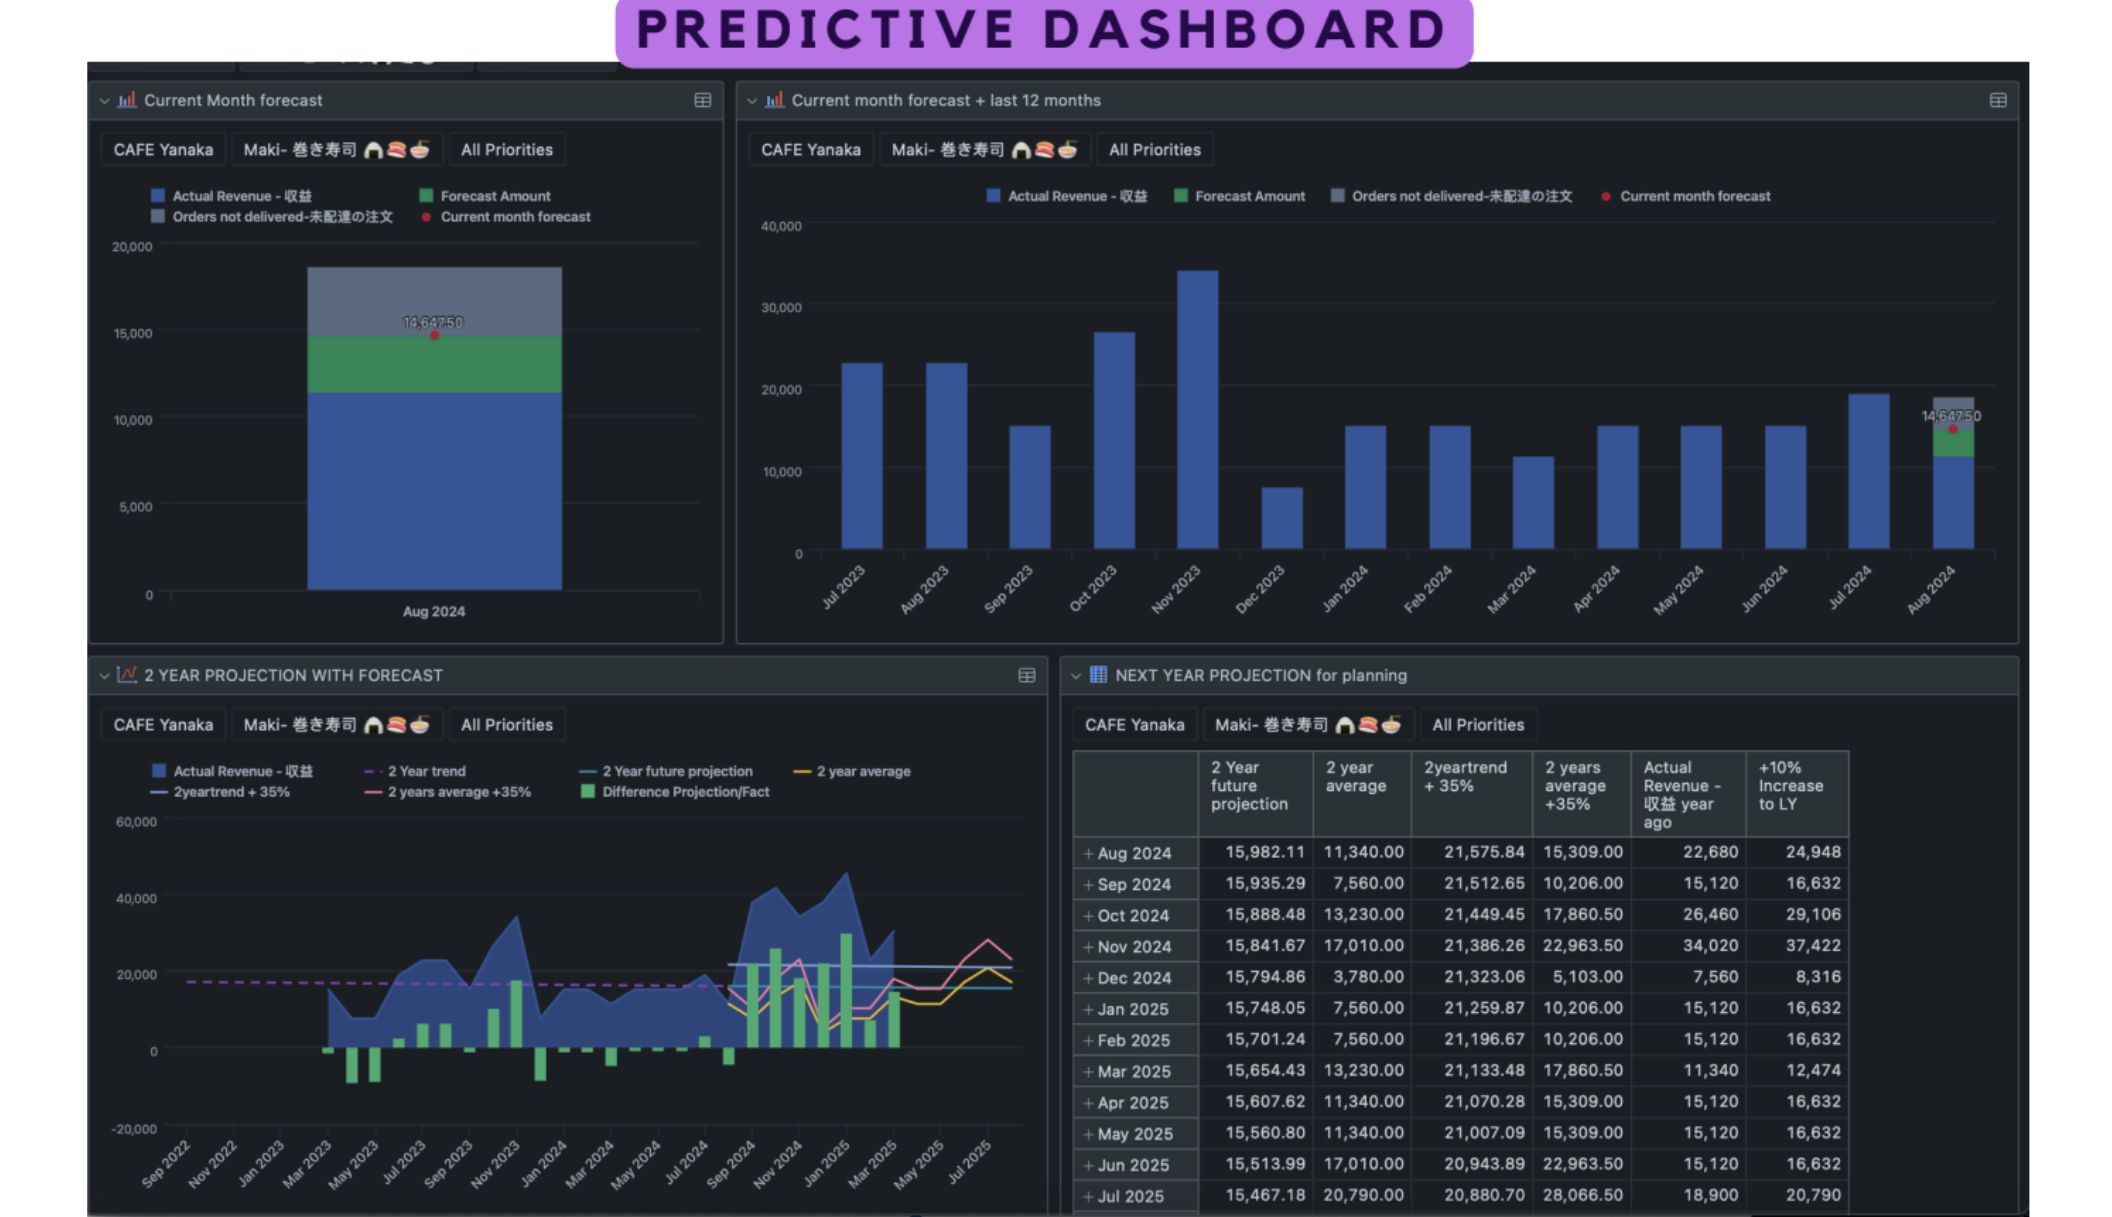
These insights make it easier to plan budgets, set goals, and adjust offerings based on expected demand. Even simple ratios – like revenue per item or delivery efficiency – can help teams focus on what really drives results.
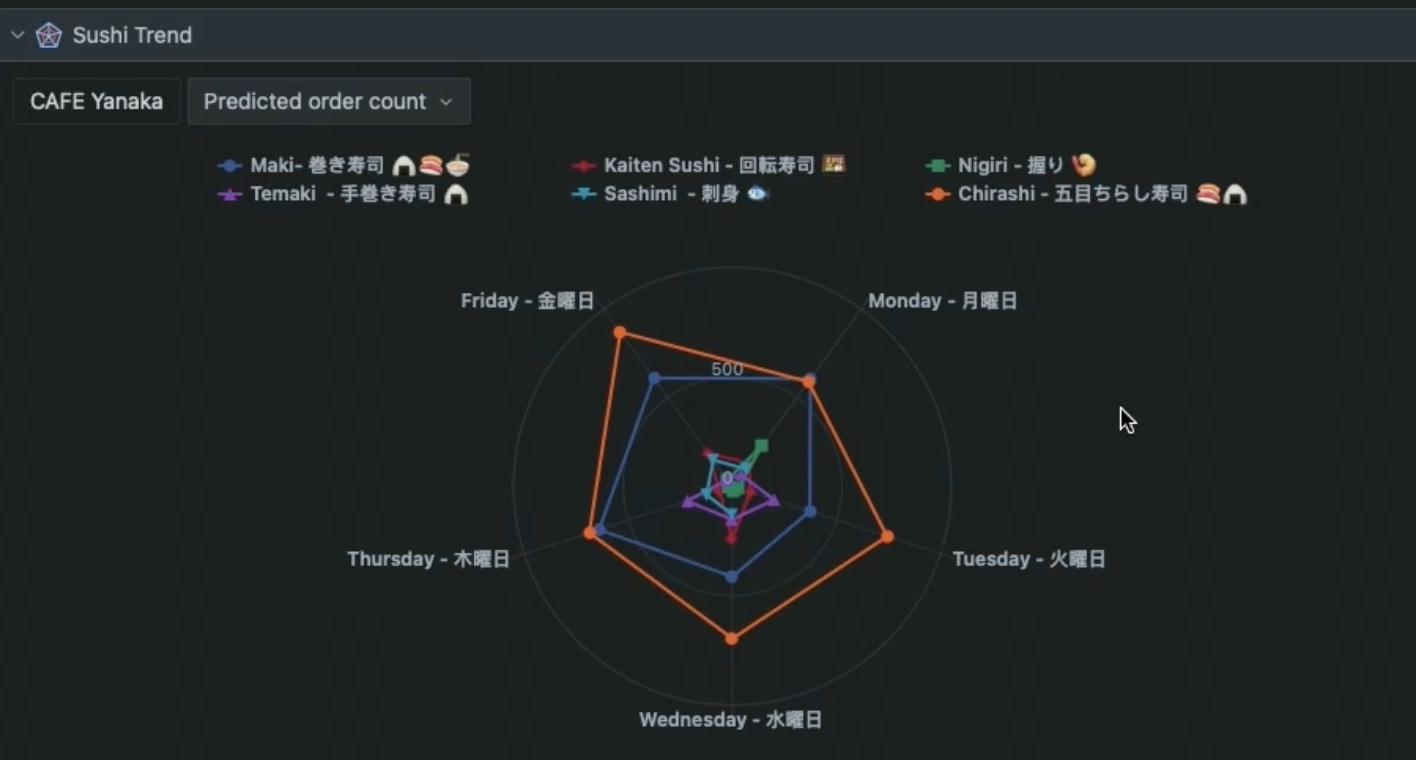
A radar chart was used to visualize sushi type sales across weekdays, making it easy to spot which items performed best on specific days and where targeted promotions might help boost underperforming products.
Prescriptive Analytics: What Should We Do?
The final level, prescriptive analytics, turns insights into actionable suggestions:
- Worker shift planning based on order volumes and staff capacity;
- Menu optimization to recommend products that should be promoted on specific days;
- Inventory recommendations to prepare for demand;
- Dynamic pricing ideas based on performance trends.
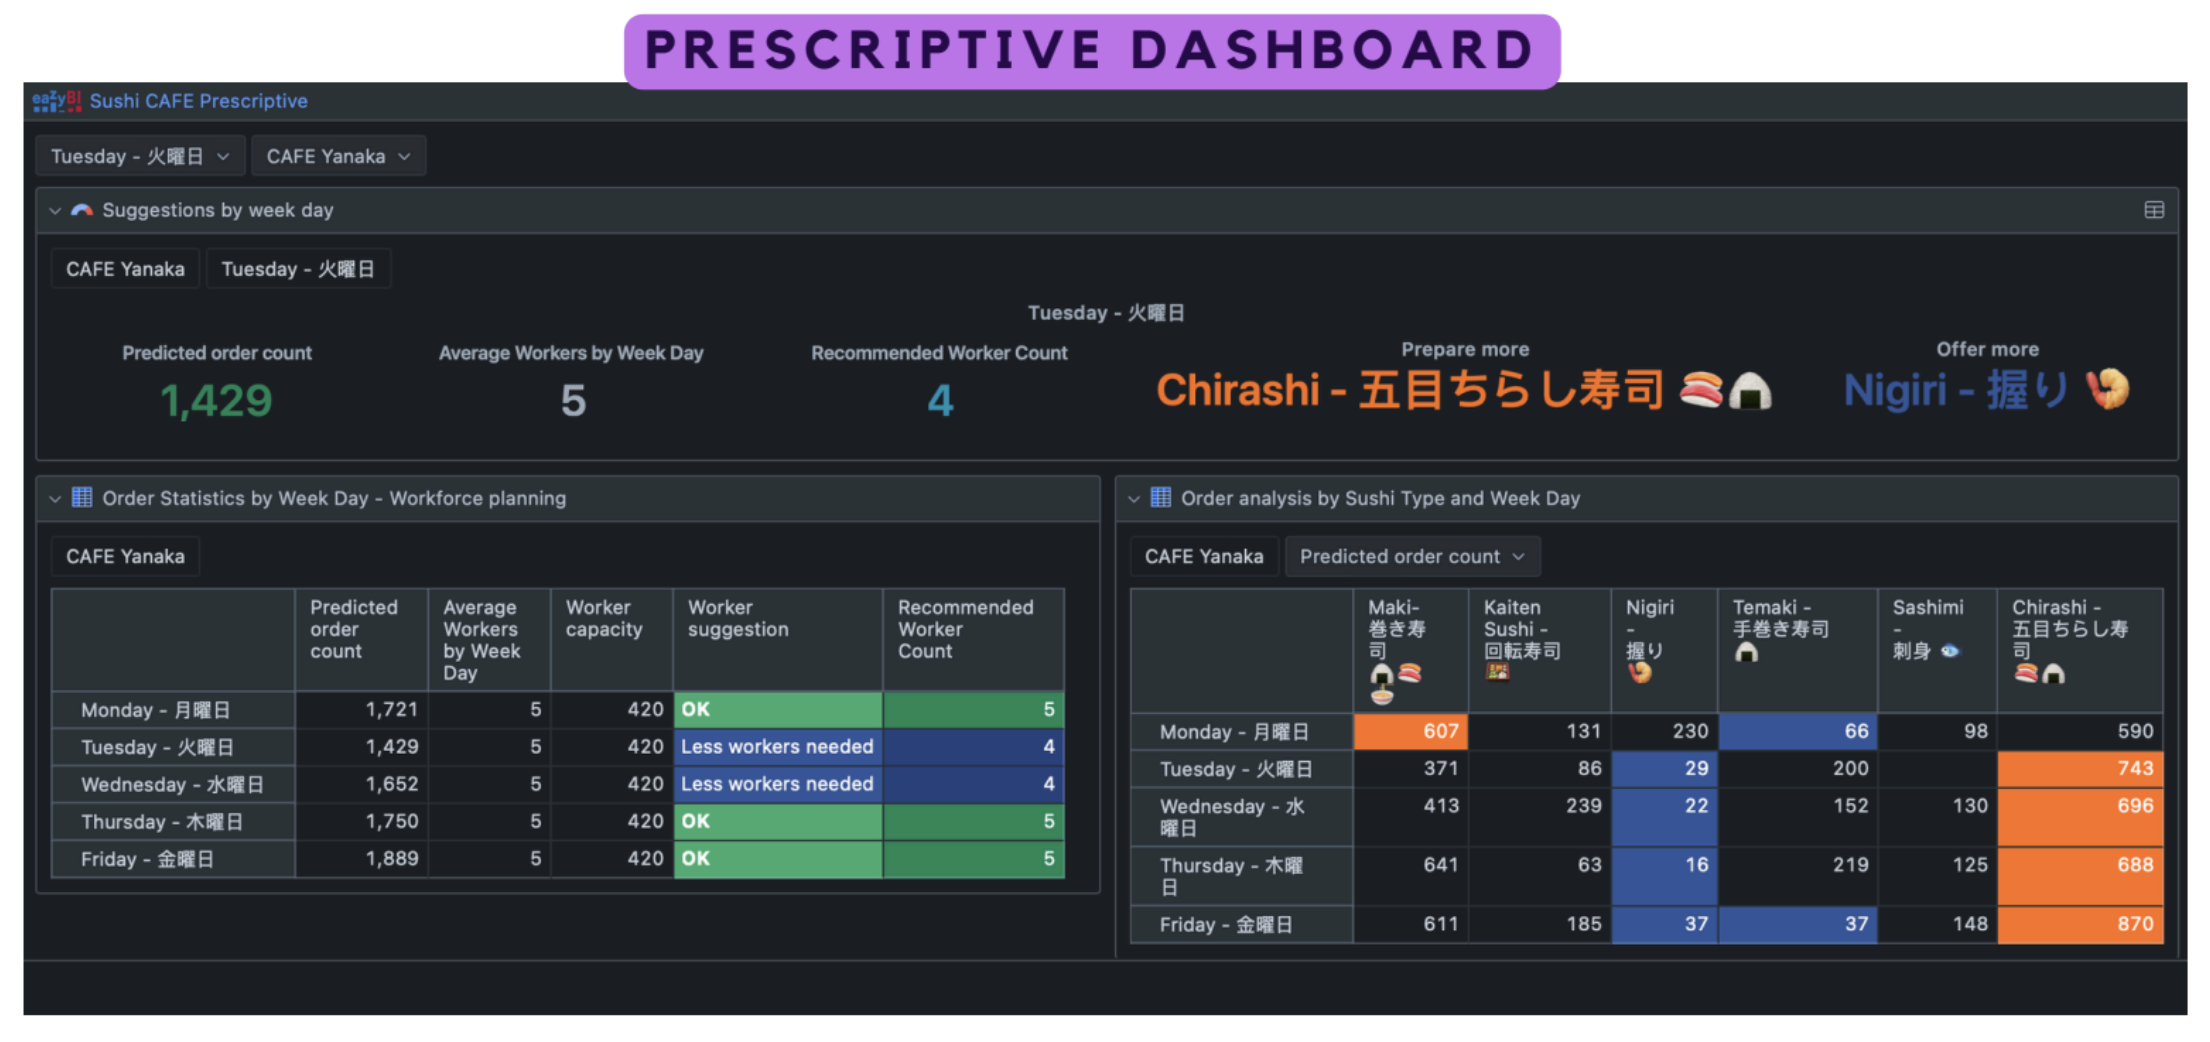
These types of suggestions aren’t guaranteed to be perfect, but they help teams make informed choices without needing to guess. For example, if Tuesday’s forecast shows low sales for nigiri, the system could recommend offering a discount to boost demand.
Merging All Three for Smarter Dashboards
While each level – descriptive, predictive, and prescriptive – has value on its own, the biggest benefit comes when they’re combined. A well-designed dashboard can layer these ideas together:
- Show current results;
- Indicate future trends;
- Offer small nudges or suggestions based on analysis.
Instead of overwhelming users, the goal is to embed intelligence into everyday views – so that data naturally guides decisions.
Real-World Use Cases
Beyond sushi cafés, this approach fits many business needs. Examples include:
- Sales forecasting for B2B or retail;
- Inventory demand planning;
- Staffing and shift planning;
- Machine and resource allocation;
- Marketing optimization – like spotting slow-moving products and adjusting promotions.
These use cases show that even without advanced AI or big data infrastructure, teams can gain smarter insights just by using their eazyBI setup more creatively.
Final Thoughts
“We never do our best on the first try.”
That was one of Dace’s key reminders. Business dashboards should evolve – starting with simple overviews and growing into tools that support smarter, faster decisions.
Whether you’re helping a café plan deliveries or guiding strategic business goals, eazyBI offers the building blocks. And with each dashboard iteration, there’s room to go further, ask better questions, and turn insights into action.
Watch the Full Presentation
Sushi café's full presentation video recording is available here.