Easy SQL Reporting, Analysis, and Visualization
A self-service SQL data discovery, analysis, and visualization tool to help you create custom, interactive charts, SQL reports, and dashboards from your data — all from a simple drag-and-drop interface.
How It Works
Import from SQL Select and Create Reports Easily
The primary function of a database is to store important business data, but when it comes to SQL data analysis and reporting, most database reporting tools lack visual analysis capabilities or they are simply too complex or require specific skills or development to access and analyze important metrics.
eazyBI makes it easy to connect to most popular SQL databases including: MySQL, PostgreSQL, Microsoft SQL Server, Oracle, and others. Import your data from specified database connection using SQL SELECT statements. No complex setups or configuration required!
- Create interactive charts, SQL reports, and dashboards with flexible drag-and-drop interface to make faster and better-informed decisions.
- Visualize your data the way you want with bar, line, area, pie, scatter, bubble, time-line, map, Gantt, gauge or mixed charts.
- Schedule regular daily import from provided SQL SELECT statement results and always have all your reports ready the moment you need them.
- Combine your data with other information sources in a single dashboard for a full overview and a single, central point of access for all your business decisions.
- Perform multi-dimensional analysis and examine your business data by drilling in and out of your data cloud instantly.
- Analyzing business data has never been quicker and easier with OLAP real-time data analysis.
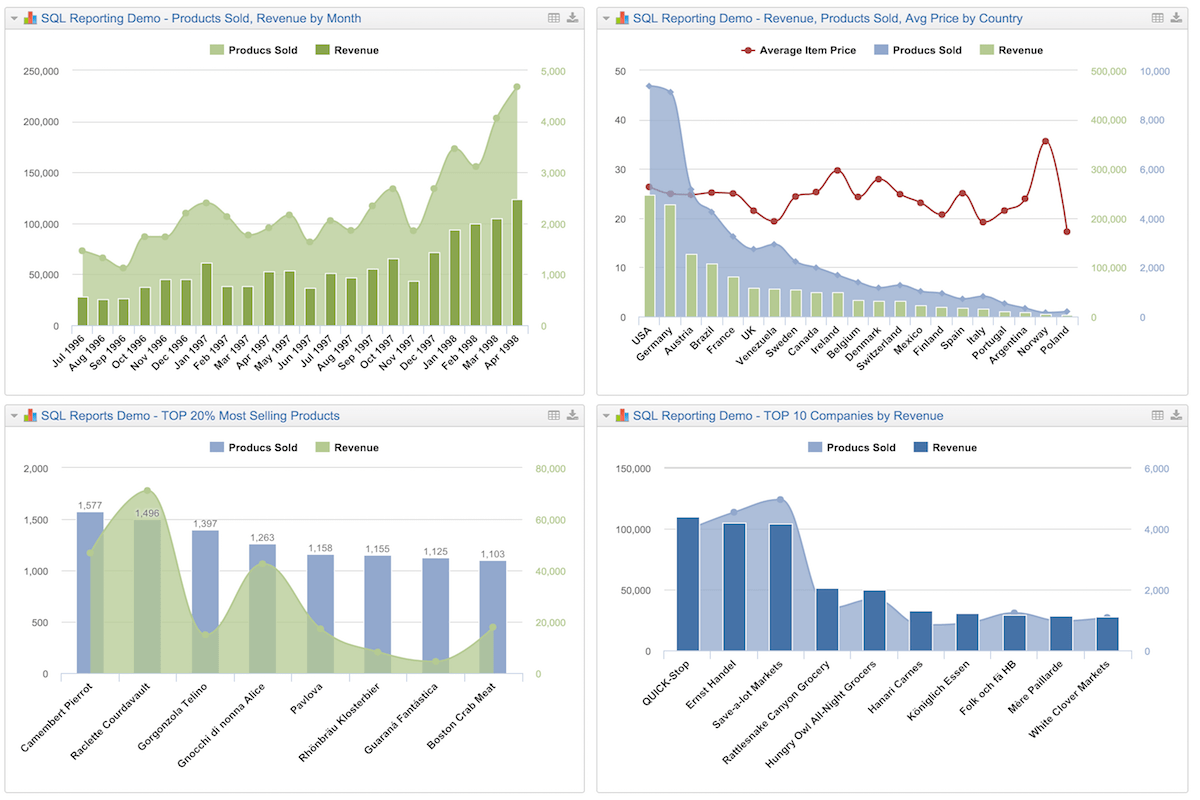
SQL Report and Dashboard Examples
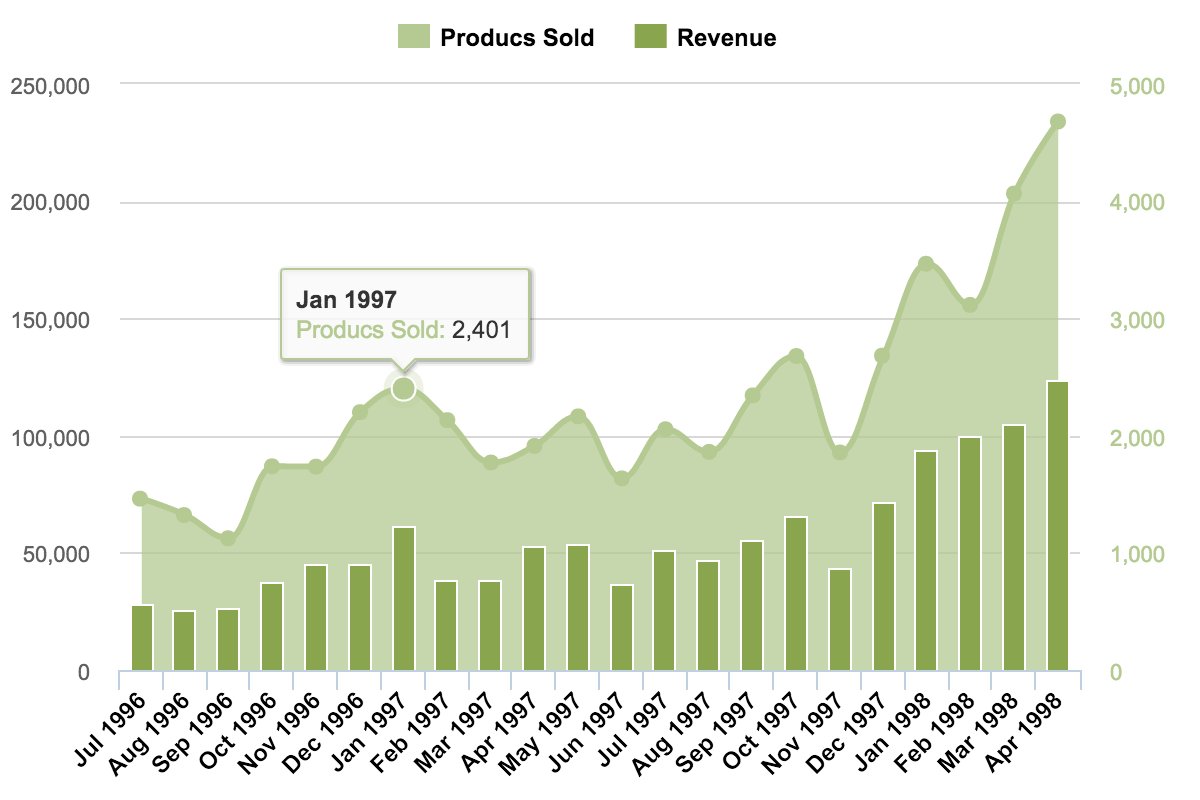
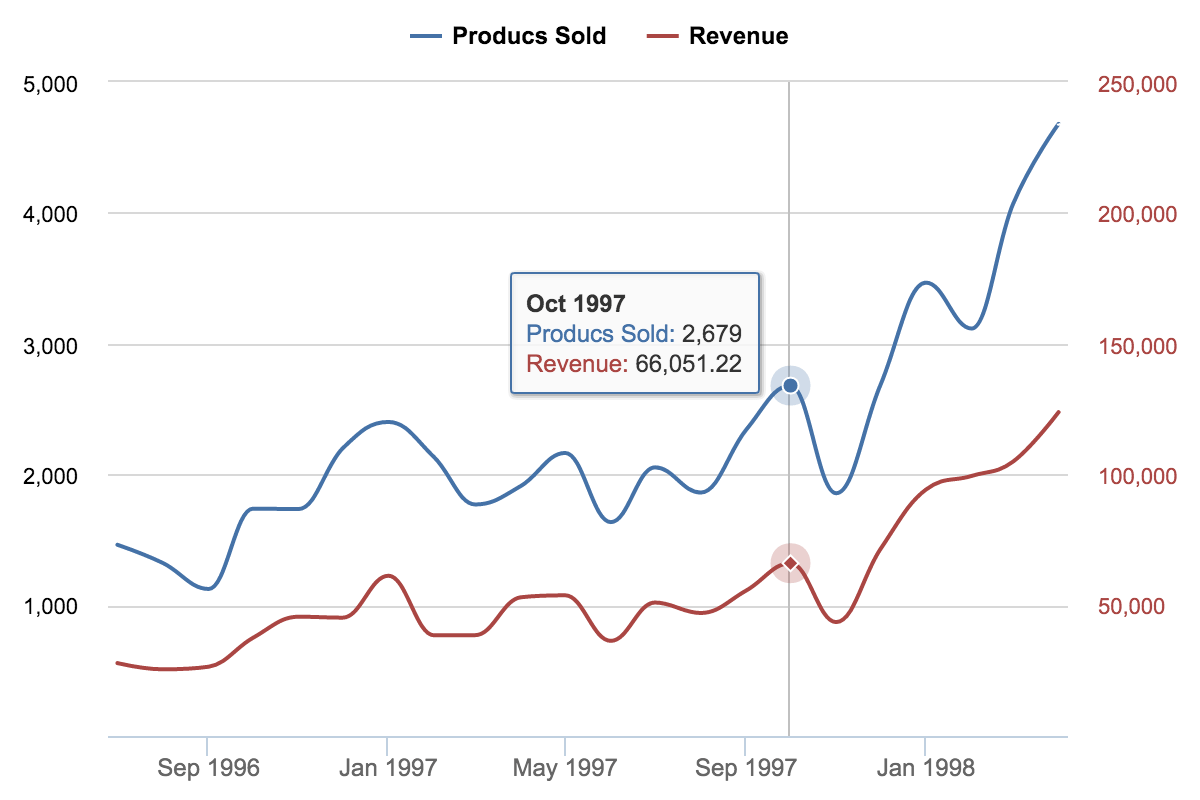
SQL Reports – Products Sold, Revenue by Month
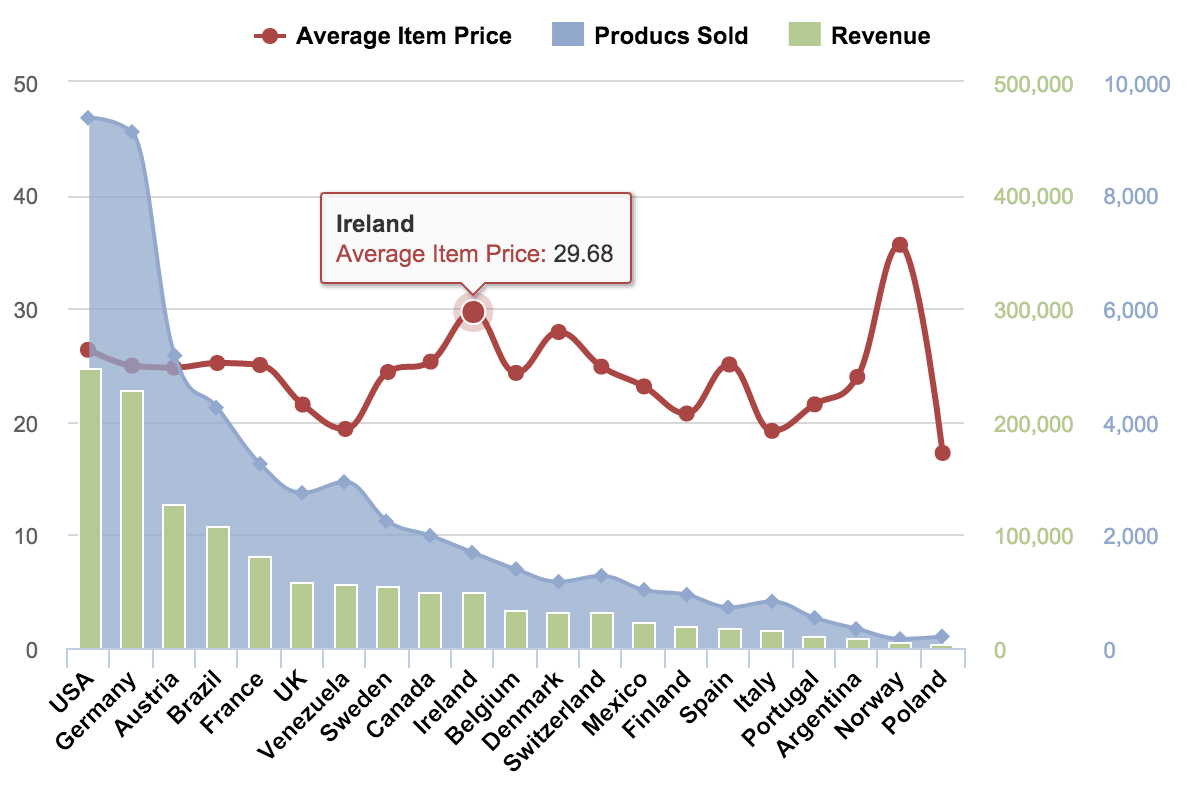
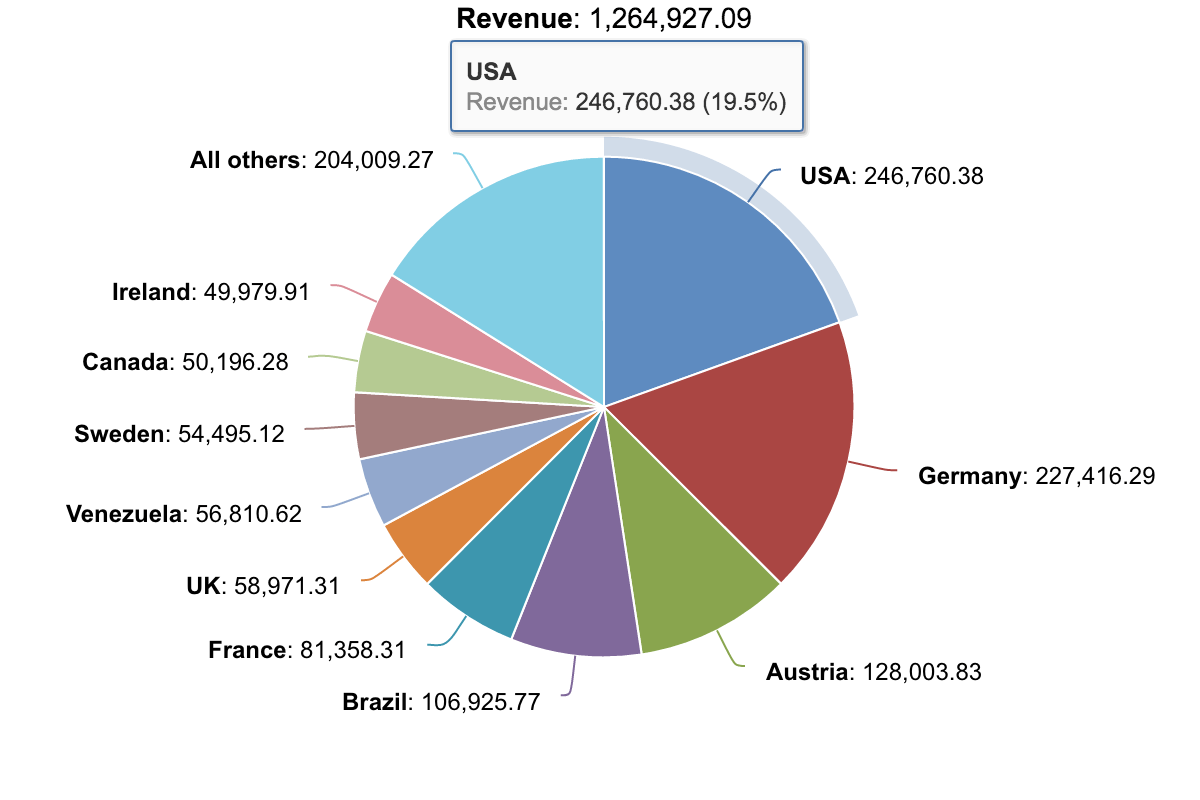
SQL Reports – Revenue, Products Sold, Average Price by Country
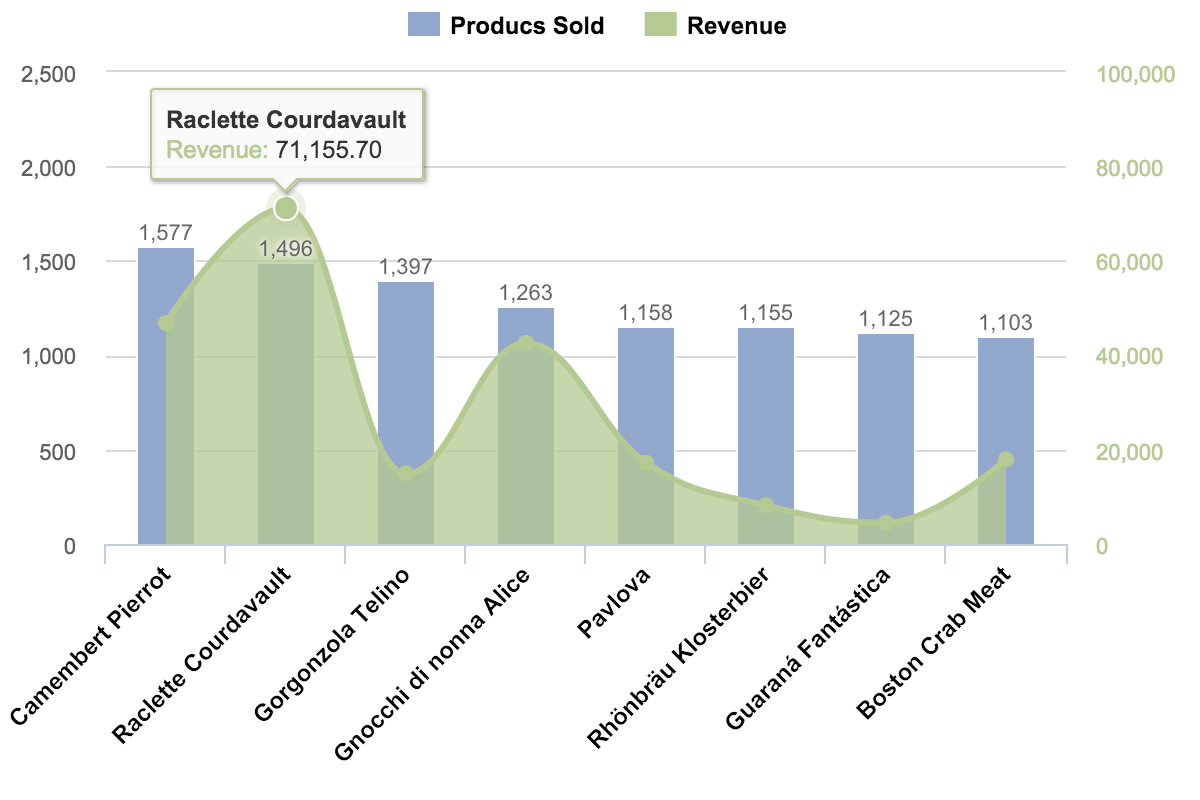
SQL Reports – TOP 20% Most Selling Products
SQL Reports – TOP 10 Companies by Revenue
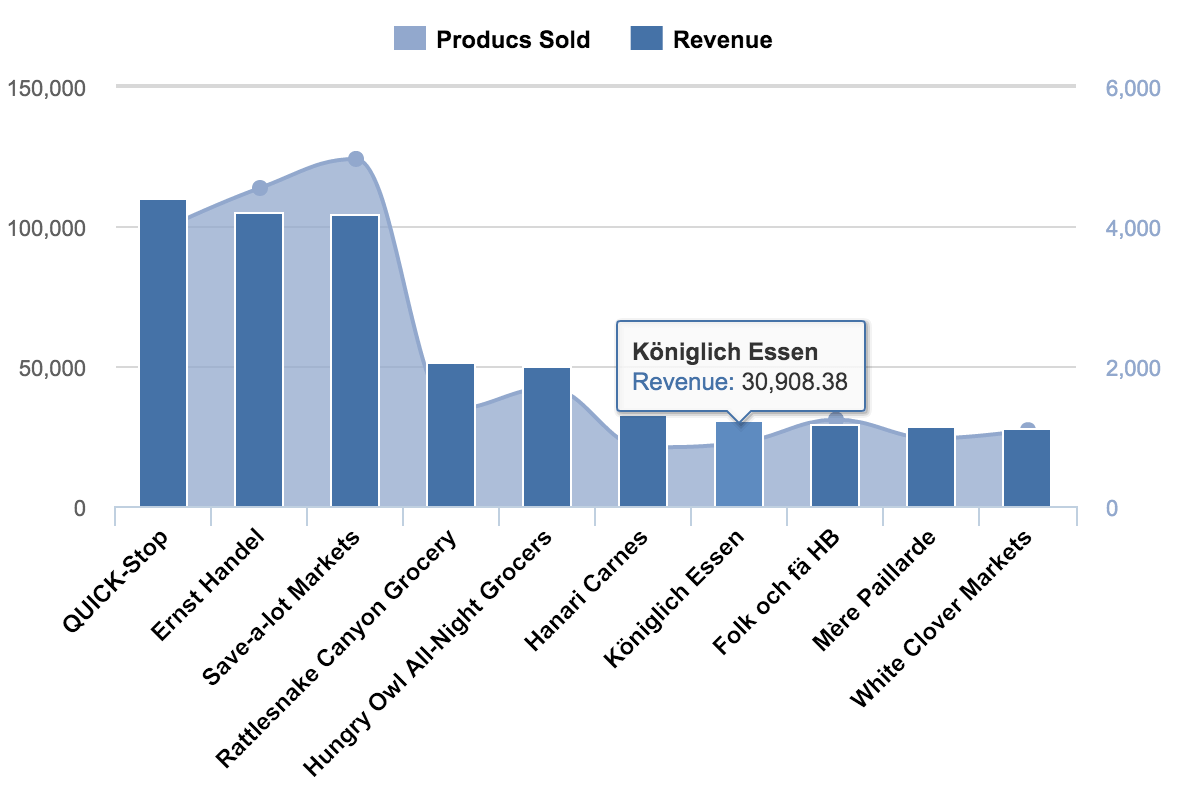
SQL Reports – Main Markets by Revenue and Products Sold
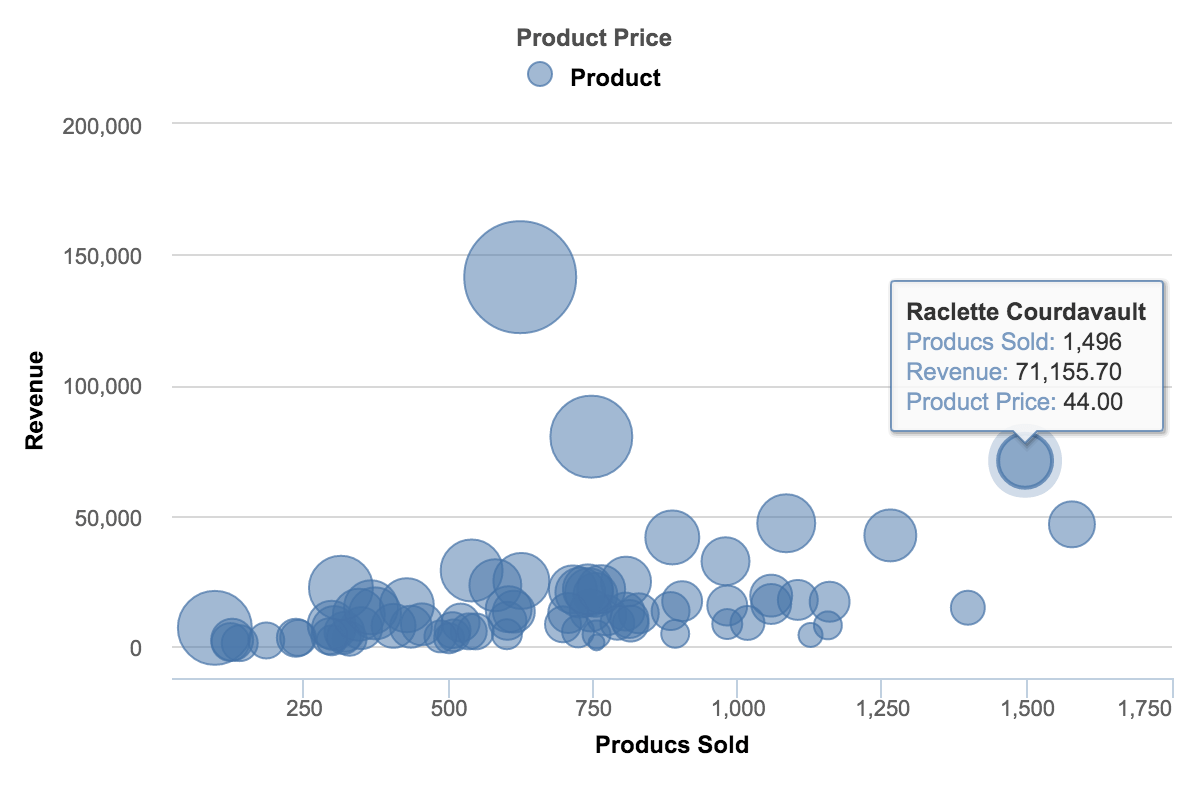
SQL Reports – Product Price, Sales, Revenue Distribution
SQL Reports – Product Sales-Revenue Timeline
SQL Dashboard Example
Very useful tool and really great support. Thank you. We had to import external data and map some tricky data. Support helped us with the mapping, measures, and concepts. Really cool, thanx a lot!
eazyBI is simply the best analytics tool – I would recommend it 100% if you have complex reporting requirements.
We have been able to build a sophisticated set of operational metrics for our organization, which are now being used to drive operational efficiency and strategic decision making.
eazyBI is simple yet incredibly powerful - very quick to integrate with your existing data. We've been able to connect it to our Salesforce org via REST to pull in external data.
We've had some pretty complex reporting requirements, and the eazyBI support team is second to none - always quick to respond, friendly and helpful. They even helped us implement a complex custom solution for a particularly tricky report we wanted to create.
Give eazyBI a try, you won't be disappointed.
State of the art reporting design and functionality, great integrations with Jira products and wide range of external sources. Support is awesome!
Start a 30-day Free Trial
Try eazyBI free for 30 days to see if it's right for you. If you need any help or support, feel free to reach out to support@eazybi.com—we're there for you.


Questions, Feedback, Support, and Documentation
Please feel free to contact eazyBI support if you have any questions, feedback, or suggestions. We are always happy to hear from our clients.
For more detailed information about eazyBI for SQL — the main concepts, data import, and the creation of charts, reports, and dashboards — please refer to eazyBI SQL documentation.
