Xray Jira Test Management Reports With eazyBI
We are constantly investigating integration possibilities with other popular Jira add-ons. Many users have asked us to add the support for the Xray for Jira test management add-on. We've listened, and now, starting from eazyBI version 4.2, you can import and analyze data from Xray for Jira.
Xray for Jira is a complete, full-featured Atlassian verified test management add-on for Jira. Xray supports both manual and automated tests and a complete testing life cycle: test planning, test designing, and test execution to help developers improve the quality of their systems.
Importing Xray Data
To import your data from the Xray add-on, you should upgrade eazyBI to version 4.2.x. eazyBI will automatically detect if you have an Xray add-on and give you additional checkbox parameter in the eazyBI Jira Import settings.
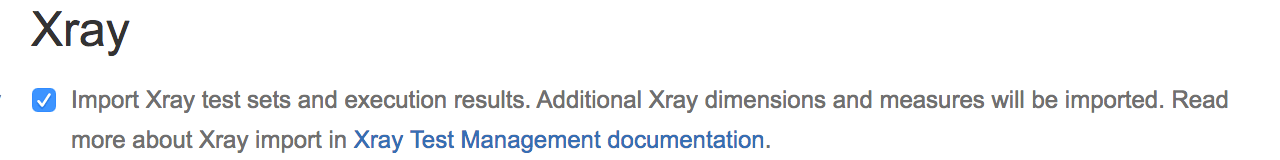
This will import a few dozen new Xray dimensions and measures. If you use Xray v.2, you can also import additional custom dimension fields, such as “Test Environment”.
Now you can use the power and flexibility of eazyBI to squeeze out every bit of information about created, scheduled, running, or completed tests, the number of defects, and more. Let’s take a look at a few Xray reports you can build with eazyBI.
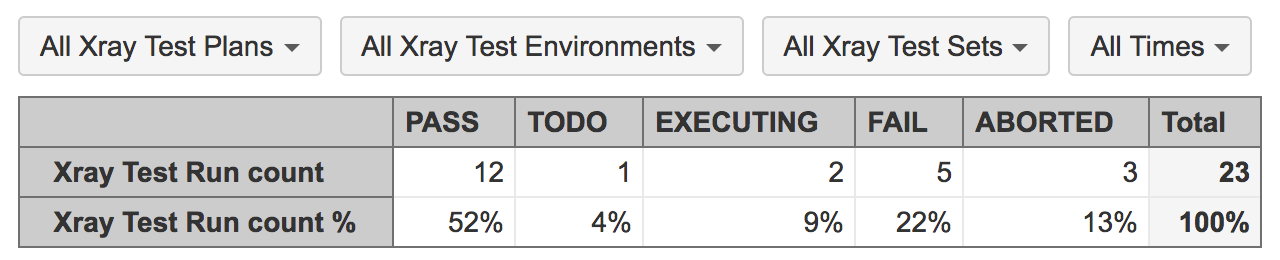
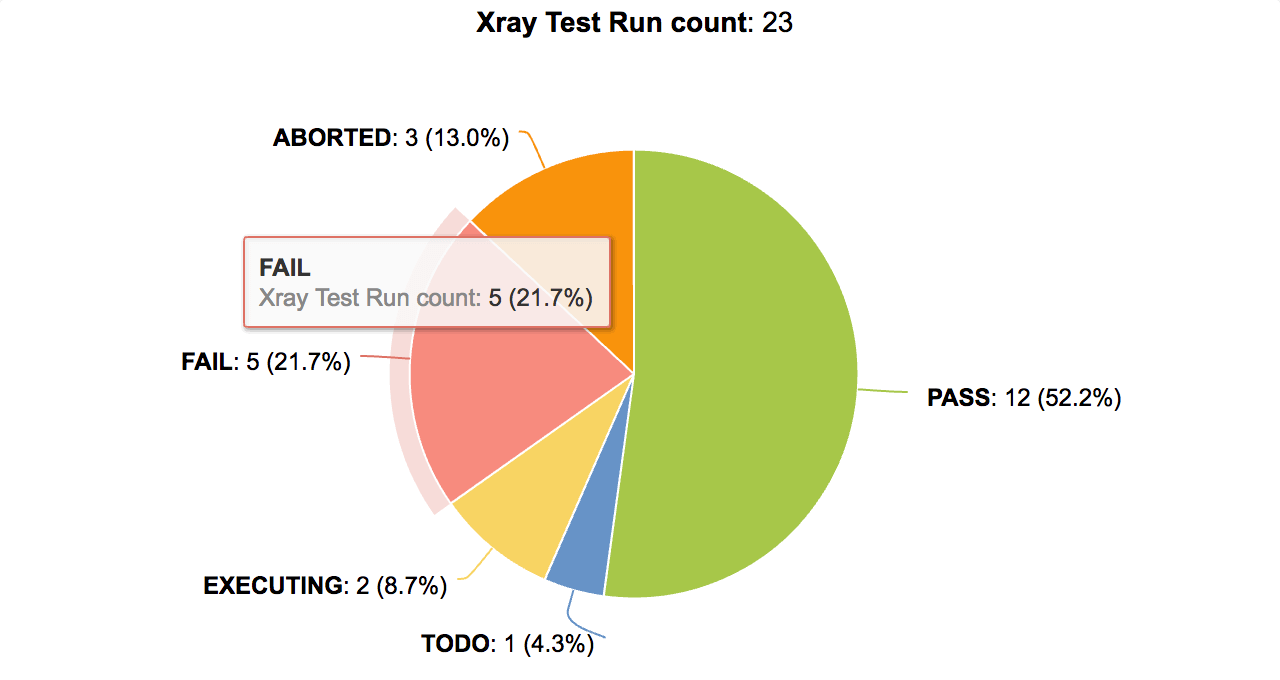
Overall Xray Test Run Results
You can create a simple test execution report to quickly see the overall snapshot of your test execution results. You can specify additional filters, for example Xray Test Plan, Test Environment, Test Set, Time period, or other Xray dimensions.
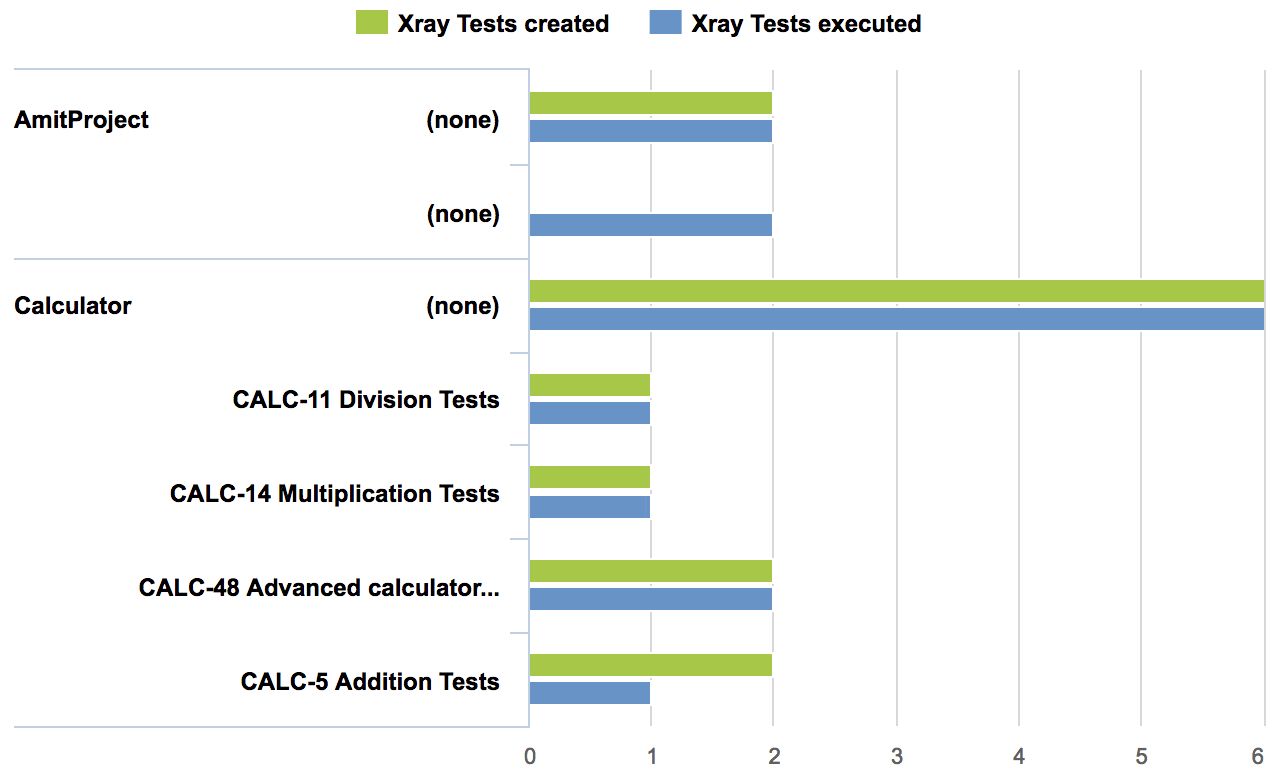
Xray Tests by Project and Test Set
After reviewing all test execution summary, you can dig deeper to analyze created and executed Xray tests by project and test set. This will give you a full overview of test execution status across all your project portfolio to quickly check which projects require your immediate attention.
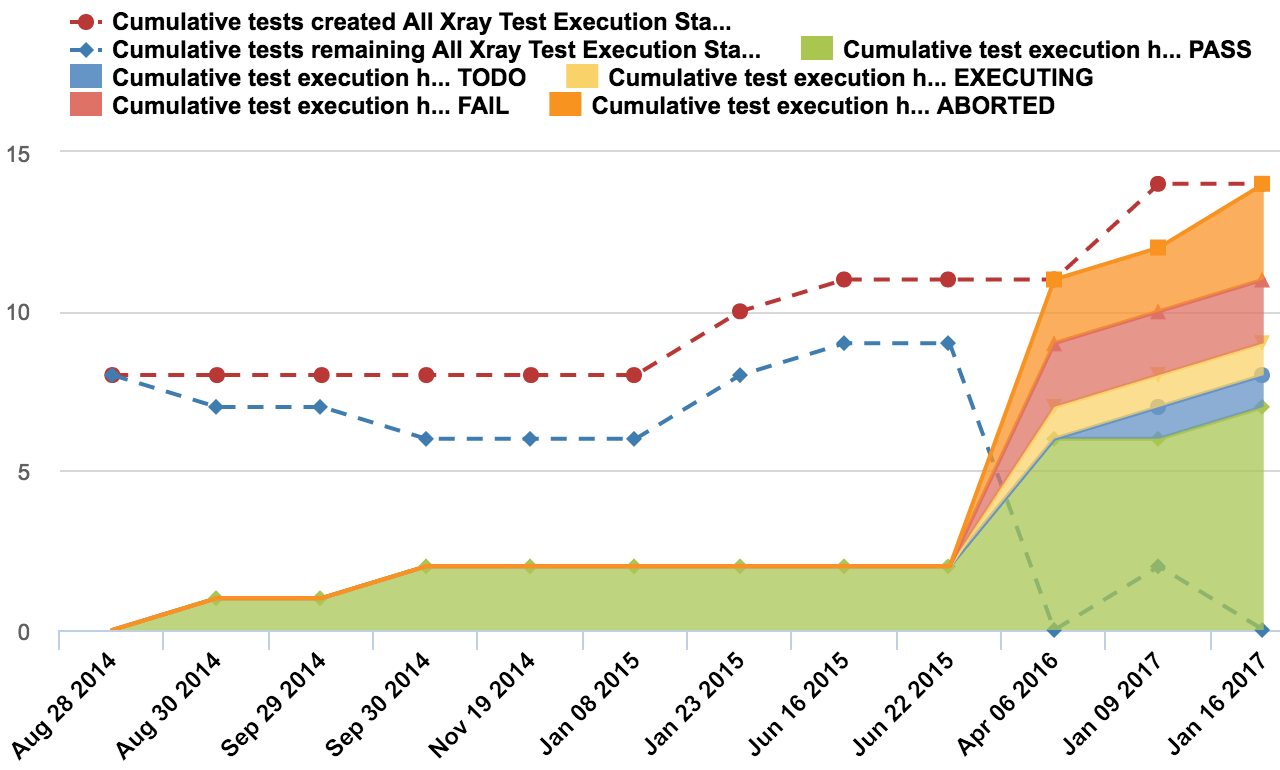
Xray Test Burn-Down Chart
A cumulative Xray test burn-down chart will give you even more detailed information. This chart can be very useful for analyzing the progress of a Test Plan to see how it evolves over time. How many tests are created, how many of them have been completed, and whether the tests are To-do, Executing, Pass, Fail, or Aborted. It is a great way to spot issues more easily, make better project forecasting, and see whether or not the testing goes according to schedule.
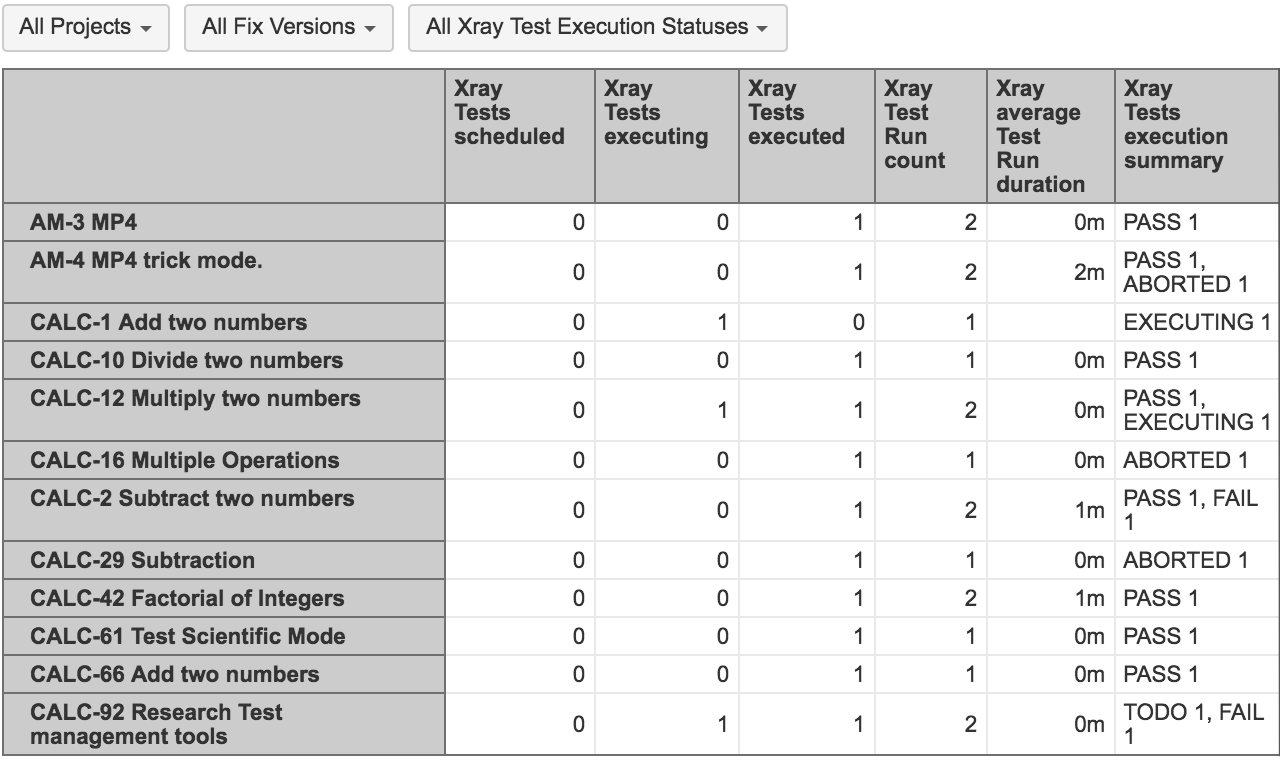
All Xray Tests Report
You can see a detailed information about each one of your tests – all in one chart.
- Which tests have been scheduled, executed, or completed most often?
- How many times and how long each test has been run?
- What statuses have been returned?
- Which test have been failing most often?
You can also set additional filtering by a project, status, or version, to narrow down your report even further.
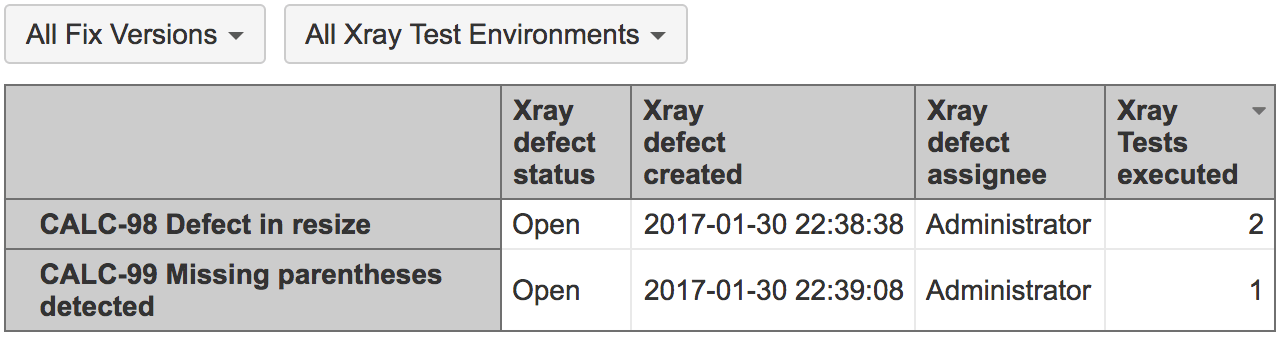
Top Defects Report
You can list all distinct tests who executed with defects. Find out what defects are captured in each version and how many tests does that affect? For example, if a certain defect is affecting many tests, you might want to resolve it first.
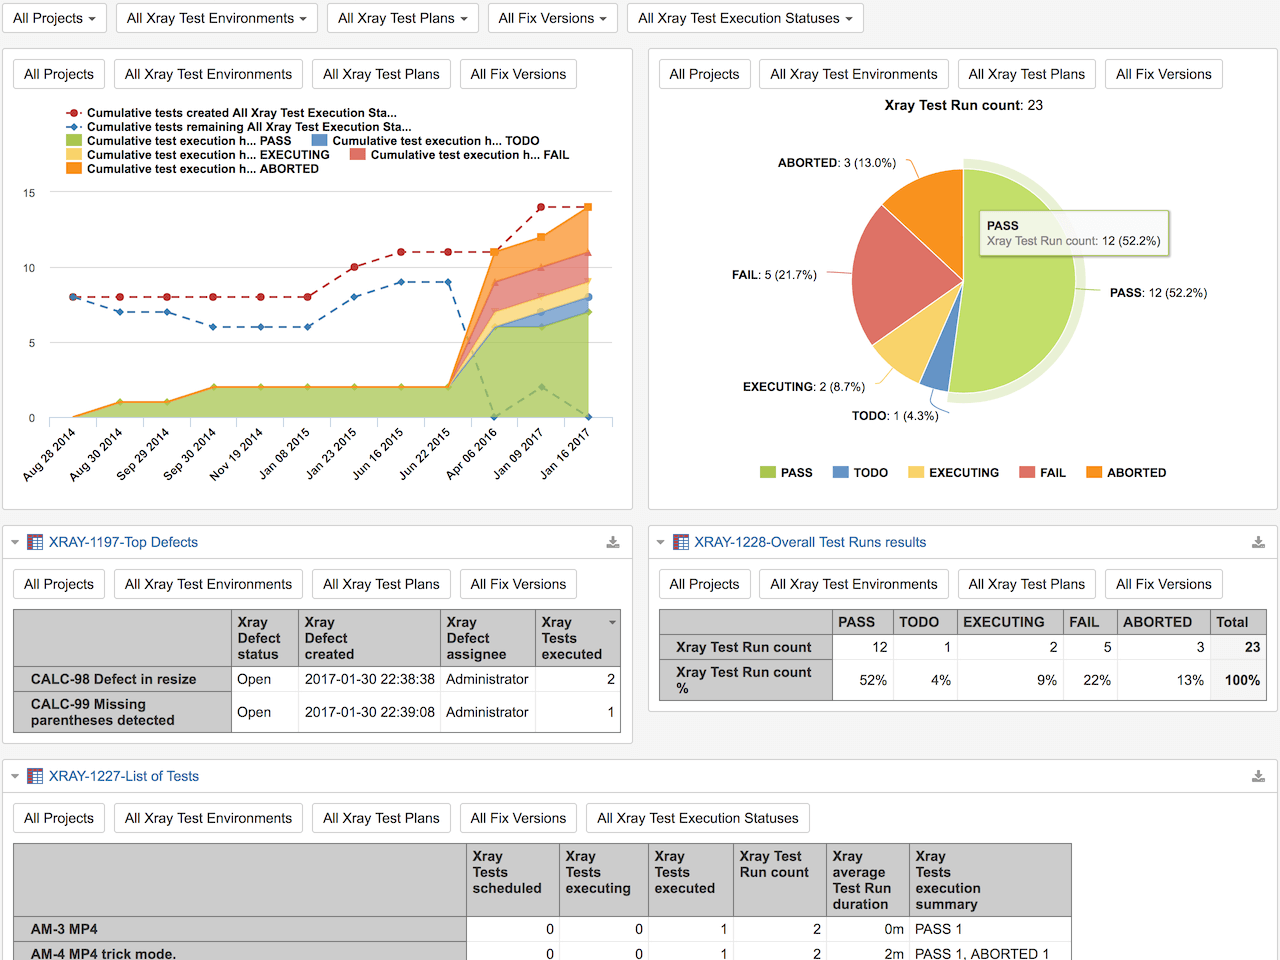
Xray Test Report Dashboard
You can combine several Xray reports in one dashboard and use the common filter option to get a quick top-down overview of a particular project, test plan, version, assignee, status, test type, etc. Common filter values are applied to all reports at once, giving you instant results based on filter criteria you selected. For example, you might want to see how many times each test was run, what’s the average run duration of each test, how many defects there are and which tests are affected.
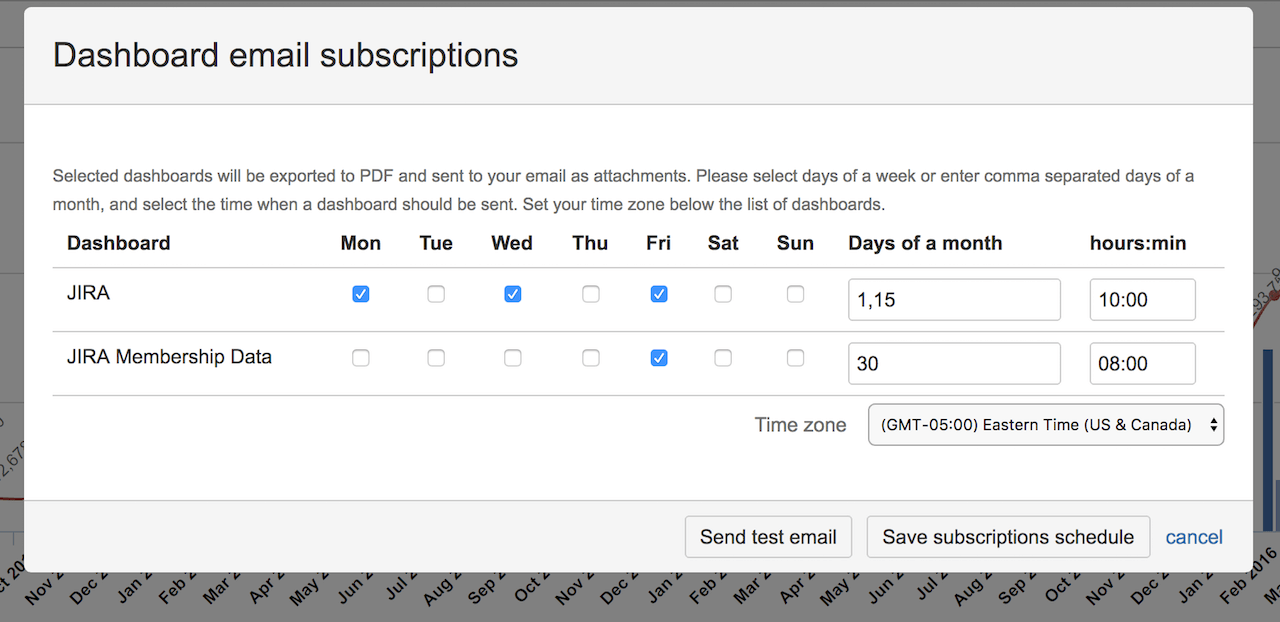
With eazyBI you can also subscribe to receive regular dashboard snapshots to your email. With a monthly, weekly, or even daily updates you will always be in the loop.