
Three Jira Time in Status Reports With Timepiece and eazyBI
eazyBI already calculates how long a Jira issue spent in each status. It reads Jira's own changelog, so no third-party app is required. Timepiece - Time in Status for Jira adds three things on top: multiple work-hour calendars for teams on different schedules, ready-made duration reports on any field, and reporting inside Jira itself. Here is what each tool does on its own, and three reports you can build by combining them. The eazyBI integration is available for Timepiece on Jira Cloud.
What Does eazyBI Already Calculate on Its Own?
eazyBI imports Jira's issue changelog directly and builds status duration and cycle time measures from it. No other app is needed.
With "Import issue change history" turned on in the Jira import options, eazyBI creates measures such as Days in transition status and Workdays in transition status, plus their averages. The same import tracks how long an issue held each Assignee, Priority, or Sprint value, and each value of any custom field with value changes imported. Issue cycles group statuses into named phases, such as Progress or Testing, so you can build a cycle time report without external data. For office hours within a day, the DateDiffWorkHours() function lets you write a custom measure. If all you need is "how many days did an issue sit in each status," eazyBI answers that natively.
What Does Timepiece Add on Top of That?
Multiple named work-hour calendars, and ready-made duration reports that need no per-field setup or custom formulas.
Timepiece lets you define separate calendars, each with its own working days, hours, breaks, holidays, and time zone. You can run the same report against one team's calendar, or against a unified calendar for all teams. It calculates Cycle Time, Lead Time, Resolution Time, and Issue Age directly. If you are new to these metrics, see this guide to cycle time vs. lead time in Jira. Its Any Field reports measure duration on any field or assignee group, using the calendar you choose. Timepiece also has its own reporting page, dashboard gadgets, and issue view tabs, so a team can see these numbers inside Jira, with or without eazyBI.
Report 1: Compare Bottlenecks Across Teams on Different Schedules
Run the same Status Duration report against each team's own Timepiece calendar, and you see where each team's work really waits.
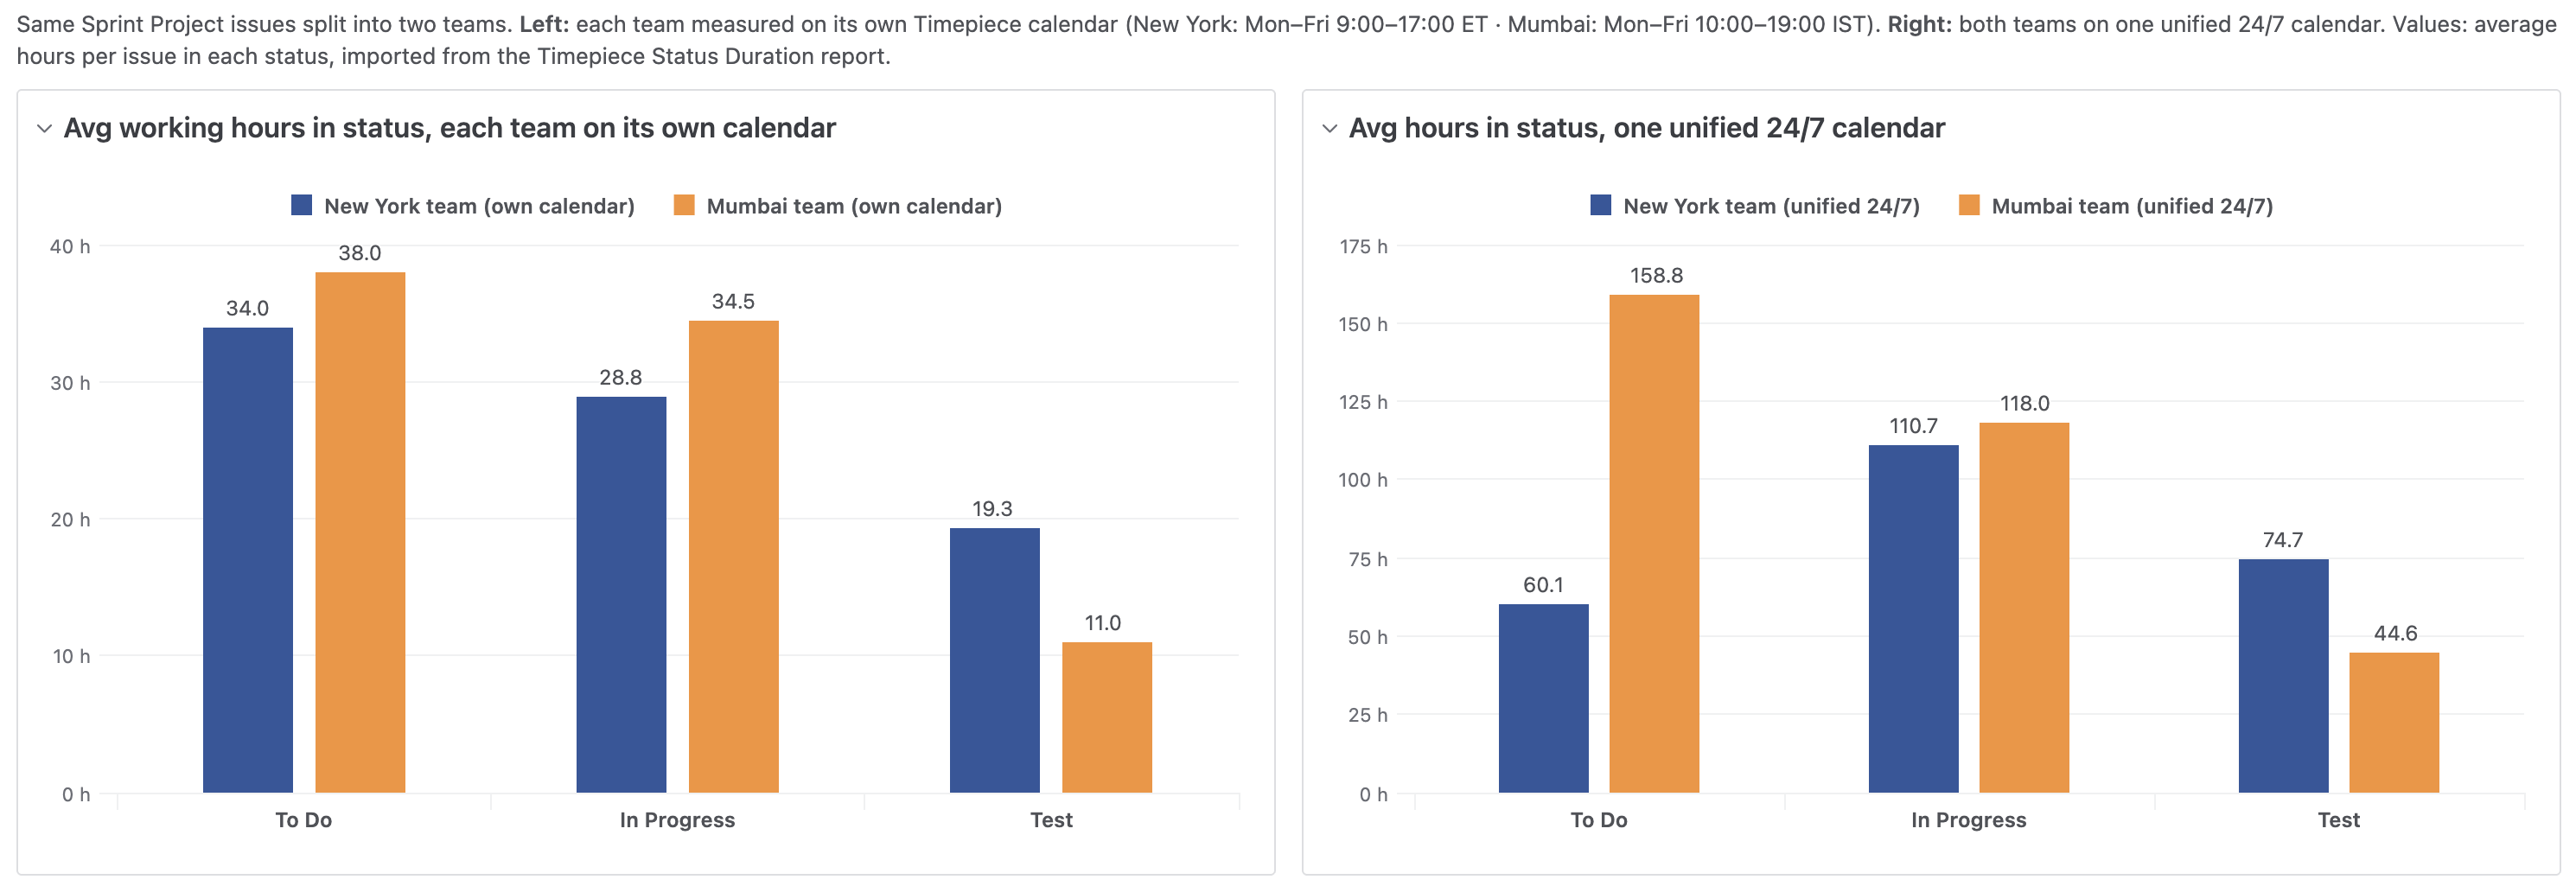
eazyBI's workday measures use one time zone and one set of working days per account. That works well for a single team. Now take a New York team working 9:00 to 17:00 ET and a Mumbai team working 10:00 to 19:00 IST. Counted around the clock, Mumbai's issues stay in To Do more than twice as long as New York's (158.8 vs 60.1 hours). Counted in each team's own working hours, the gap is small (38.0 vs 34.0 hours). Configure a calendar for each team in Timepiece and import the results into eazyBI's Issues cube. A project manager can then compare the teams side by side, and switch to the unified calendar to see the total elapsed time.
Report 2: Track Duration on Any Field With Your Own Calendars
Build a duration report on any custom or system field, such as Block Reason, counted on the Timepiece calendar you choose.
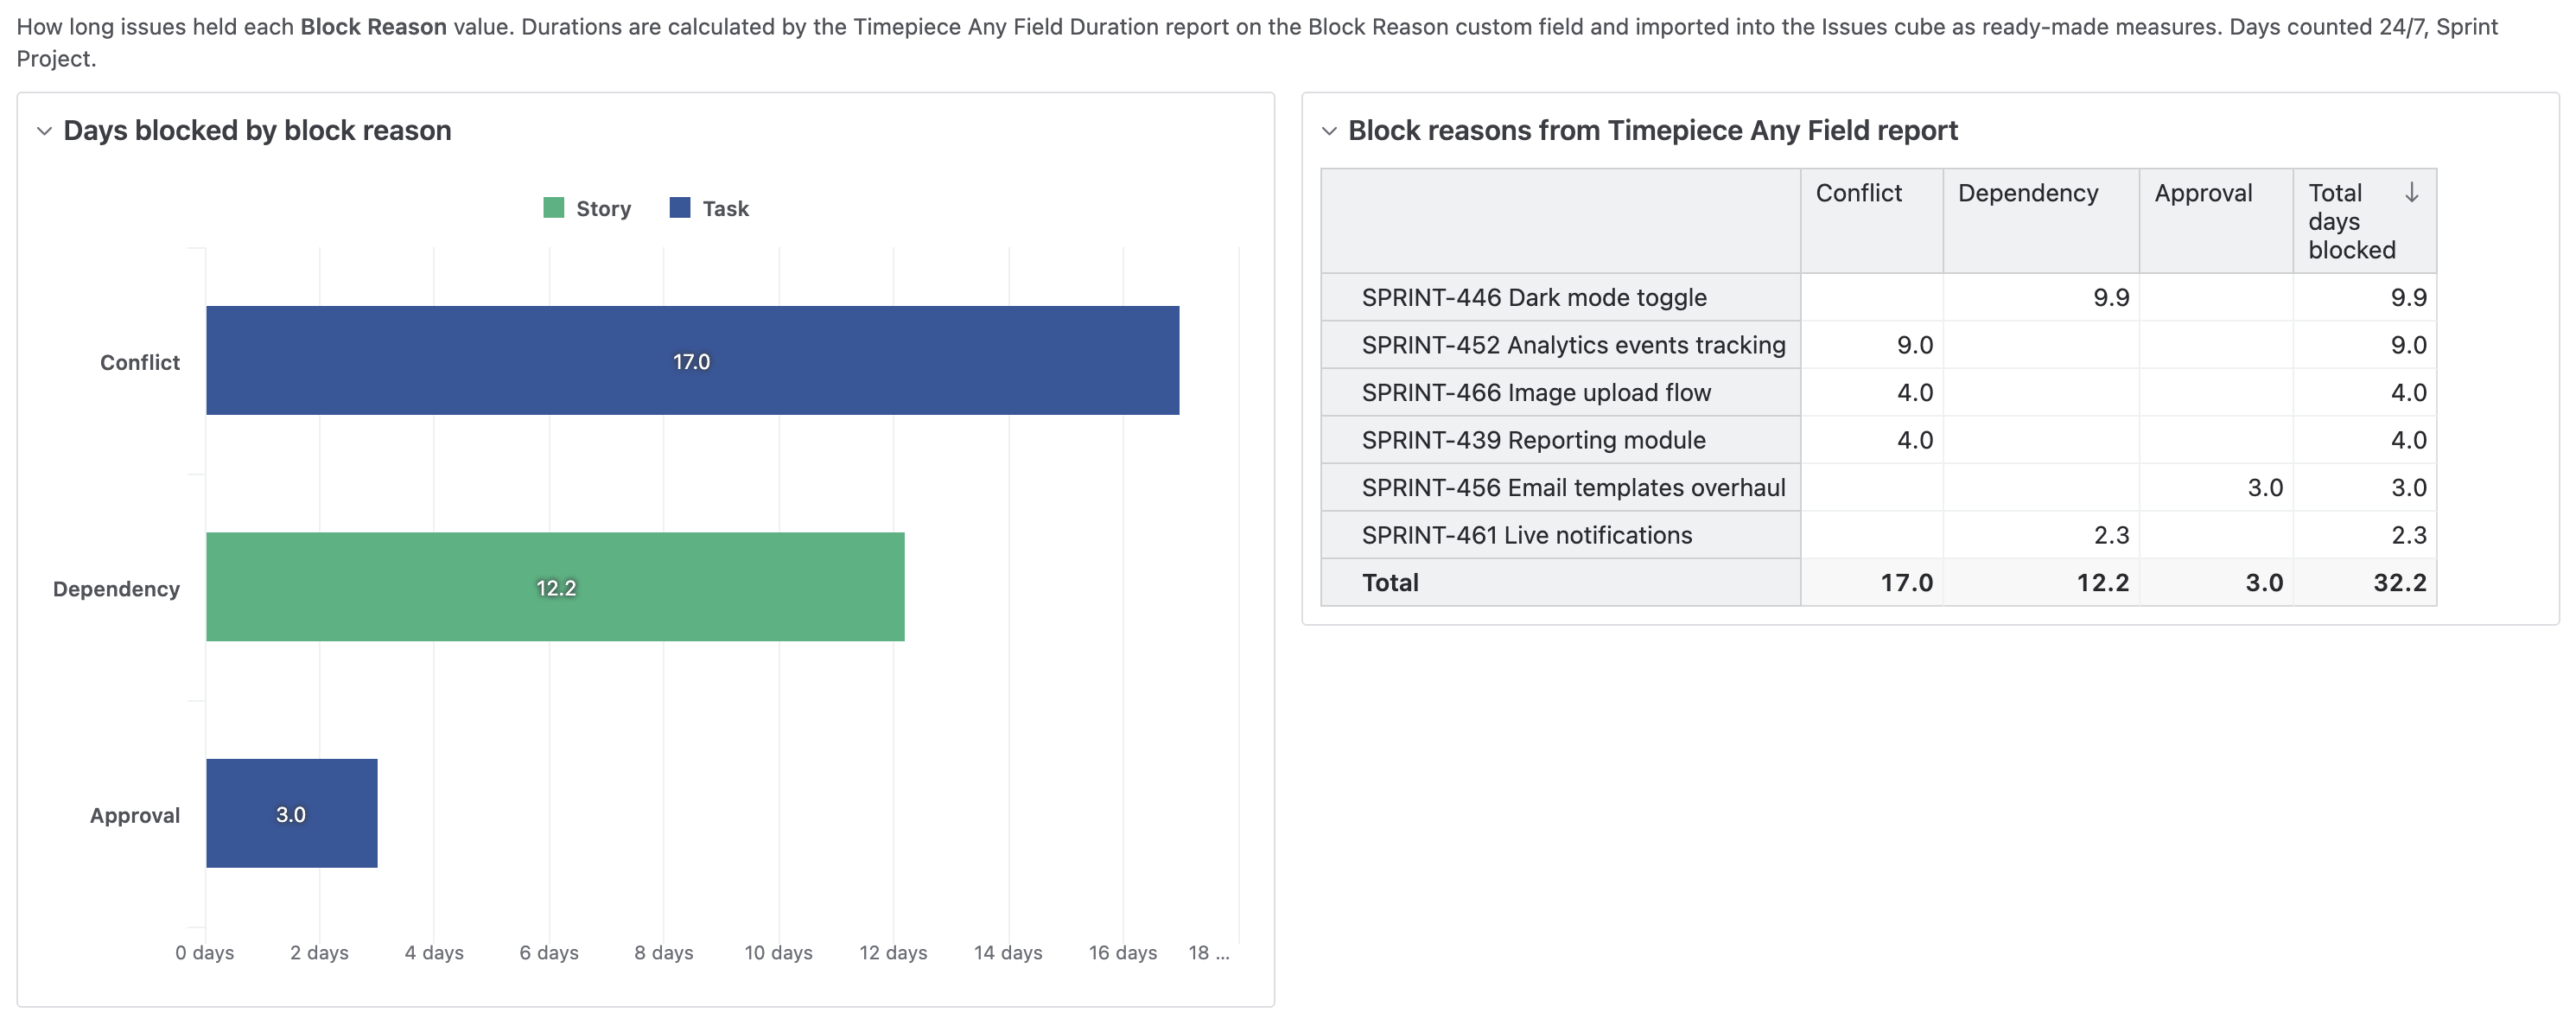
eazyBI's change history import covers other fields too. Built-in fields such as Assignee, Priority, and Sprint work out of the box. For a custom field, you turn on value-change import for that field, and eazyBI counts durations in days or in the account's workdays. Timepiece's Any Field reports calculate the duration for you, on any of your calendars. The results reach eazyBI's Issues cube as ready-made measures. A Scrum Master can analyze block reasons, and an engineering lead can group by component, without extra setup per field.
Report 3: See What a Slow Stage Costs
Combine Timepiece's wait-time durations with cost data you already keep in a spreadsheet or another eazyBI source. A delay then becomes a cost figure that stakeholders outside engineering understand.
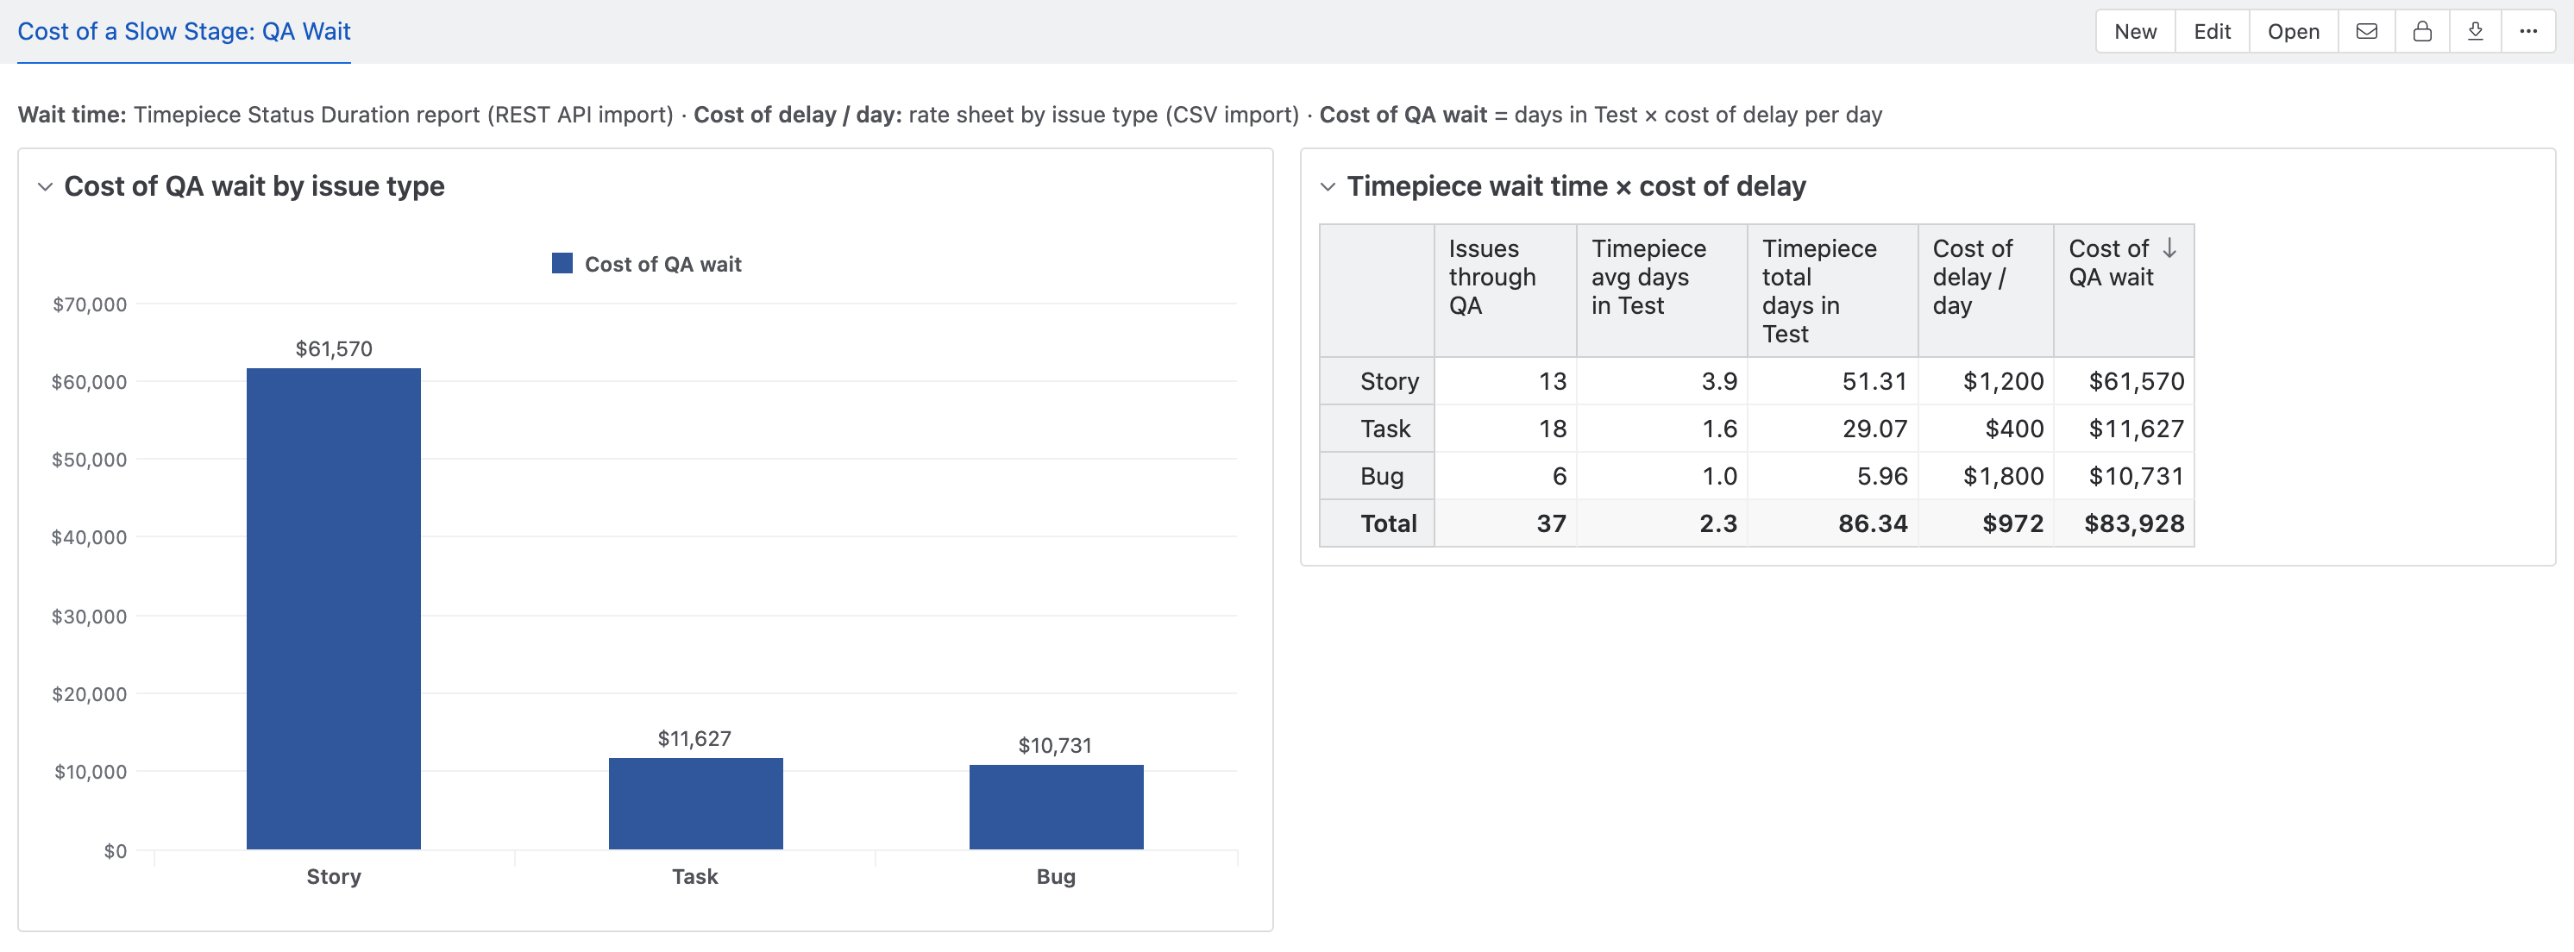
"Issues wait more than two days in QA" is a process metric. It rarely gets attention outside the engineering team. eazyBI can import data from other sources into the same account, such as CSV files, Google Sheets, or SQL databases. In this example, a cost-of-delay rate per issue type comes from a CSV file. A calculated measure multiplies Timepiece's days in the Test status by that rate. The result is the cost of the bottleneck: $83,928 across 37 issues, most of it from Stories. Team hourly rates or budget data work the same way. For the exact setup, including the field mapping and REST API configuration, check out the step-by-step guide and the eazyBI documentation page.
Start Your Free Trial
Both apps offer a free 30-day trial on the Atlassian Marketplace: eazyBI for Jira Reports, Charts, and Dashboards and Timepiece - Time in Status for Jira.
About the author

Birkan Yildiz is a Senior Content Creator at OBSS, specializing in technical storytelling and digital strategy. With 14 years of experience spanning digital journalism, fintech, and enterprise software, he excels at translating complex technologies into clear, human narratives.