
What’s New in eazyBI 4.2?
eazyBI Release Notes highlights recent product improvements we’ve made. From usability improvements and new dimension hierarchy members to Xray integration and built-in report usage statistics for server versions — this is what we’ve released in January.
Dashboard Improvements
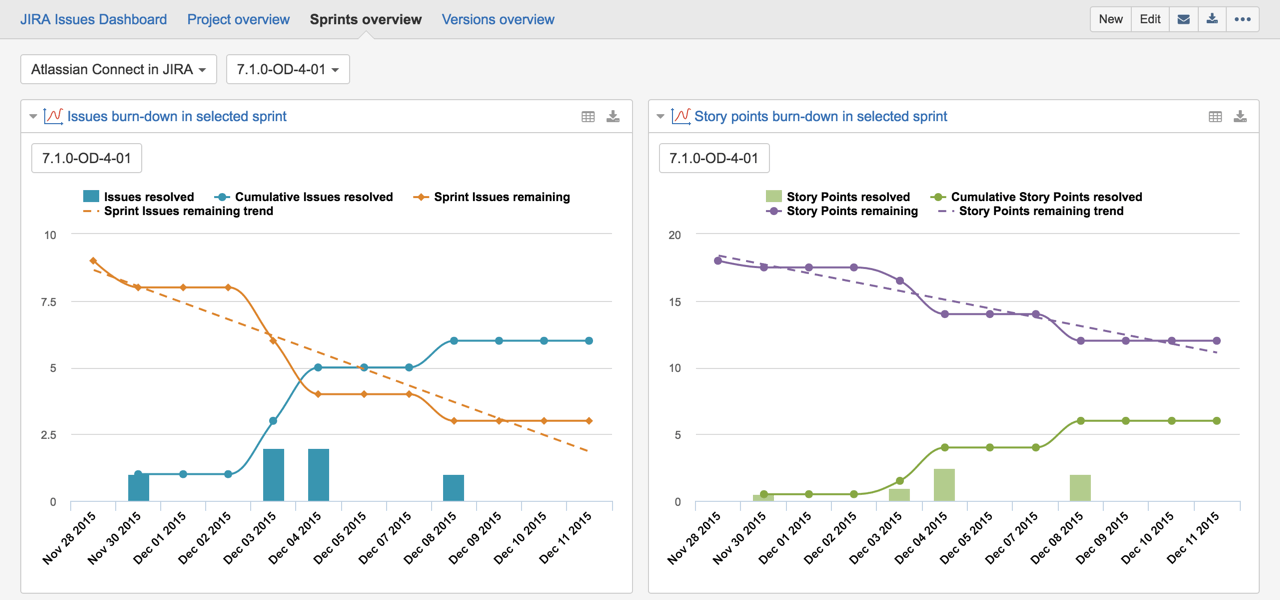
In dashboards, the primary focus should always be on charts and reports. This is why we’ve made many small changes to eazyBI dashboard colors and navigation bar. You will notice that reports in eazyBI dashboards now stand out more clearly, while embedded reports and report gadgets blend in with the rest of the page. Additionally, small adjustments to report alignment and layout make dashboards look more balanced and organized.
Dashboard Email Subscriptions
In eazyBI, you can subscribe to receive dashboard reports as PDF attachments in your email. With this update, now you can select not only a particular day of the week but also specify a certain day of the month when you’d like to receive those reports. For example, you might want to receive report updates every Monday, but also the first day of every month. Try it!
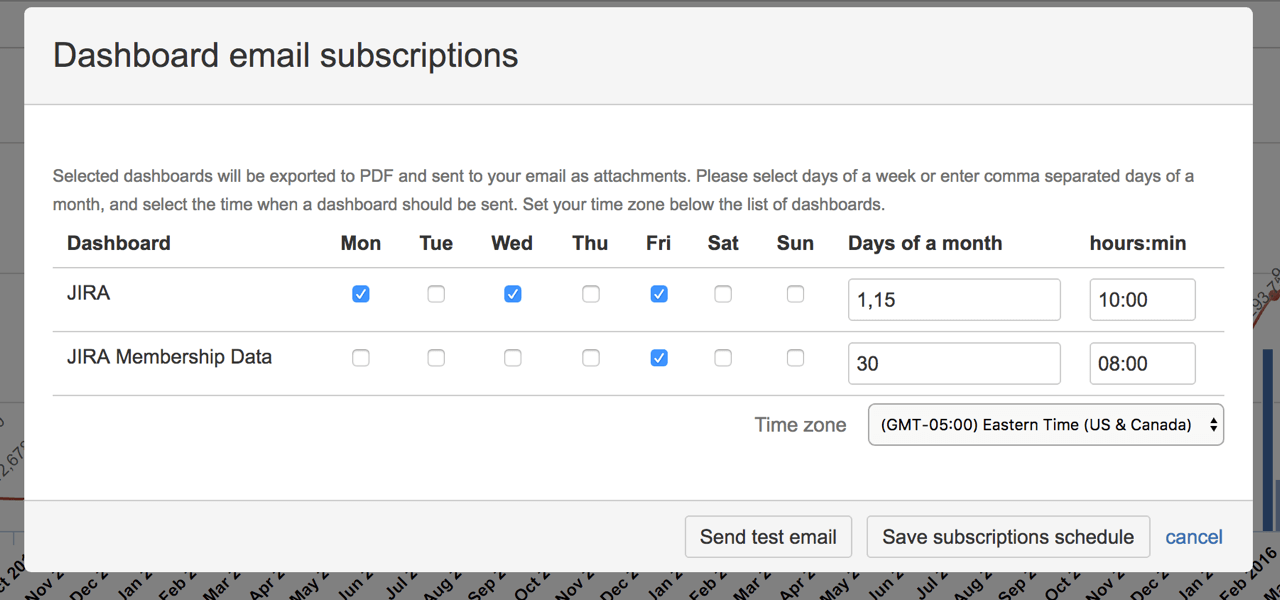
Chart Axes Options
Now we are giving you more chart formatting options to help you highlight your data and to make your charts clearer and more informative.
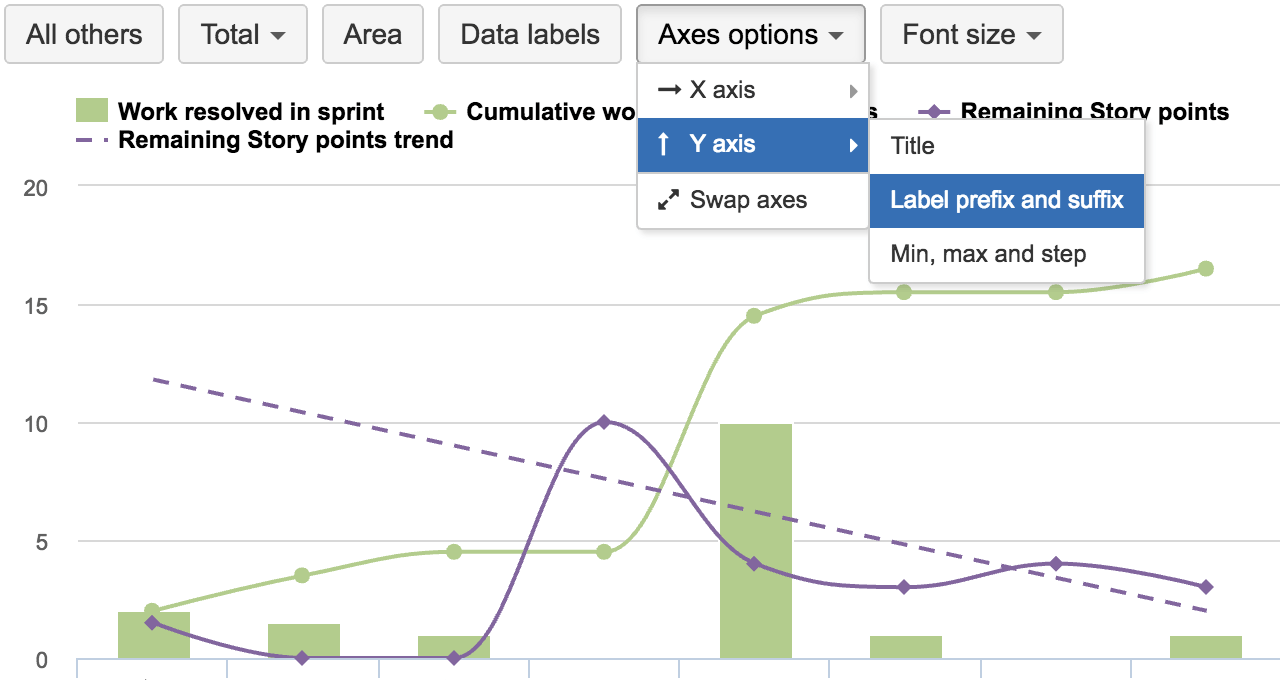
- Change names of chart axes labels.
- Choose the font size between small, medium, and large.
- Set minimum and maximum values on your axes and define the step of the gridlines.
- Use the “Swap axes” option to swap row and column dimension placement on X and Y axes.
- Change the title and label orientation for the X-axis.
- Add a prefix or a suffix to your labels. For example, add the “$” symbol before currency values.
Time Dimension Options
Atlassian Jira is used in many countries all around the world. When analyzing time-based data, we have to take into account different working and nonworking days, holidays, and even time zones. In previous versions of eazyBI for Jira, all date timestamps were imported based on Jira server time zone, and all non-working days had to be inserted directly into formulas.
Nationwide and multinational companies with offices in different time zones now can create different eazyBI accounts to represent the data based on different time zones. You can specify additional options for the Time dimension: the time zone, the first day of the week, and nonworking days.
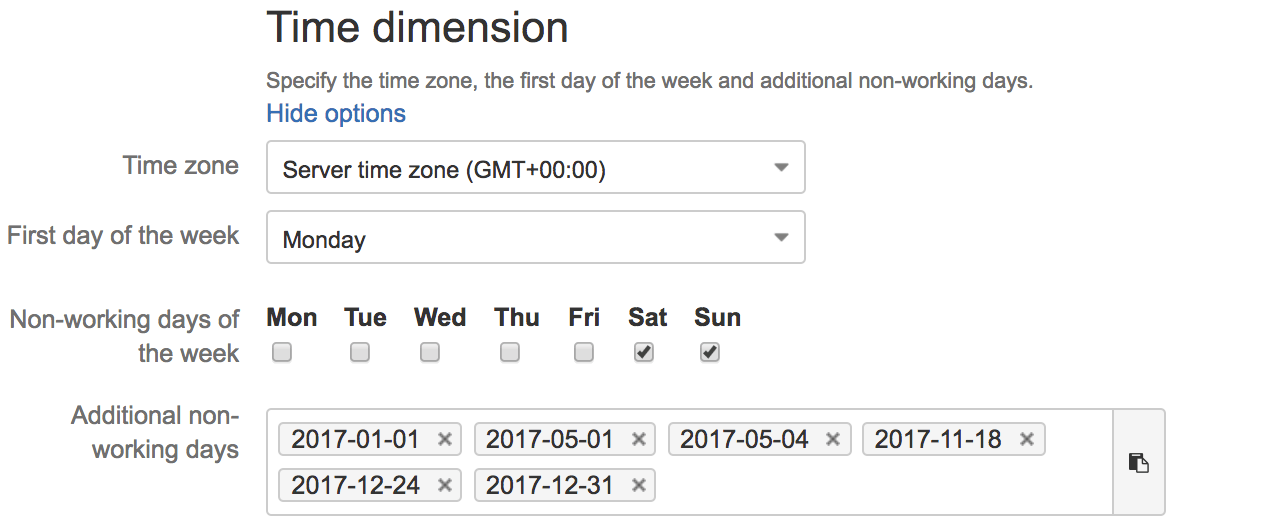
When you set a different time zone, all timestamps for the particular account will be converted to this time zone. All the selected nonworking days and holidays will be used to calculate the new workdays’ measures such as Average resolution workdays, Average age workdays, Workdays in transition status, and Average workdays in transition status. Nonworking days of the Time dimension will be used also for DateAddWorkdays MDX functions.
Integration with the Xray Add-on

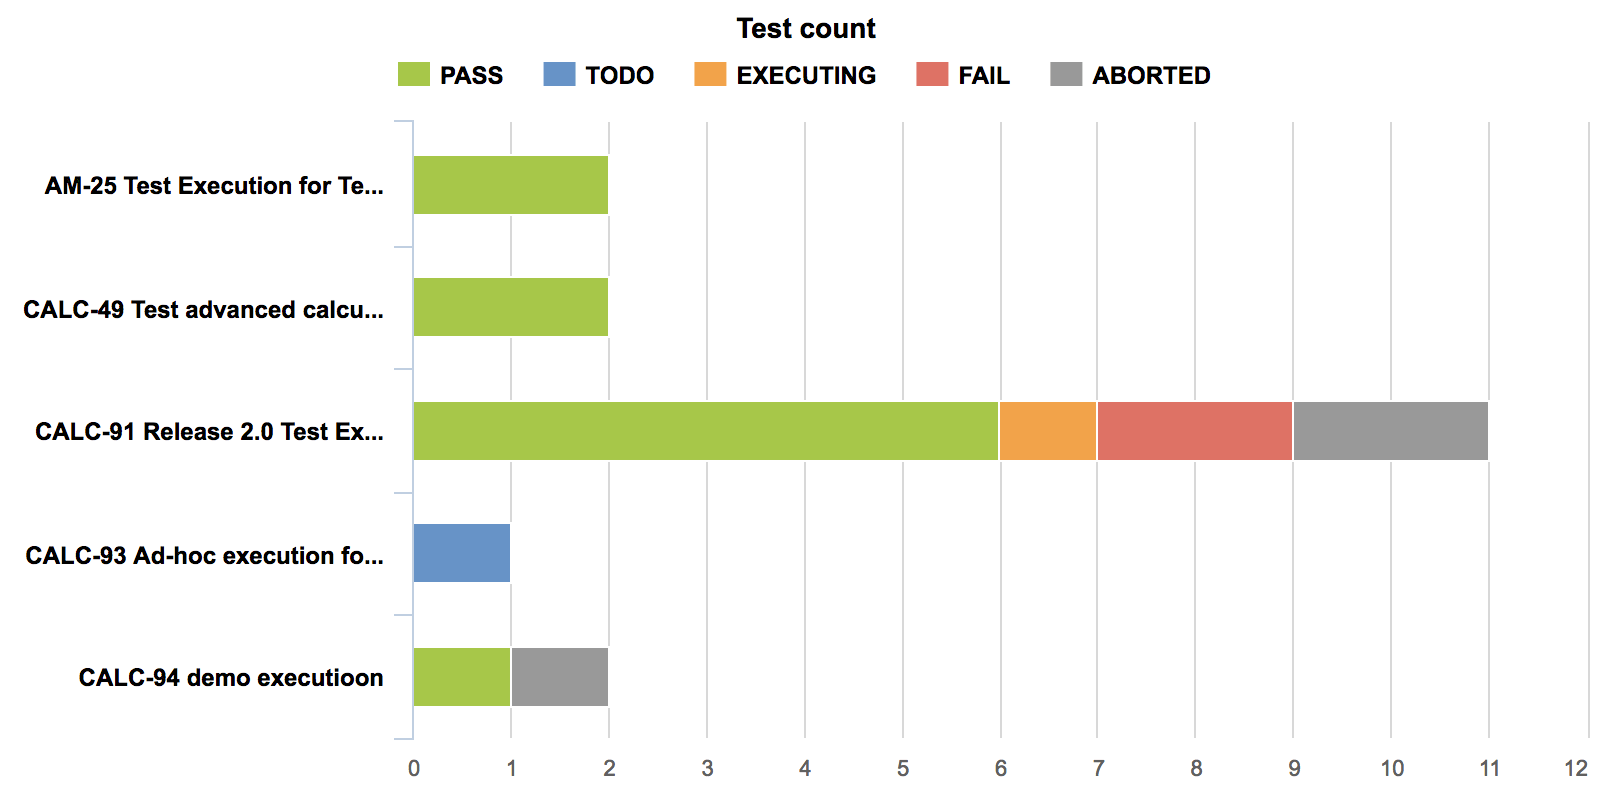
We are constantly investigating integration possibilities with other popular Jira add-ons. Now eazyBI supports data Xray for Jira is a complete, full-featured test management add-on for Jira. Now you can use the power and flexibility of eazyBI to squeeze out every bit of information about created, scheduled, running, or completed tests and the number of defects.
Category Hierarchy Level for Projects and Statuses
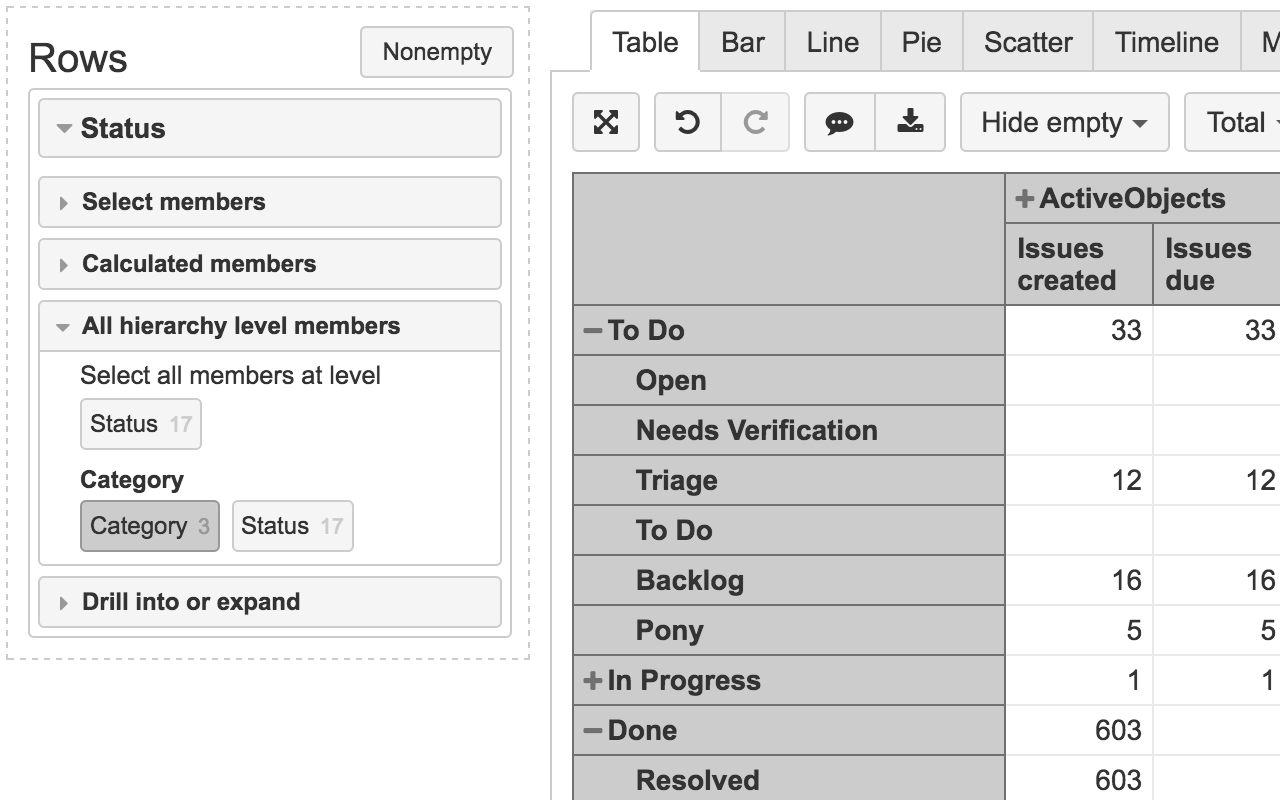
Different teams in your company might use different sets of issue statuses, describing the same stages of your business process. It makes status reporting complicated. Now, with the additional Category hierarchy level, you can make faster and simpler reports to check issues in to-do, in progress, or done status — no need to select all corresponding individual statuses. Similarly, you can analyze your projects by a project category.
eazyBI Usage Statistics
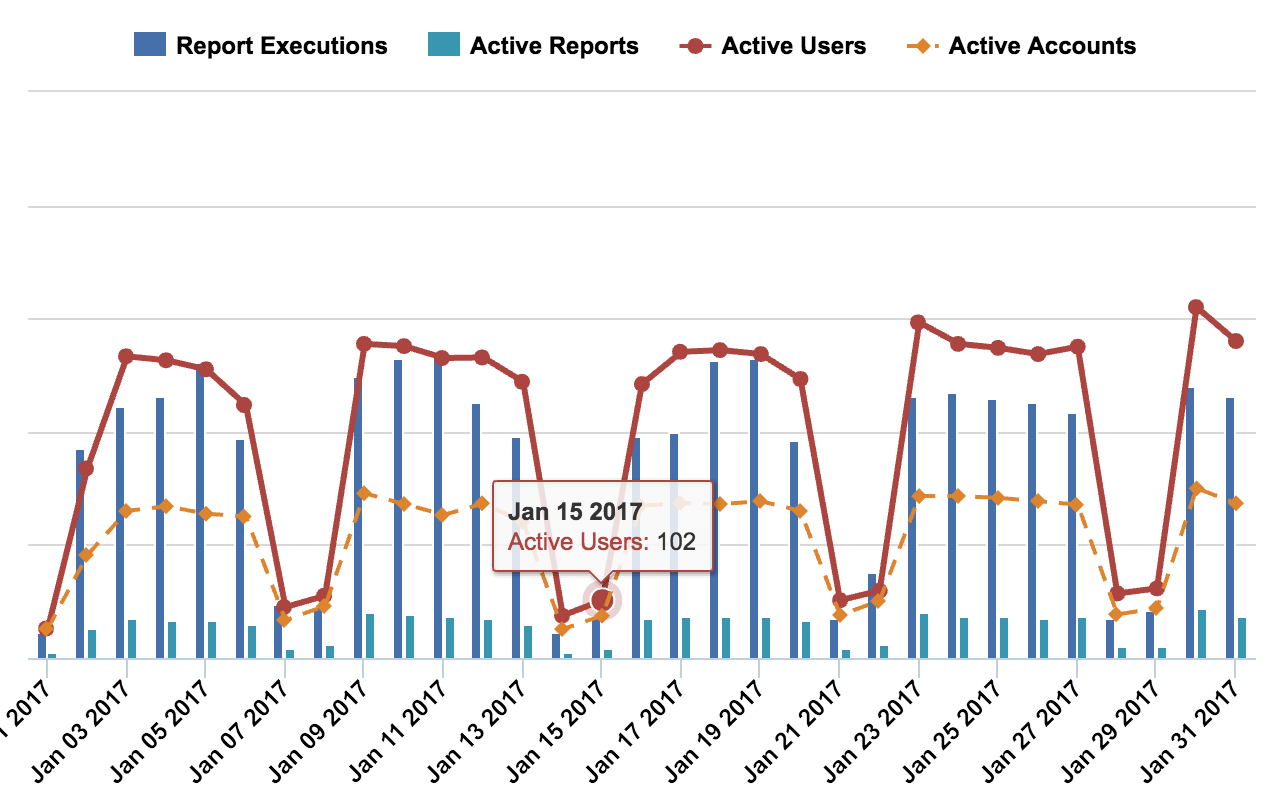
eazyBI Usage statistics is an optional feature available in eazyBI for Jira Server and eazyBI Private server. You can enable it in advanced settings. Analyze how your eazyBI reports are used, which reports are viewed most, and which are running slow. For example, you can see an overview of daily, weekly, or monthly eazyBI usage, most active users, top executed reports and dashboards, reports with errors, or slow reports.
