
Learning MDX with eazyBI Learning Center
If you are already using the eazyBI Learning Center, you have likely built several reports using dimensions, measures, and filters. You know how far you can get with drag and drop — and you may also have reached the point where standard measures are no longer enough. This is usually the moment when you realize you need your own, specific custom calculations.
This is usually when MultiDimensional eXpressions (MDX) start to appear.
You might find different MDX calculation examples in documentation, community answers, or existing reports, and wonder what role calculation plays and where it actually makes sense to use it. The good news is that MDX in eazyBI is not a separate skill you need to master all at once. It is a natural next step to extend reports you already understand.
The learning how to write your custom calculations in the eazyBI Learning Center is built for exactly this stage — when you already trust eazyBI and the learning format, know the basics, and want a structured way to add MDX calculations without guessing or breaking reports.
Across these three MDX courses, you work through 20 focused lessons. Each lesson introduces one concept at a time — such as the formula editor, tuples, or aggregating dimension members — helping you understand how calculations work in eazyBI and how to apply them safely in real reports.
You work with practical examples, not abstract formulas. The goal is to help you understand why a calculation works and when to use it — not just how to write it.
The goal is to help you understand when a custom calculation is needed and how it works — not just how to write it.
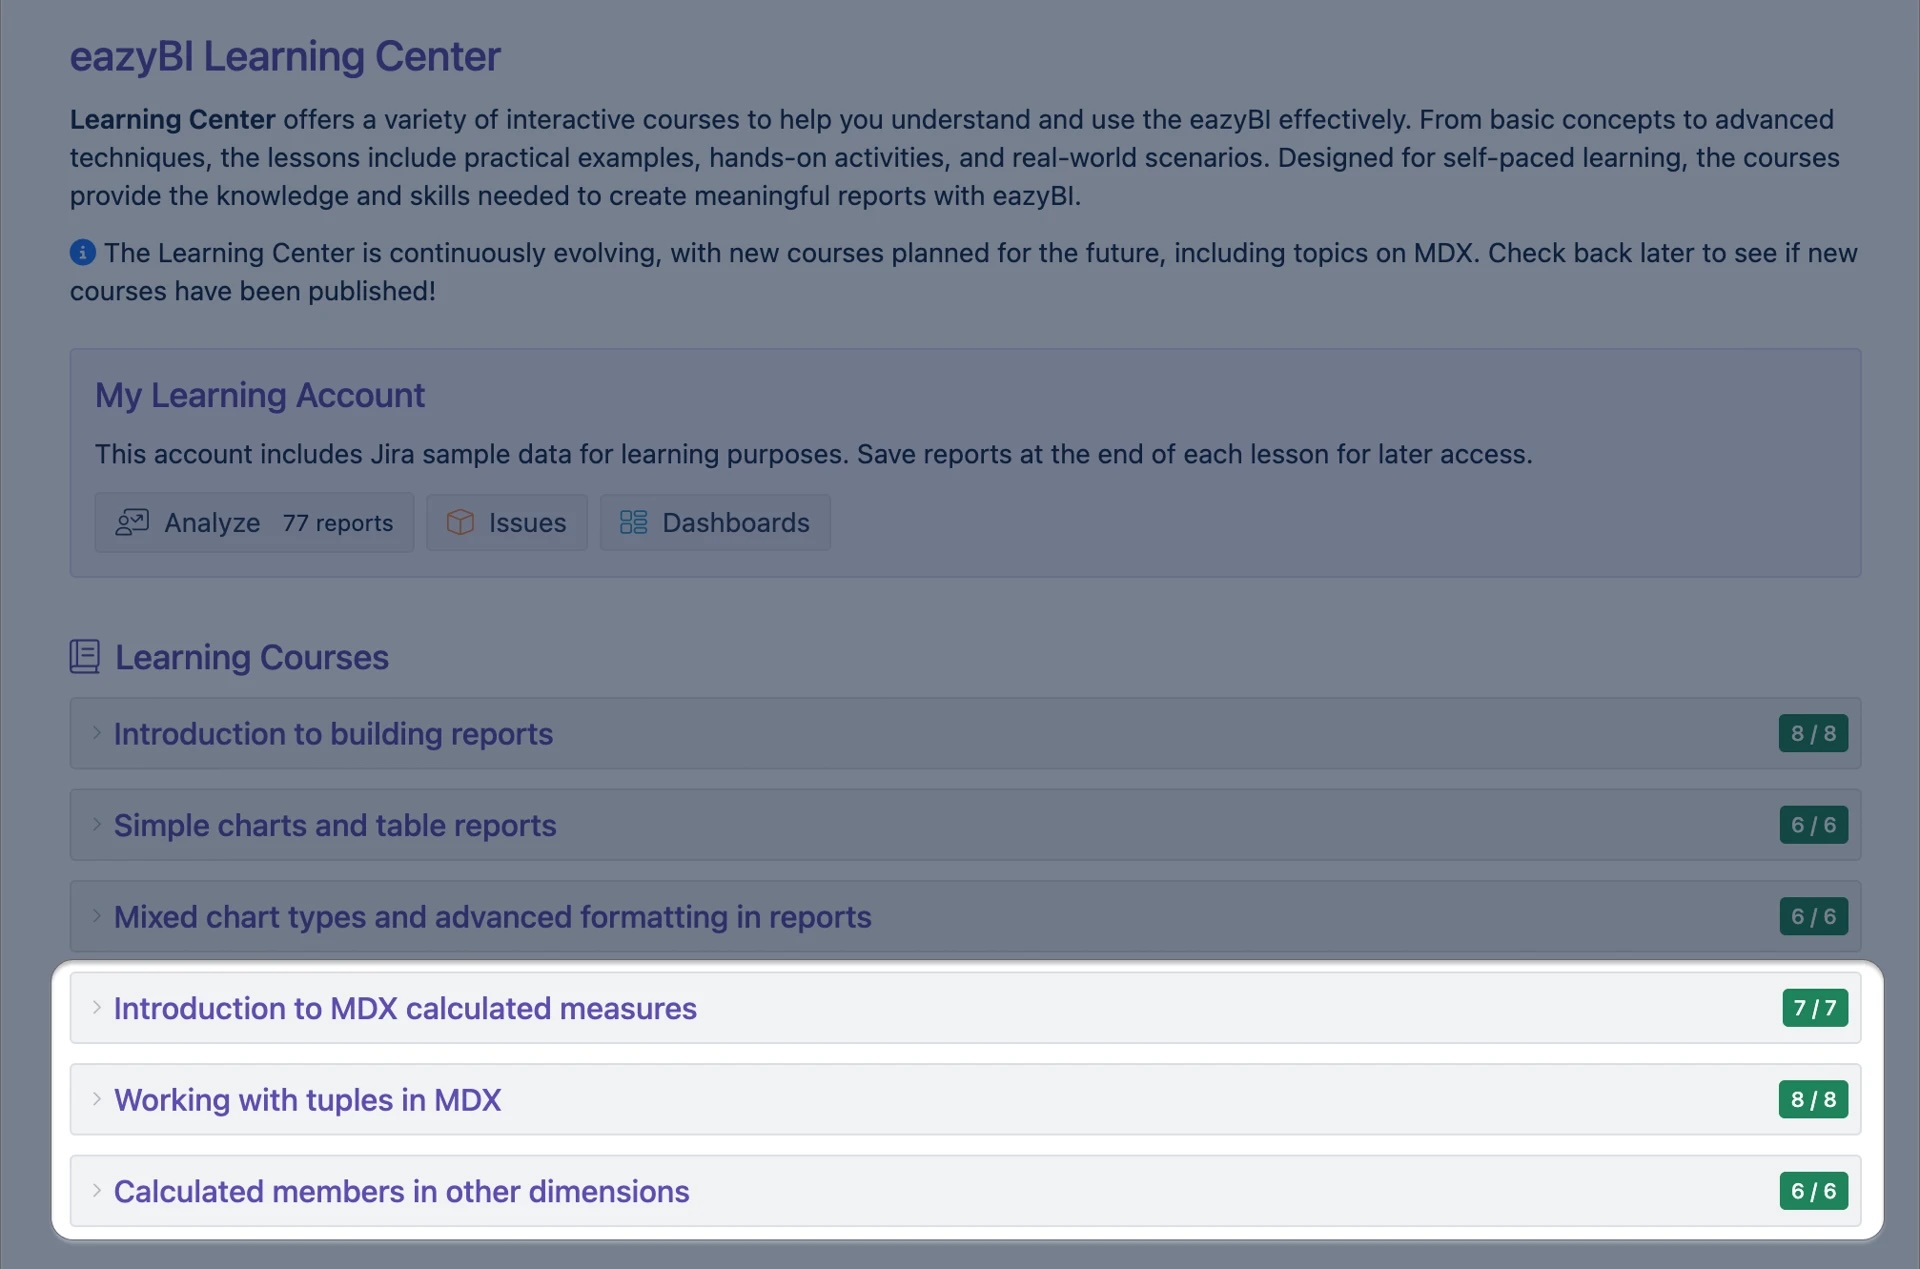
Introduction to MDX Calculated Measures
The first MDX course focuses on creating calculated measures in eazyBI and understanding how calculations behave in reports. You begin by adding standard calculations without writing MDX, then gradually move to using the formula editor to create your own calculated measures.
Along the way, you learn how to reference measures and dimension members, apply formatting, and handle common edge cases such as division by zero. The course also introduces tuples, showing how they are used inside calculations to control context and return precise results.
In the Original estimated vs. Hours spent on resolved issues lesson, you build a report that compares original time estimates with actual hours spent on resolved Story issues, showing the monthly difference. Wrapping up the lesson, you use this calculation in a report and notice how it adapts automatically for each month, and even use color formatting on that.

Working with Tuples in MDX
Another course is dedicated entirely to using a powerful MDX construction — tuples — in calculations. You learn how to combine members from different dimensions and then use tuples in different arithmetical operations.
Practical examples focus on real reporting scenarios, such as comparing all issues with unresolved ones, analyzing how many issues are bugs or have the highest priority, or calculating average story points in the backlog. These lessons help you understand why a calculation returns a result and how to adjust it when the context changes.
In the Logged hours by user on assigned and unassigned issues lesson, you create a report that compares the hours an assignee spent on their own issues with hours logged across all issues in Jira, including work done for others or on unassigned issues. You learn how to use MDX tuples to change calculation context inside a measure — matching members across dimensions, working with the current row context, and removing filtering when needed.

Calculated Members in Other Dimensions
The final course extends MDX beyond measures to dimensions themselves. You learn how to create calculated members in dimensions, like reorder and group members in the Priority dimension, retrieve specific member sets based on dates or text patterns, and apply filtering functions.
These lessons introduce working with properties, dates, and text-based filtering. This allows you to reshape dimensions when needed — for example, showing only major releases or creating custom groupings for analysis.
In the Work Days member in the Week Day dimension lesson, you create a report that shows issues created and resolved by weekday, using a calculated Work Days member to group Monday through Friday into a single view. This technique is useful for building custom groupings for report filtering.

The Next Step in Your Reporting
Creating new custom calculations with MDX does not replace the drag-and-drop report builder — it complements it.
We created those courses to help you learn MDX step-by-step with short lessons and examples that build on what you already know.
We hope that by the end of these courses, you will understand how MDX works. Whether you write the formula yourself or ask our AI assistant to generate it, you will know what the calculation is doing and be able to evaluate whether the result truly fits your report.
Learn how to start using the eazyBI Learning Center in our documentation.