

eazyBI 5.0 Release Notes
From major platform and library updates to new standard calculations. From account administration, to user interface and usability improvements. Here’s what’s new in eazyBI 5.0.
We’ve been working on this release for quite some time now. Most changes took place under the hood. This release is an important milestone for the future updates, compatibility, and development of eazyBI.
You can watch the eazyBI 5.0 announcement and demo in the keynote presentation by Raimonds Simanovskis at the eazyBI Community Days in Riga:
Platform and Libraries Updates
This is a major version update for a reason.
Atlassian is updating Jira and Confluence versions to Jira 8 and Confluence 7. These new Atlassian software updates include several fundamental changes and caused some core incompatibilities for eazyBI.
We’ve updated a majority of our internal libraries and platforms. Our goal was to make eazyBI compatible with current and upcoming Jira and Confluence versions. Now eazyBI supports both Java 8, Java 11.

We updated JRuby — the Ruby programming language implementation on top of JVM. The updated latest version now supports the latest JVM versions.
We’ve also updated the underlying Ruby on Rails framework and the Mondrian reporting engine. This ensures compatibility with other latest libraries.
Although these changes are not visible, they will help us adapt more easily to support underlying eazyBI platform and upcoming Jira version updates.
With eazyBI 5.0 we’ve dropped the support for the old Jira version 6. We are still supporting Jira from version 7.0 until 8.0, including the latest 8.2 version.
New User Interface for Measures and Dimensions
Measures Selection
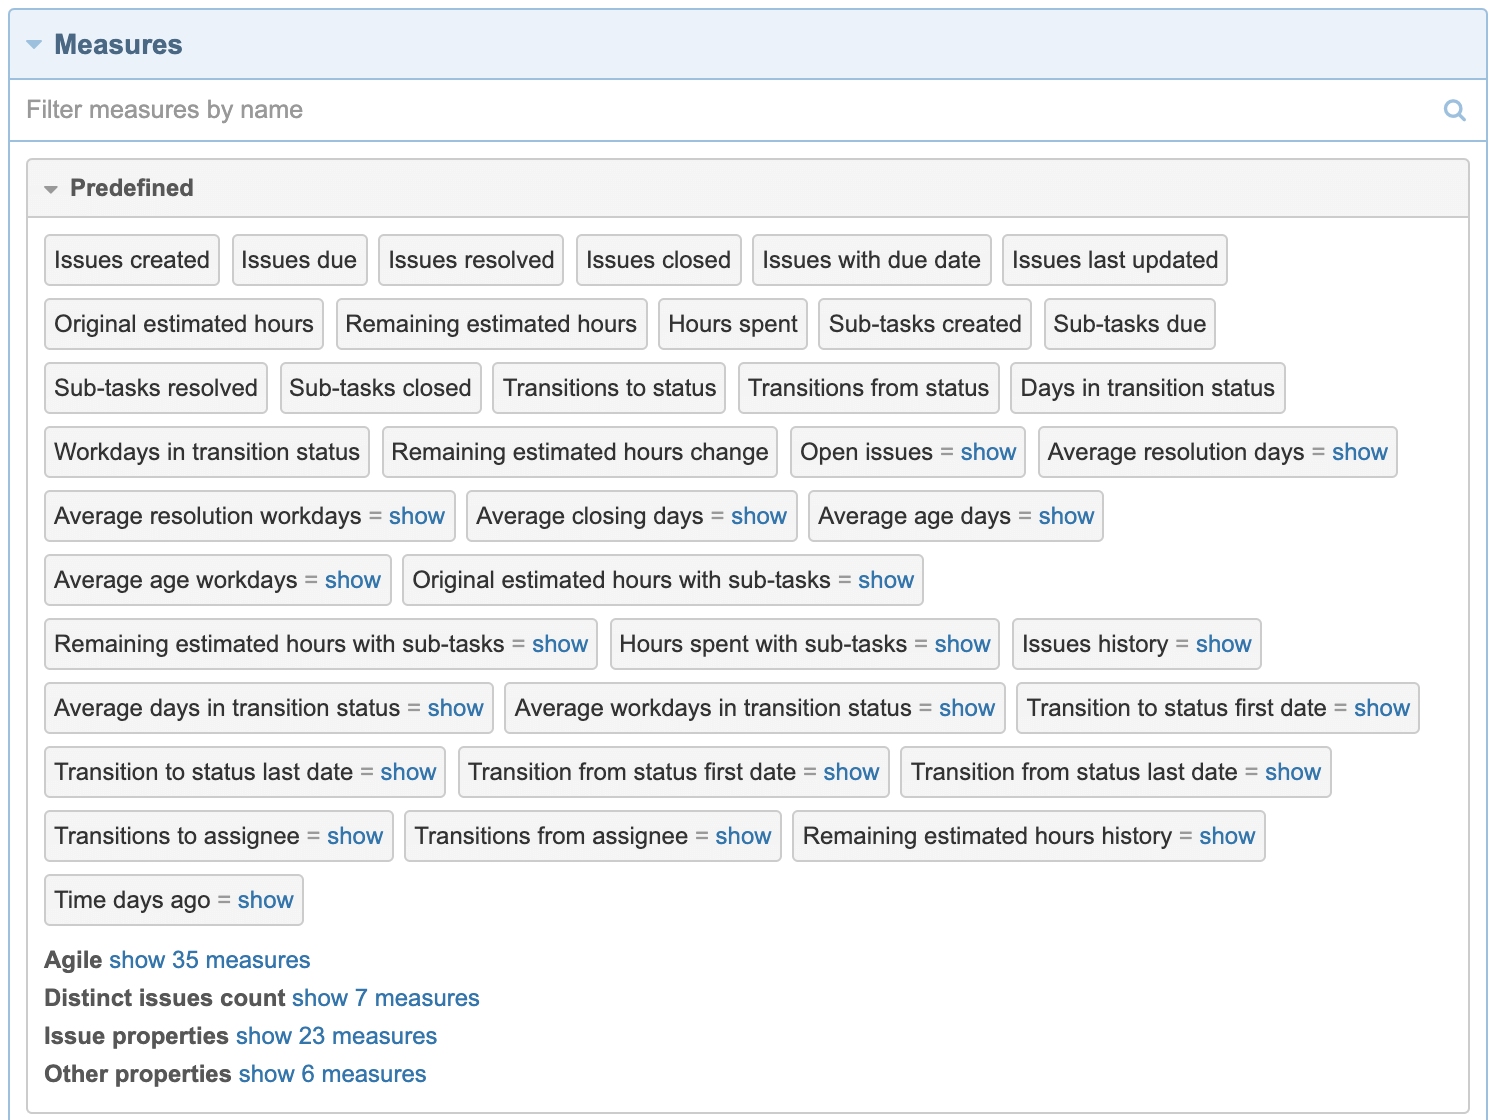
Previously, both the built-in measures and calculated measures were all thrown into one section, grouped in different sub-groups. To find the measure you were looking for, you had to expand all those sections. It was inconvenient.
Now we’re separating measures into two main sections — predefined measures and user-defined measures. In the predefined measures section all pre-defined measures are in one place, grouped by common sub-groups.
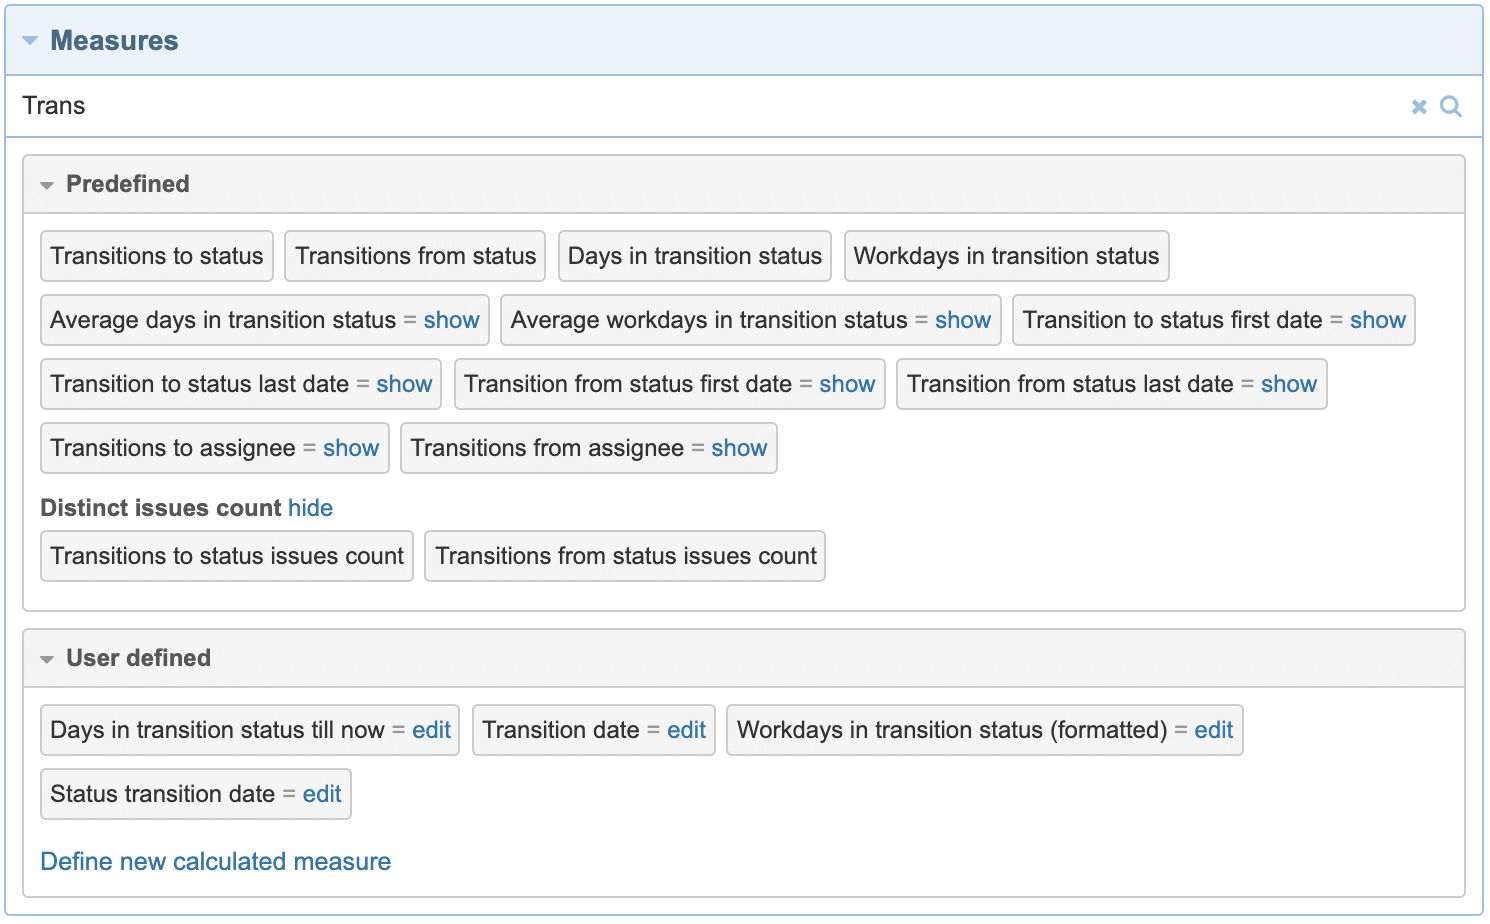
All user defined measures are now separate and users can create their own custom sub-groups.
Filter Measures
Sometimes you’re not sure in which sub-group the measure is stored. Now you can filter measures by name fragments as you type.
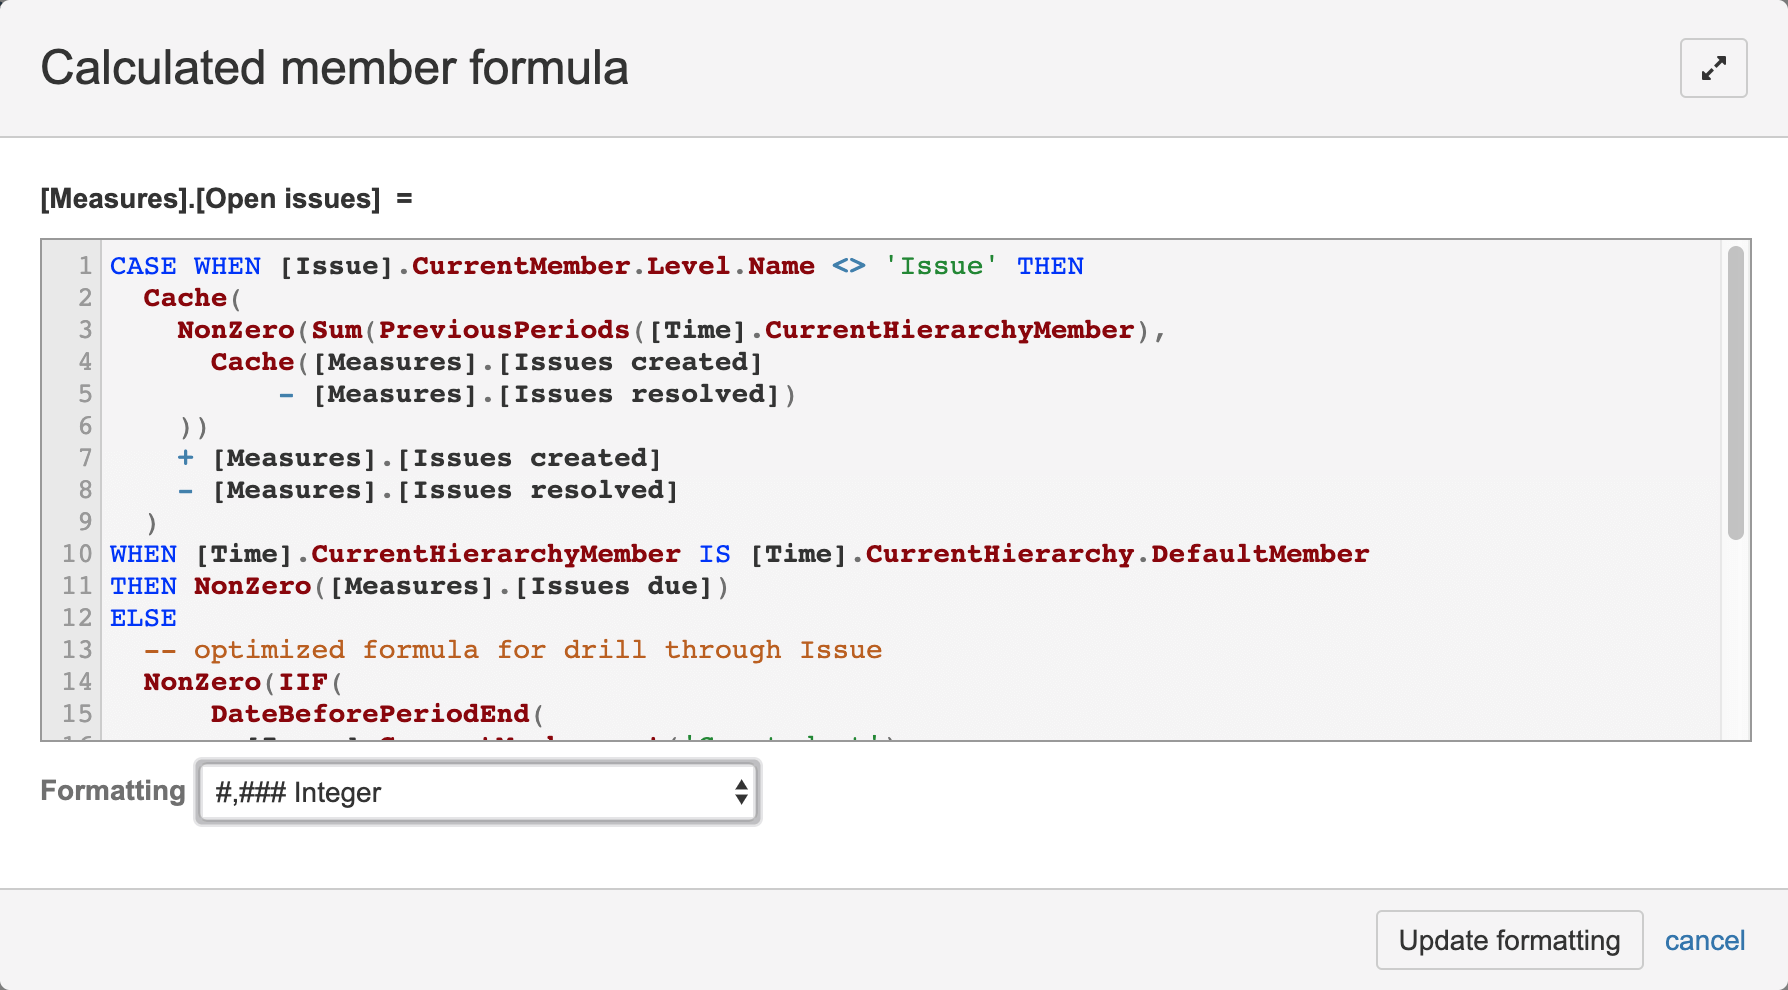
Show Pre-defined Measure Formula
Did you notice those “= show” links next to measures? These are the “show formula” links for pre-defined measures. You can see the calculation formula behind these build-in measures. Although you cannot change the calculation or formula, you can copy and reuse it.
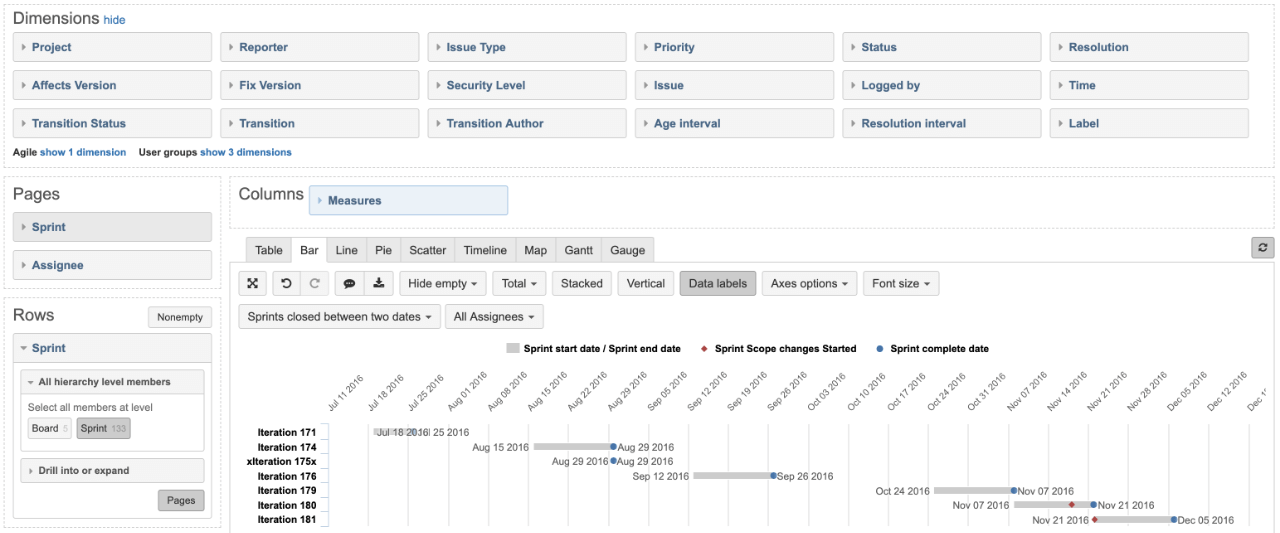
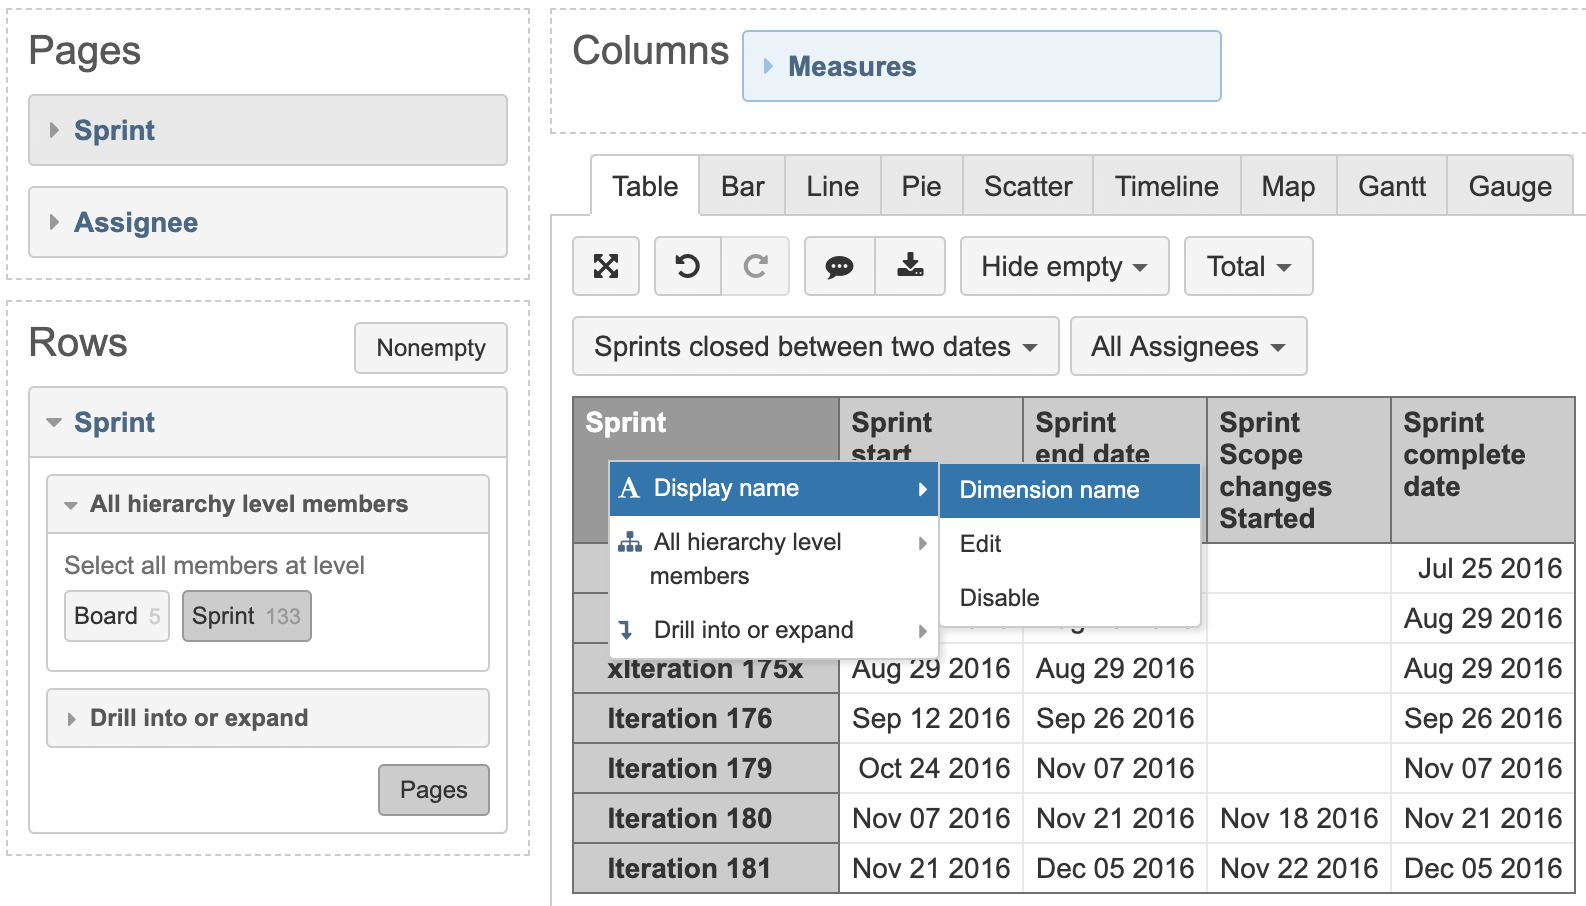
Select Hierarchy Member Level
To select the hierarchy level, you had to expand the dimension block to “All hierarchy level members”. Now you can do that directly from the header.
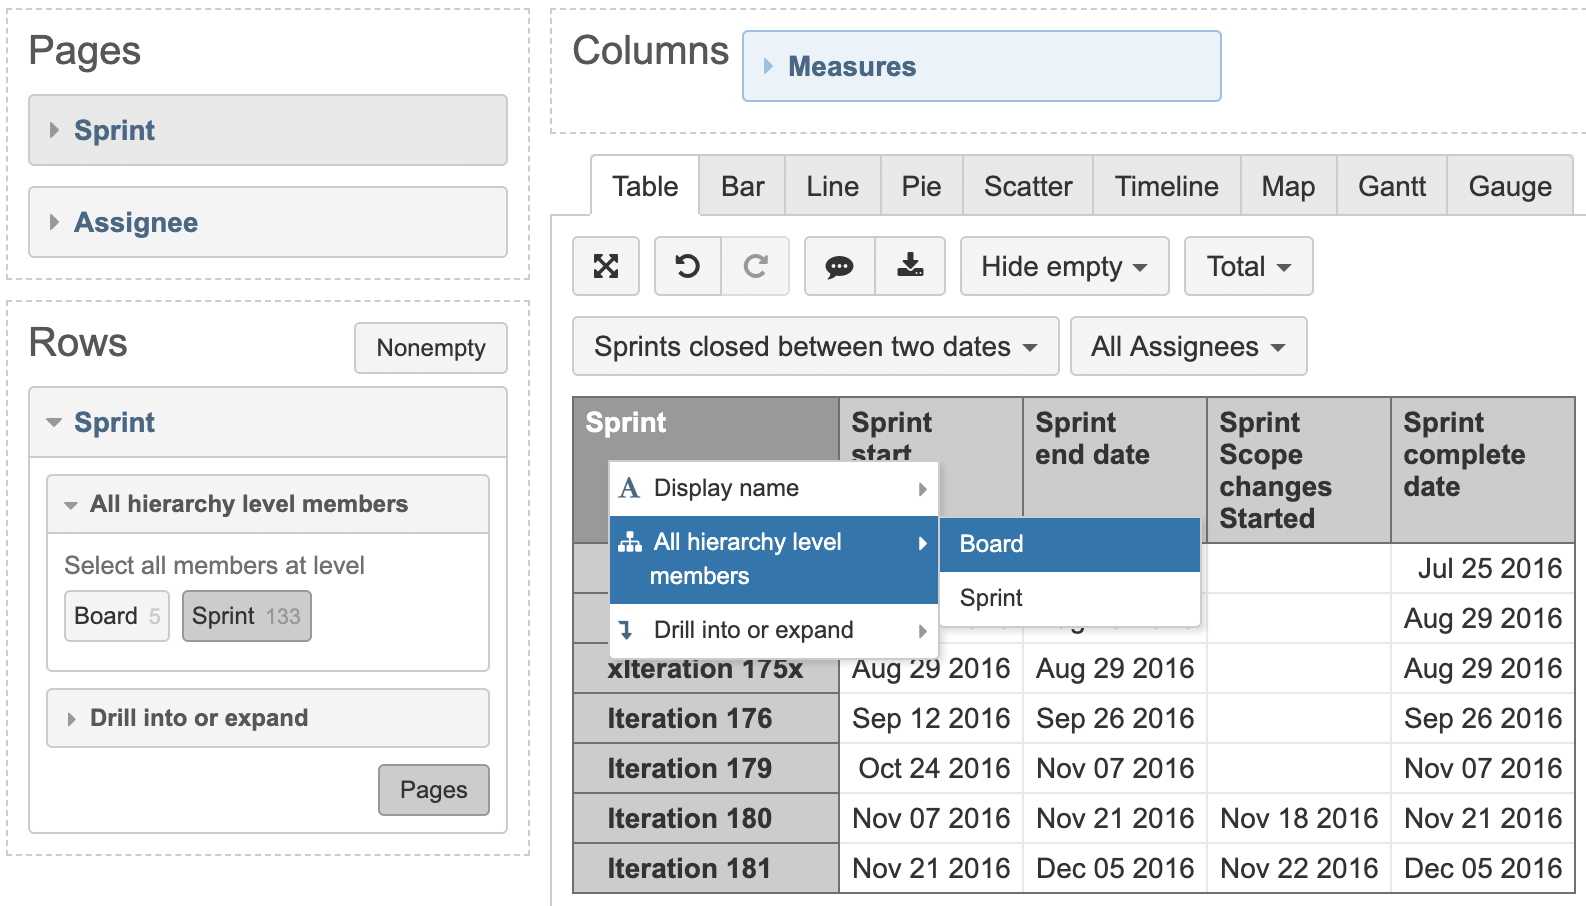
From the same context menu you can also add dimension headers. This feature was introduced in previous versions of eazyBI, but it is well worth reminding.
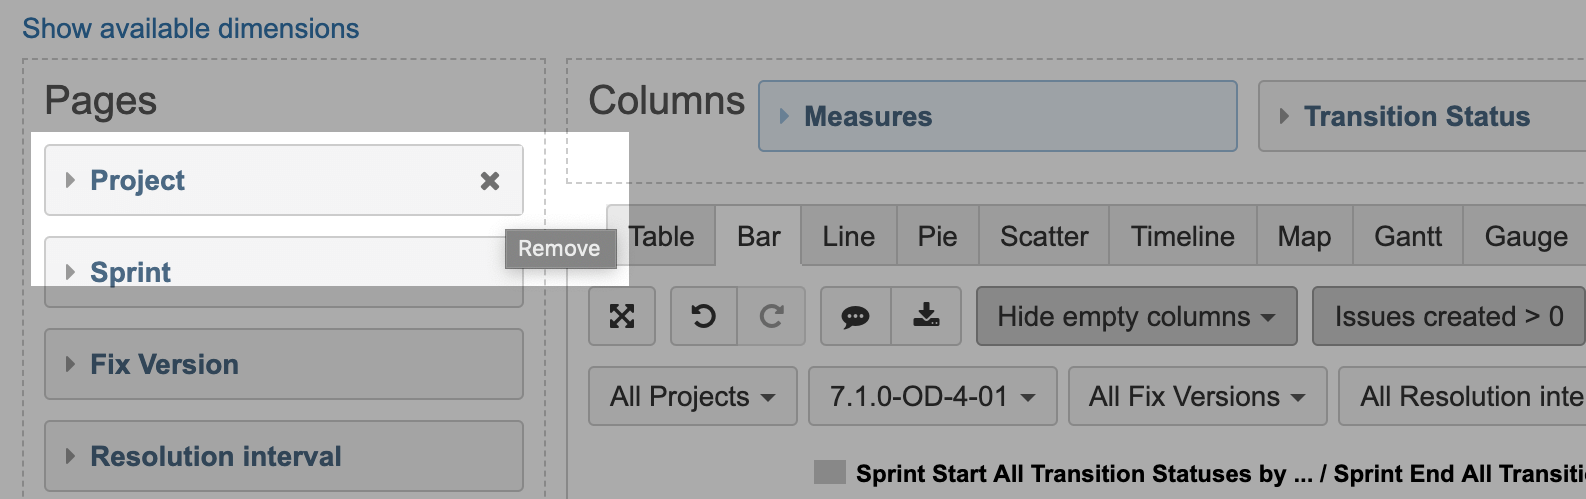
Quickly Remove Unwanted Dimension
You used to have to drag the unwanted dimension away from Rows, Columns, or Pages to the Dimension block. It’s even more inconvenient when the dimension block is hidden. Now you can just remove the dimension by clicking the “x”.
Standard Calculated Measures
We want to make eazyBI even easier. We want you to write less custom calculations. There are many standard cases where you had to use some calculation templates to calculate certain metric. We have created standard calculations like Average, Median, Min, Max, % of total, Cumulative sum, Linear trend. Now you can add this standard calculation to your report with a few clicks.
You can click on the name label of the measure you wish to add the calculation to directly from the chart and select “Add calculated” and then “Linear trend” or any other standard calculation.
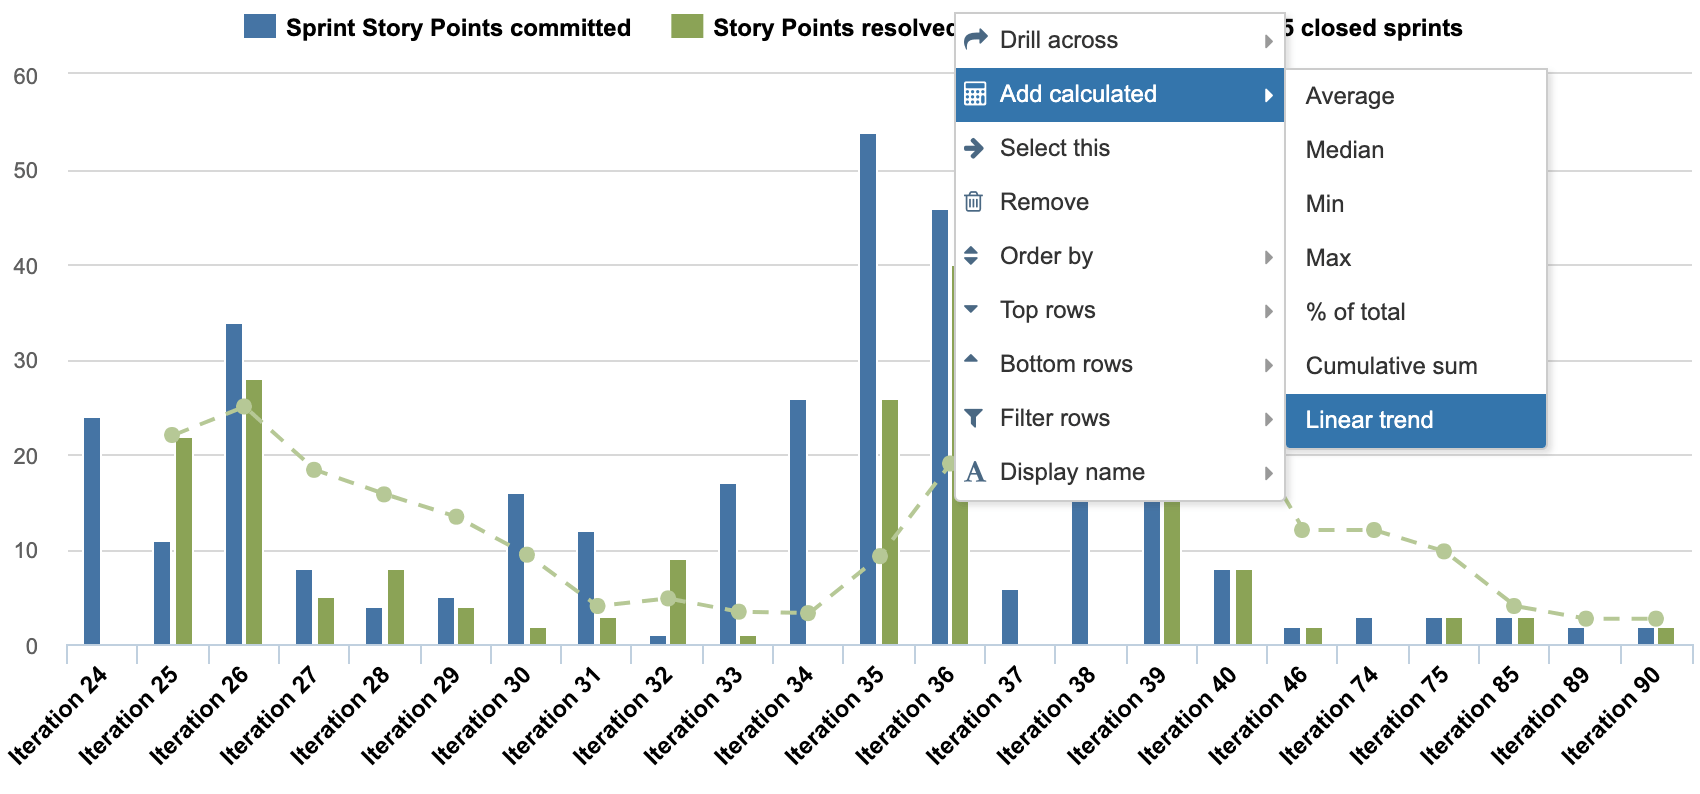
You can also combine some of these calculations, for example, you can combine “Cumulative function” with “Linear trend” by clicking on the name label of the calculated measure.
To avoid polluting calculated measures section with calculations used only in one or few reports, these calculated members will be “report specific” and will not be stored in measures section.
You can also see the underlying formula of these calculated members. When you copy it you can modify it further for this or reuse in other reports.
Dynamic Calculations Using Visible Rows Set
Together with standard calculated measures, there are several new and useful MDX functions available in eazyBI 5.0. The most notable one is the VisibleRowsSet(). This function will dynamically retain members that are visible on Rows. You can now write dynamic calculations based on a set of rows you have filtered in your report.
Write less custom calculations and instead use more generic dynamic calculations that you can reuse in many reports with different sets.
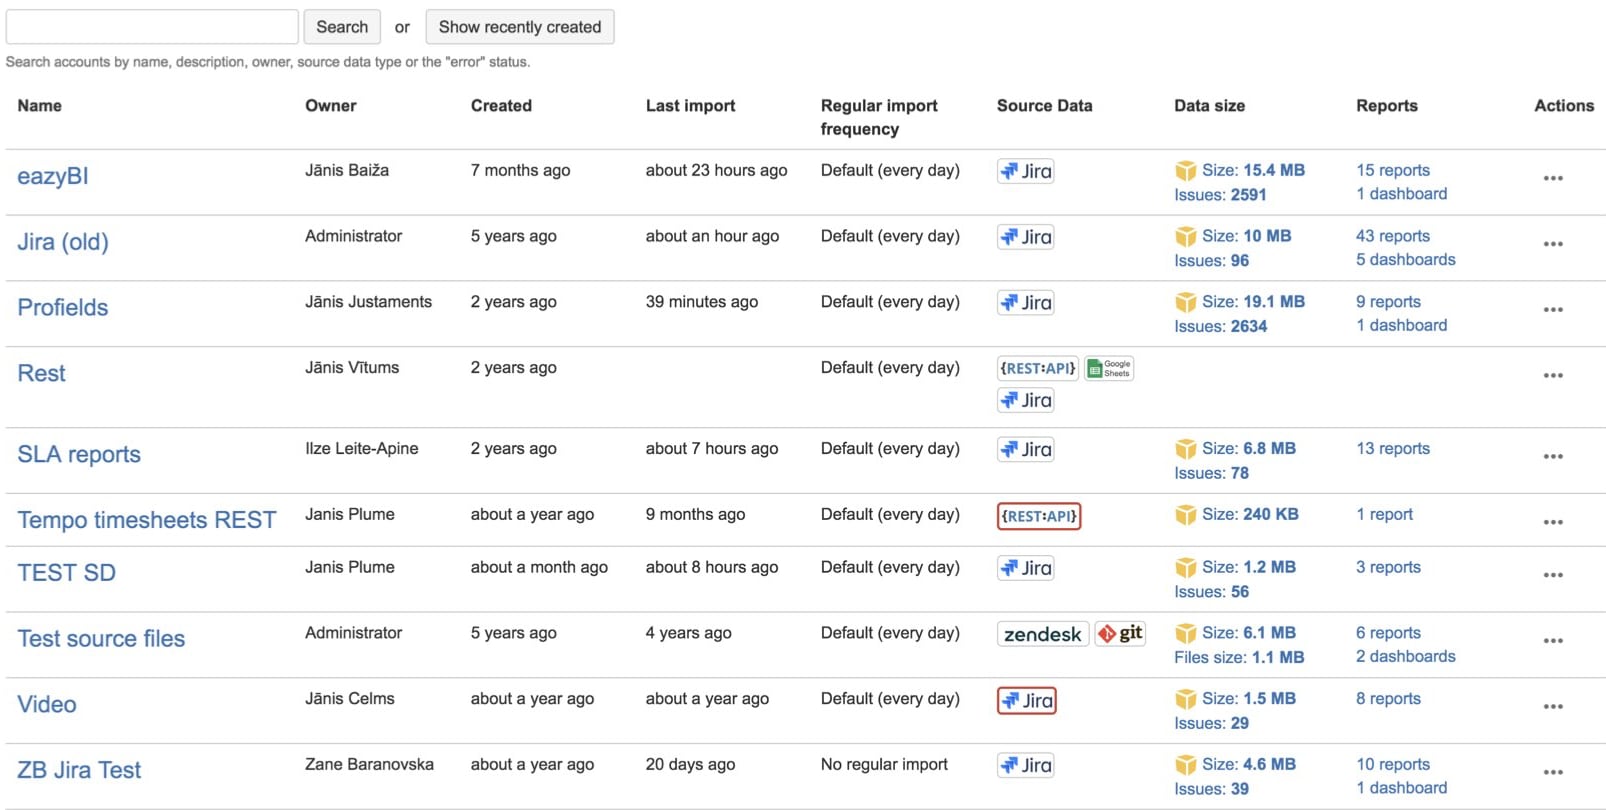
All Accounts Page for Admins
Some customers have many accounts in their eazyBI installations. For admins it’s difficult to understand what are these accounts — how large they are, how many reports, dashboards, who’s the owner, how frequent are the data updates, when was the last data import, what sources are imported, which account imports result with errors.
Now from the updated account administration page, admins can see all accounts and search accounts by name, owner, source data and filter accounts with import errors.
Other updates
There are other small, but nice-to-have improvements, like the “Jira import progress bar“, additional formulas, and other small improvements. You can find more information about this release in the eazyBI 5.0 for Jira change log.