YouTrack reporting that answers real questions
Get consistent dashboards you can trust for standups and reviews. Connect YouTrack with predefined authentication and mapping, import your data, explore sample reports, or start from scratch.
Start Your Free TrialComplete Analytics for YouTrack
Start with the questions your team actually asks. Then answer them with flexible reports, clear visuals, and dashboards that stay up to date on a schedule.

Import All YouTrack Data
Issues, standard and custom fields, state changes, tags, time tracking, and more — across one or many projects.

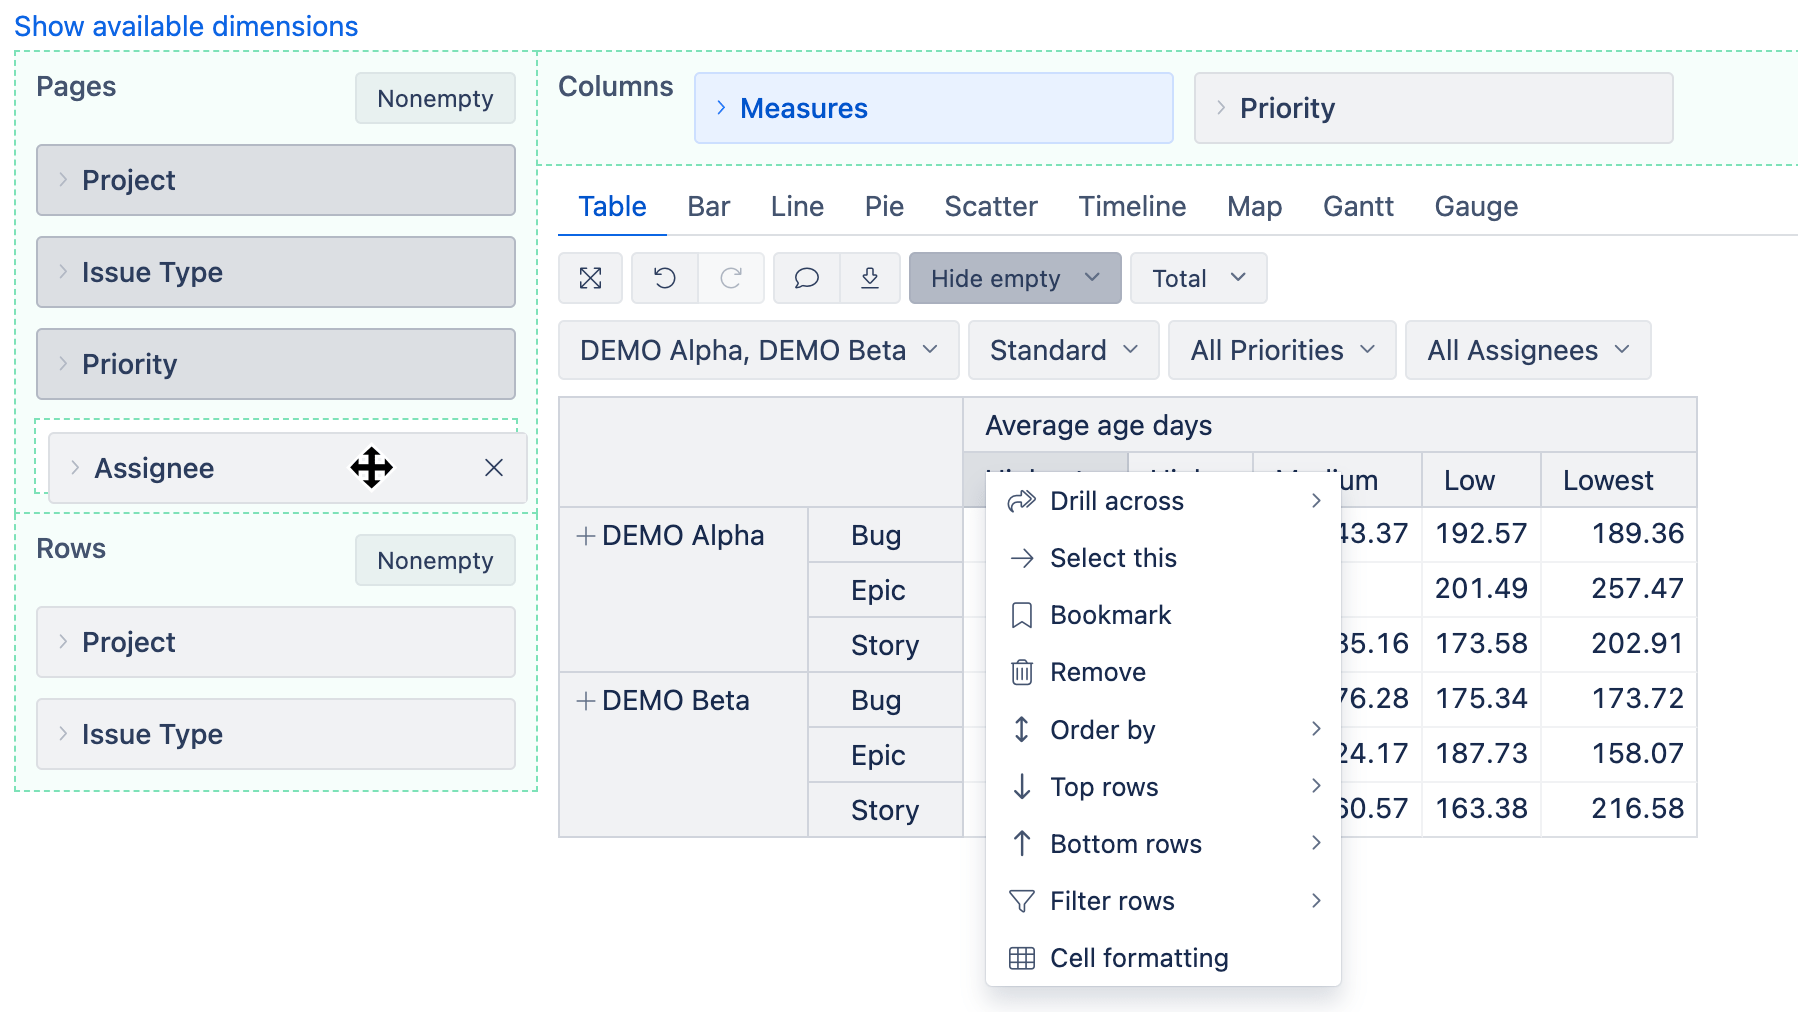
Advanced Data Analysis
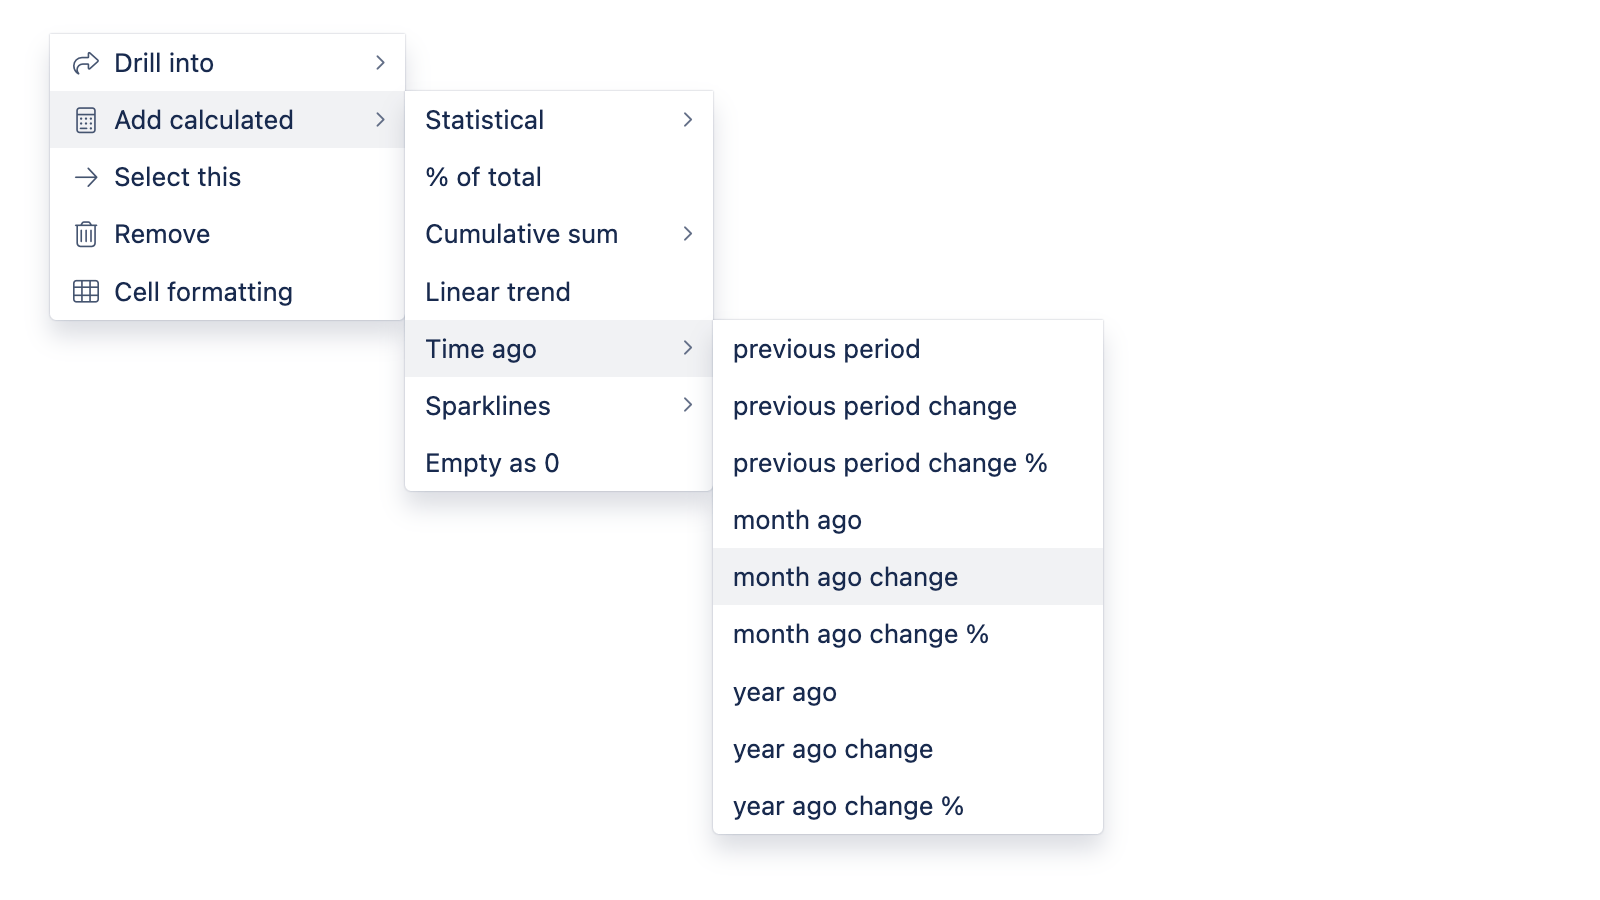
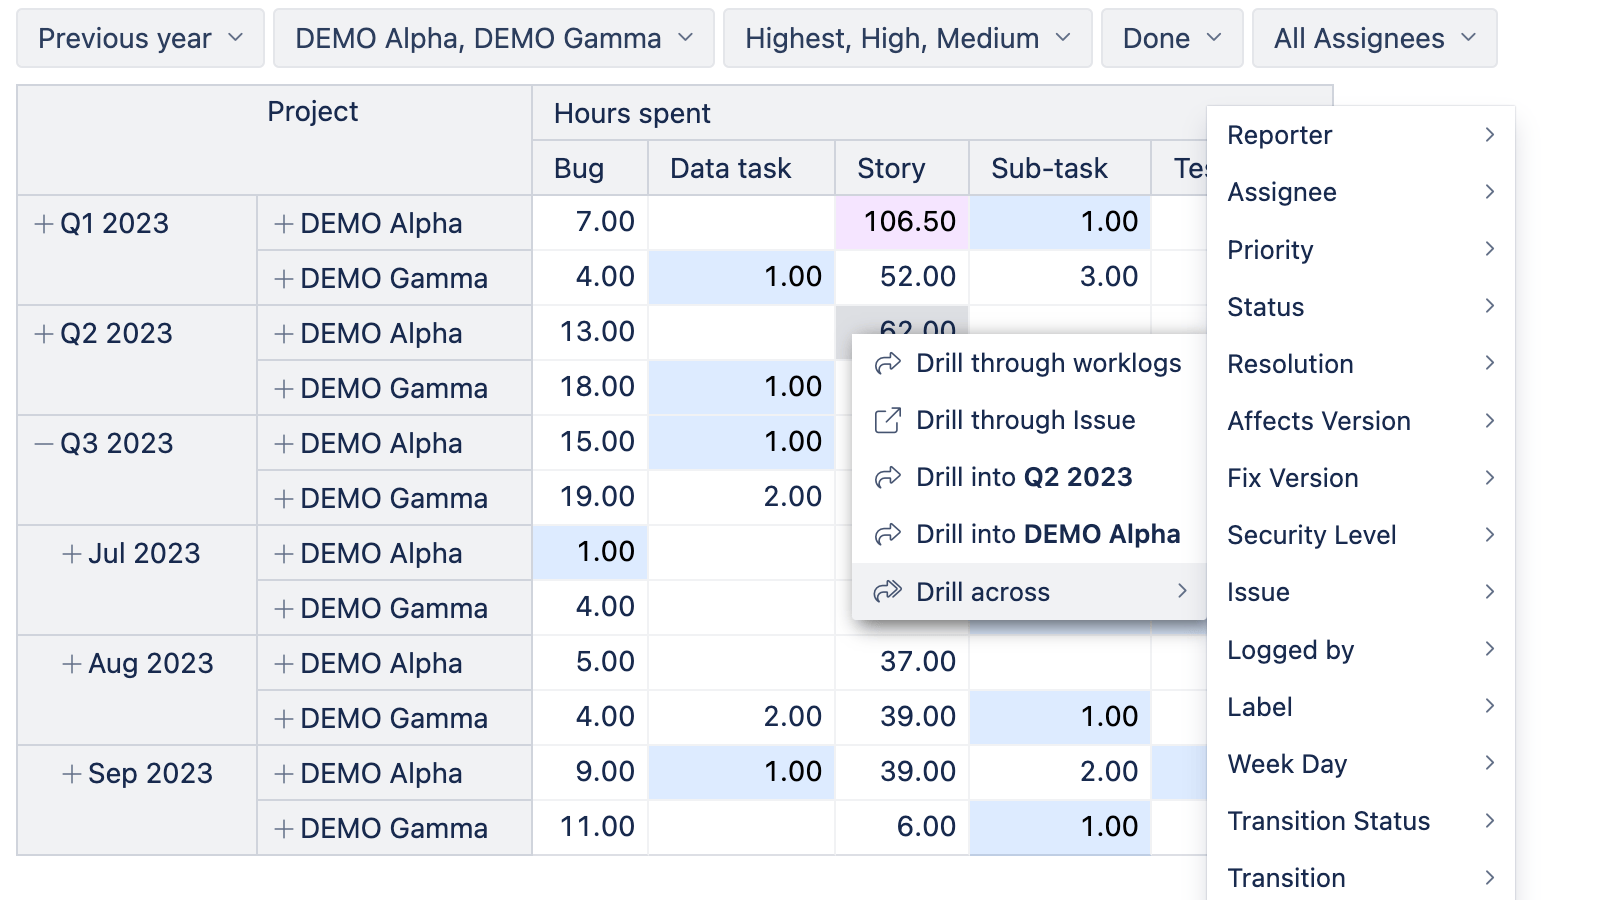
Multi-dimensional pivots, filters, and drill paths for real answers. Optional MDX when you want custom measures.

Visualize & Explore
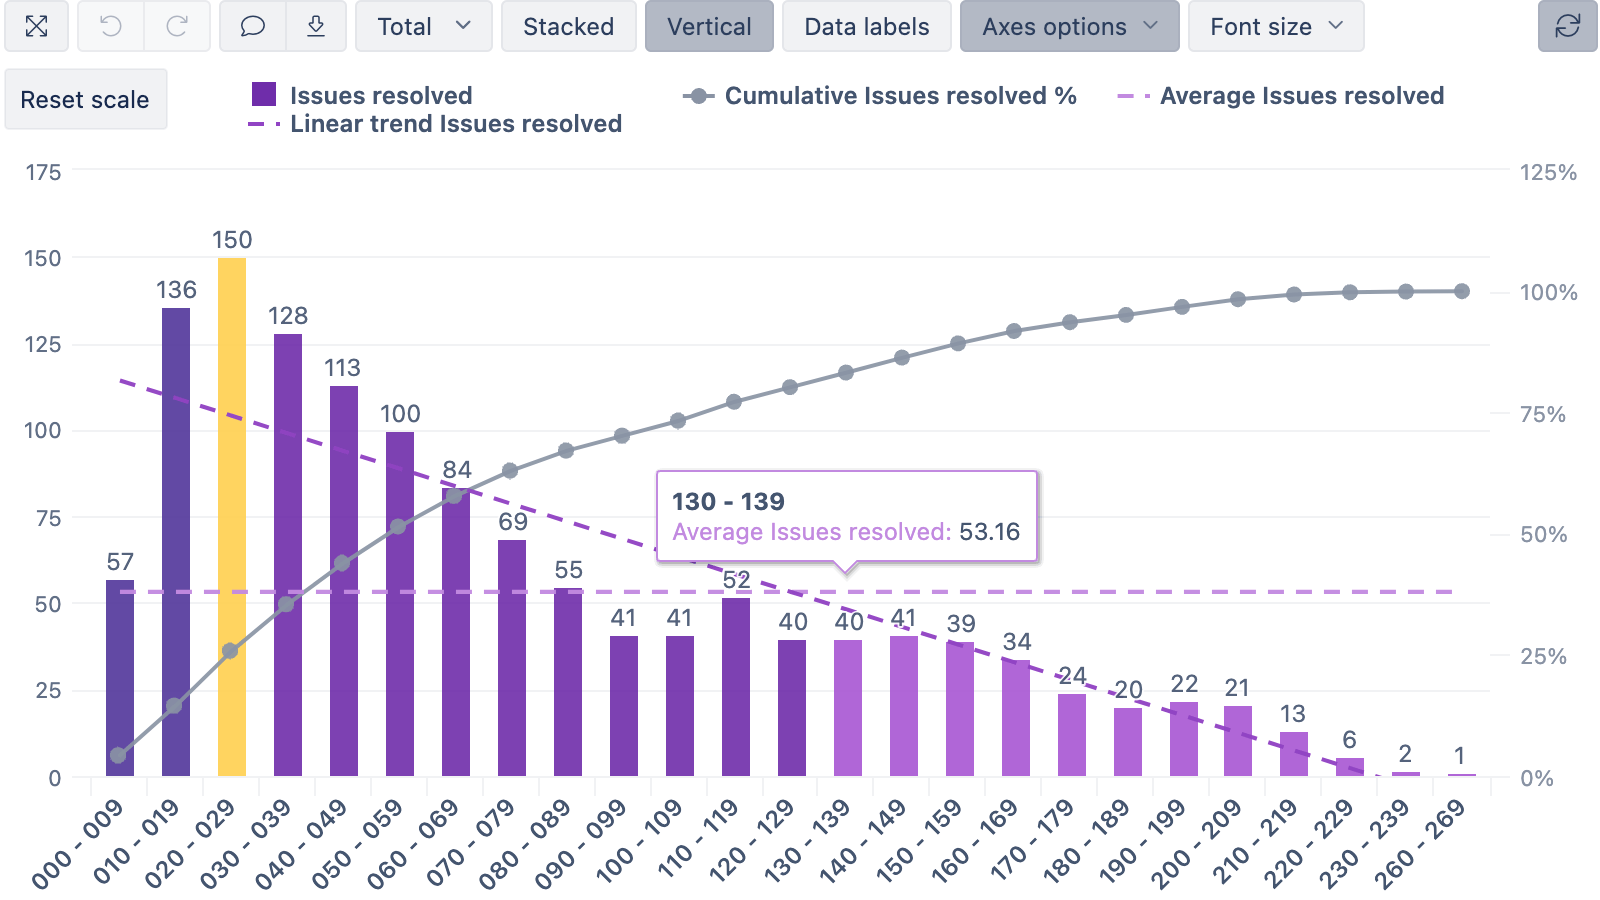
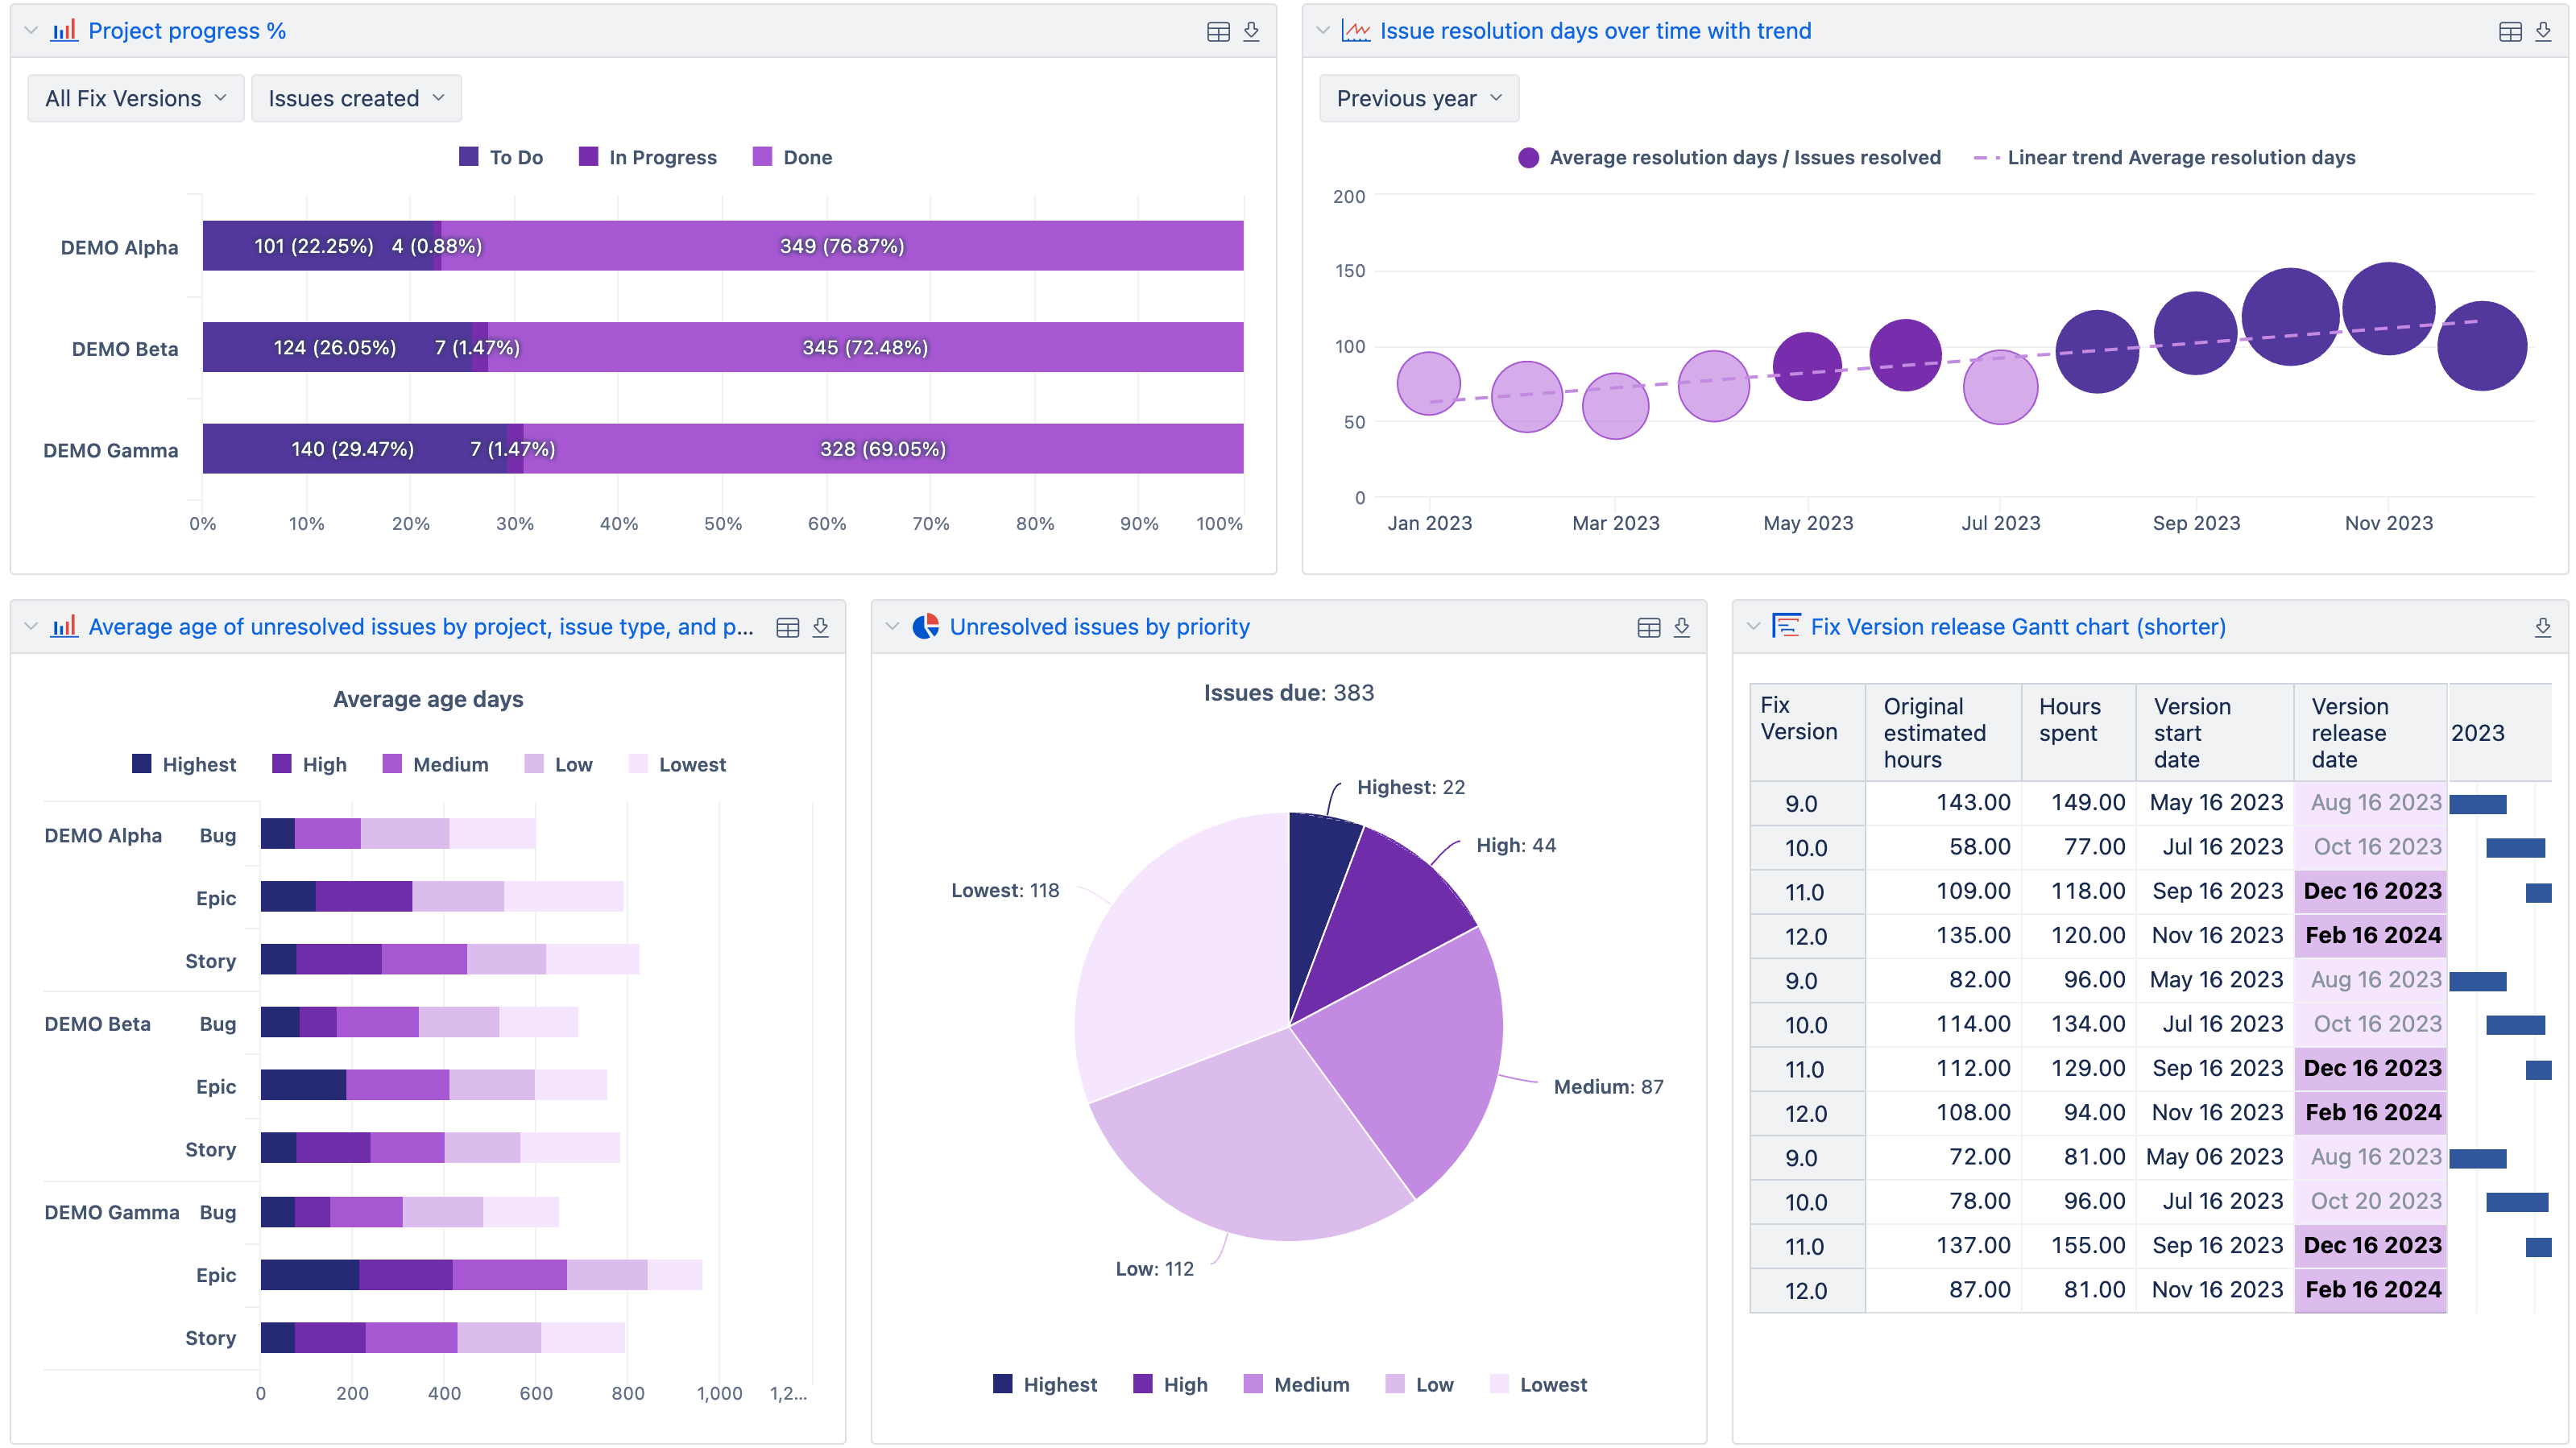
Turn numbers into clarity with chart types for trends, comparisons, and outliers — then dig deeper when something looks off.

Interactive Dashboards
Combine reports into a single view — portfolio overviews, sprint health, throughput, and time tracking in one place.

Automated Refresh
Scheduled imports keep reports current without CSV juggling. Pick a cadence that fits standups or executive updates.

Share & Distribute
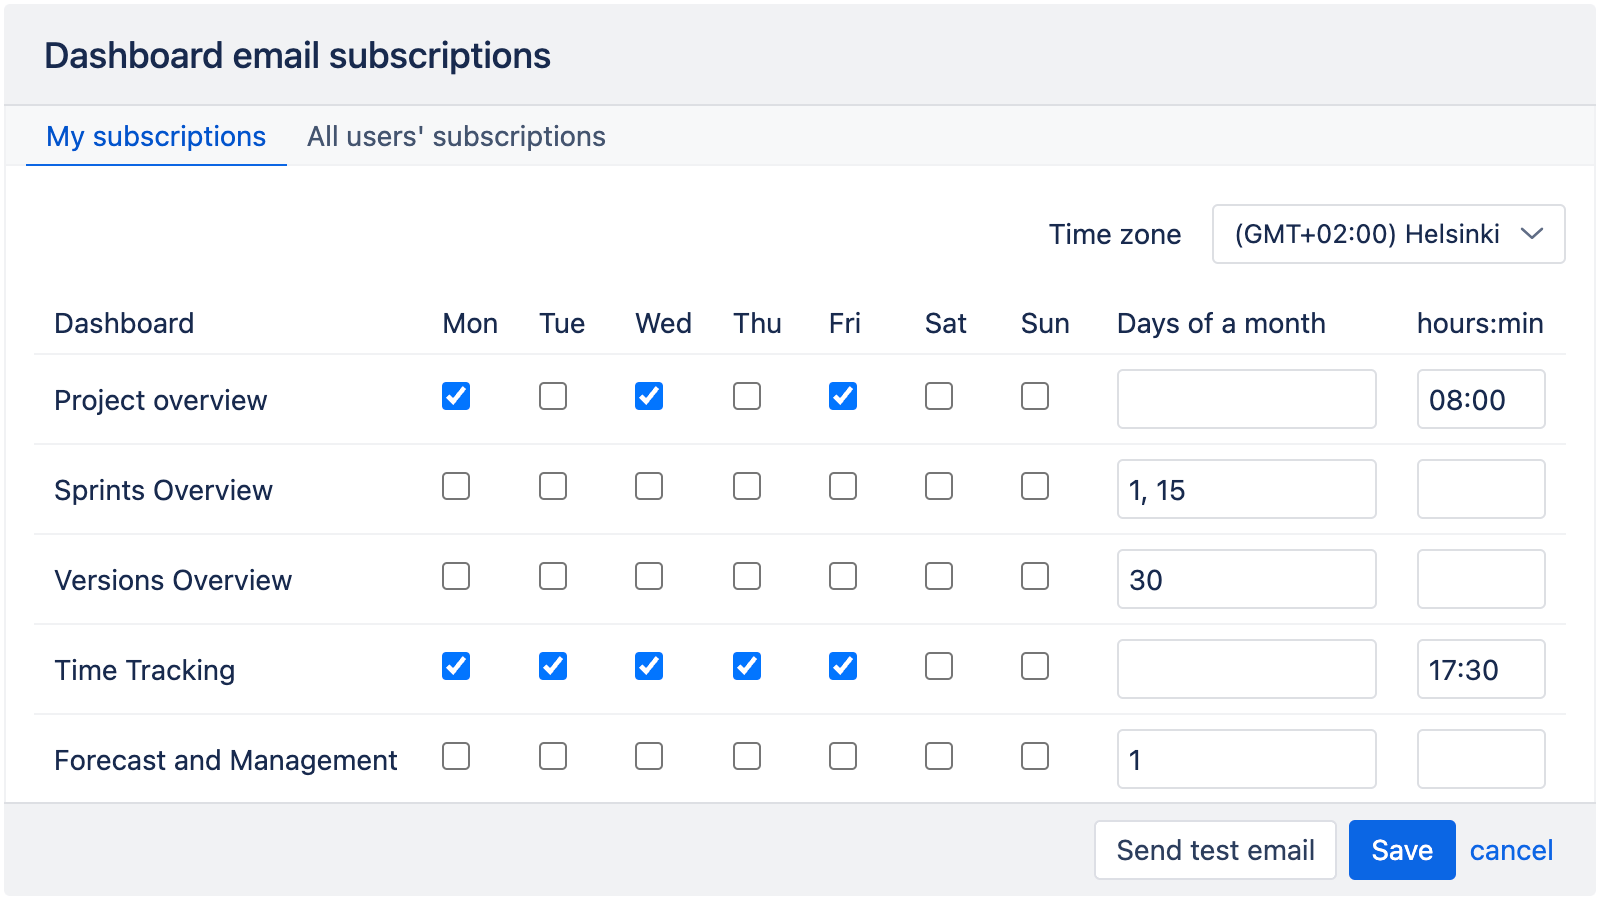
Share dashboards inside eazyBI, export PDFs, or schedule email summaries. Keep stakeholders informed without manual prep.

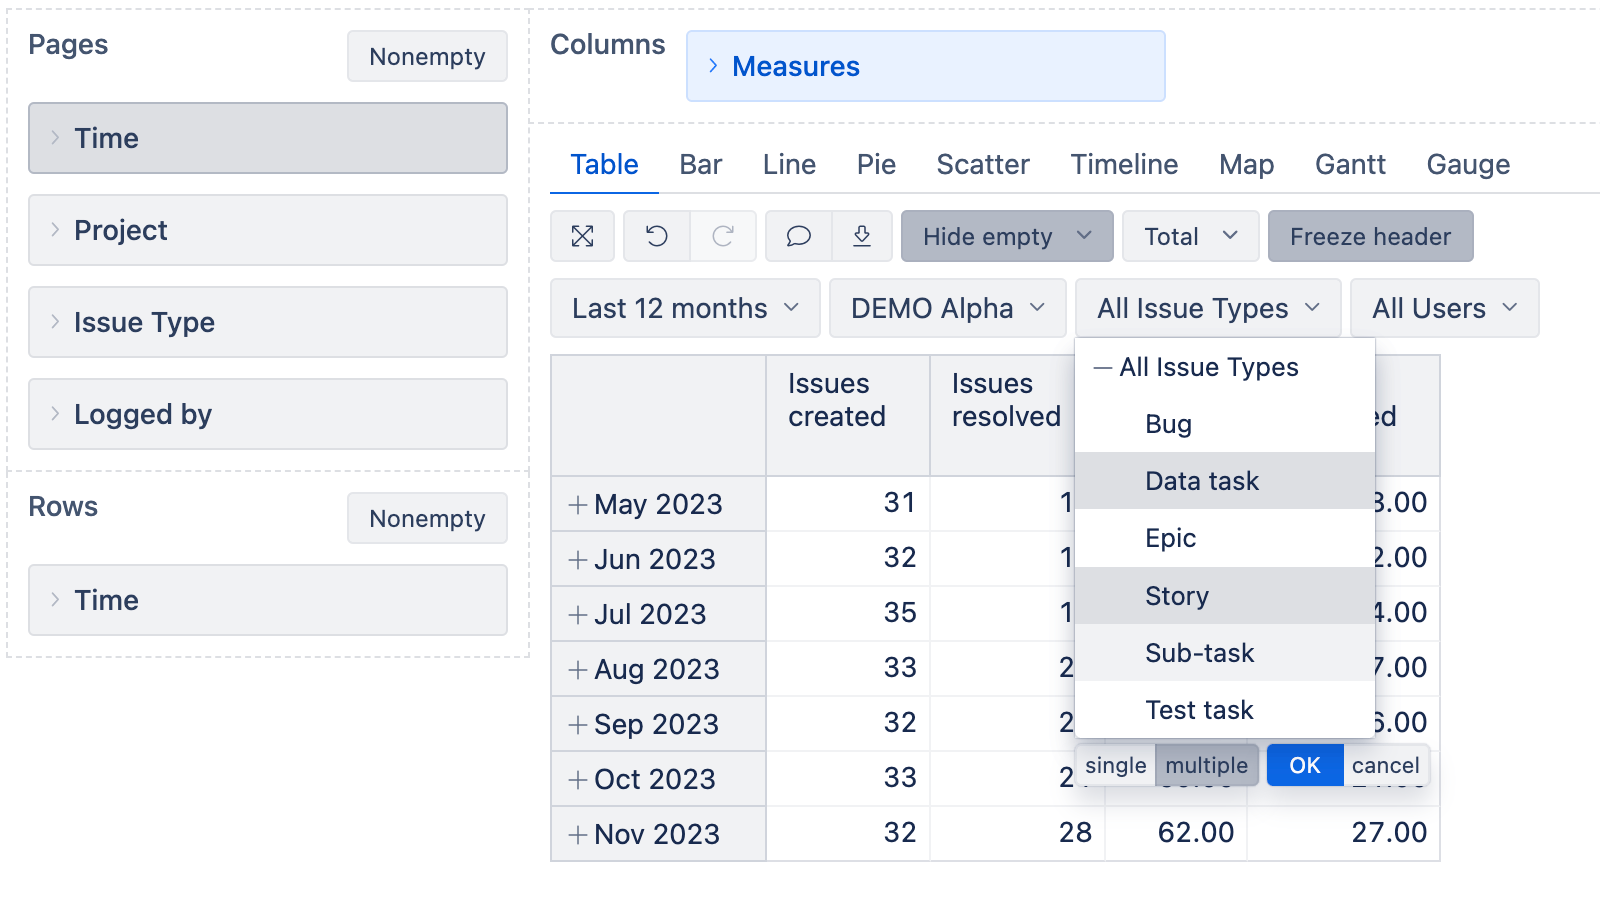
Structure and analyze YouTrack data without spreadsheets. Start simple — rows, columns, filters — and add custom measures when you need them.
Build Custom Reports

Measures & Calculations
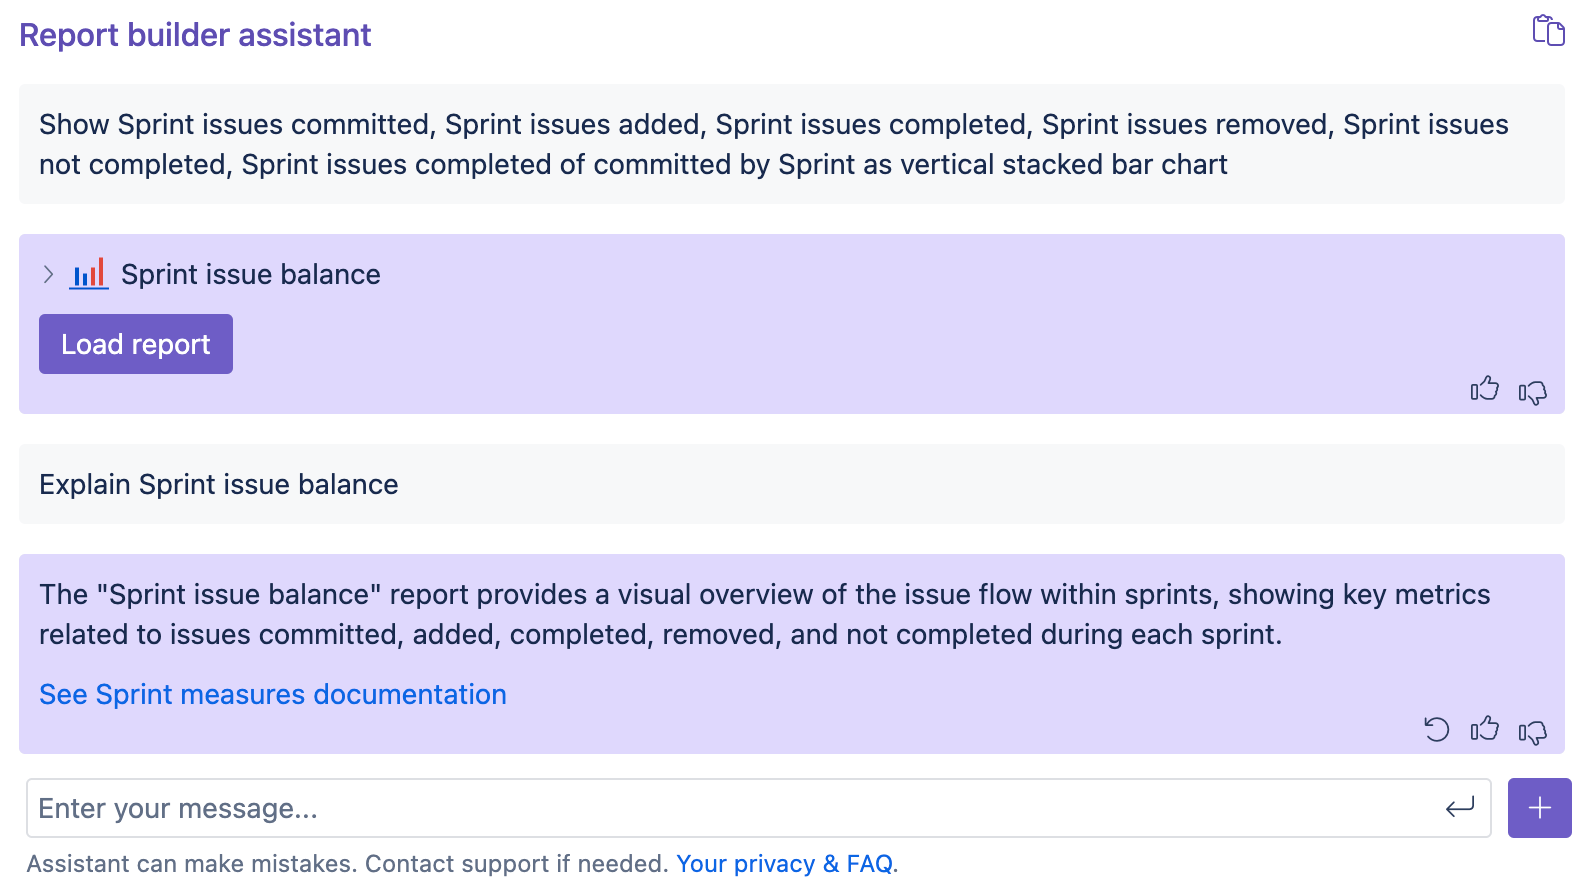
AI Assisted Report Building
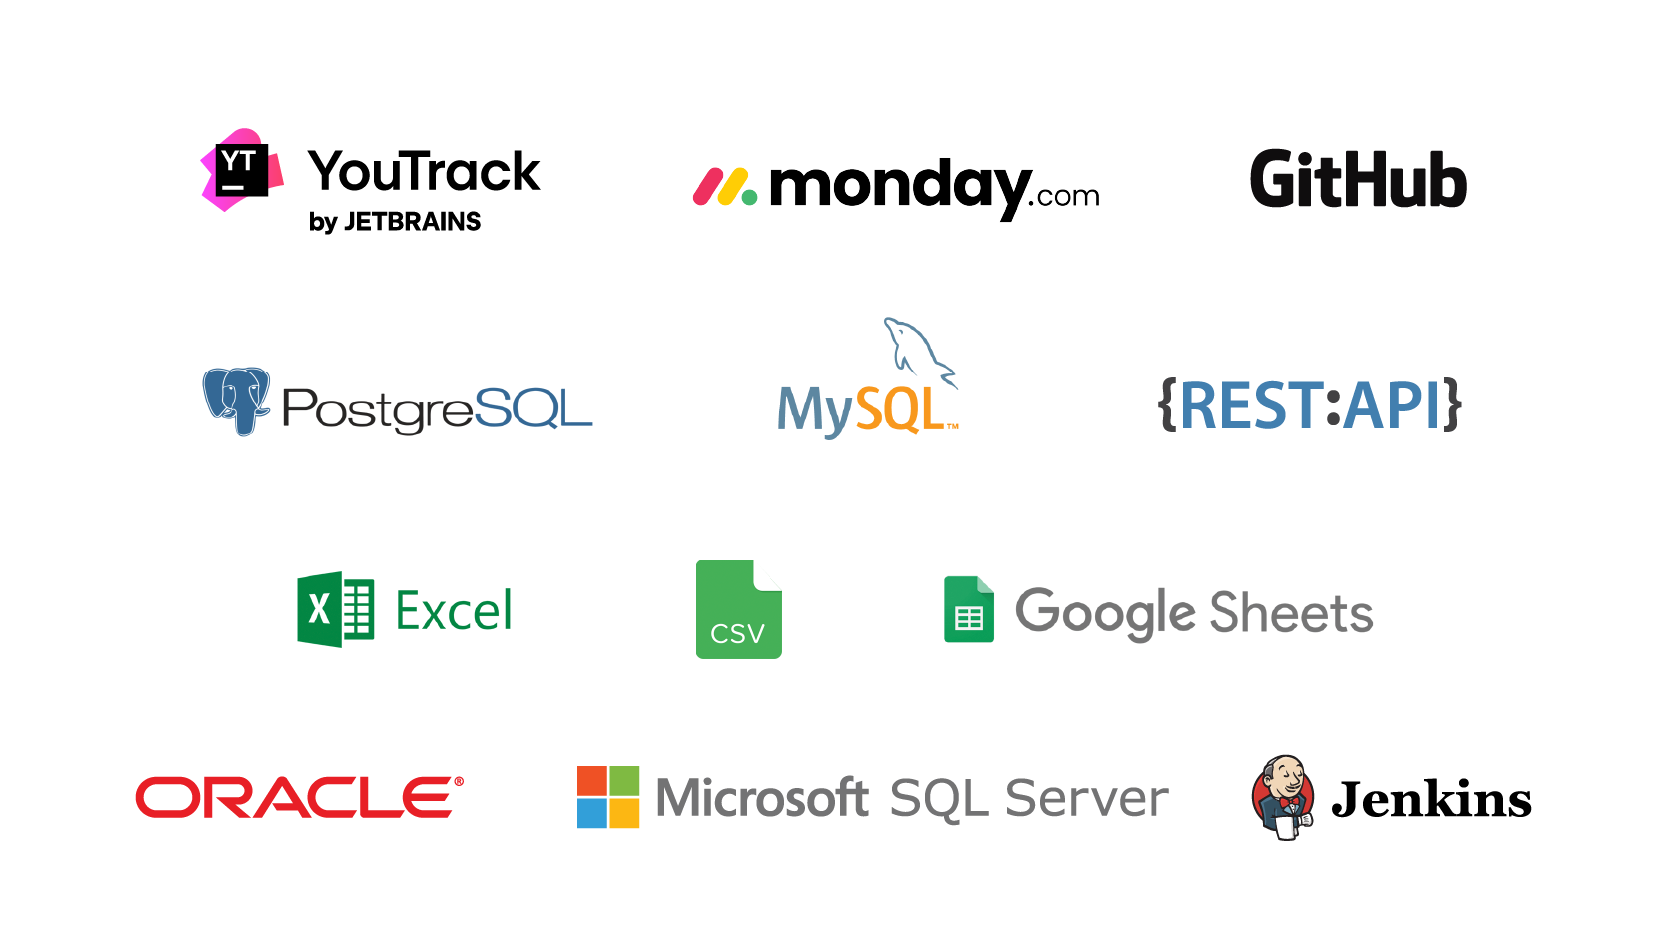
Many Data Sources

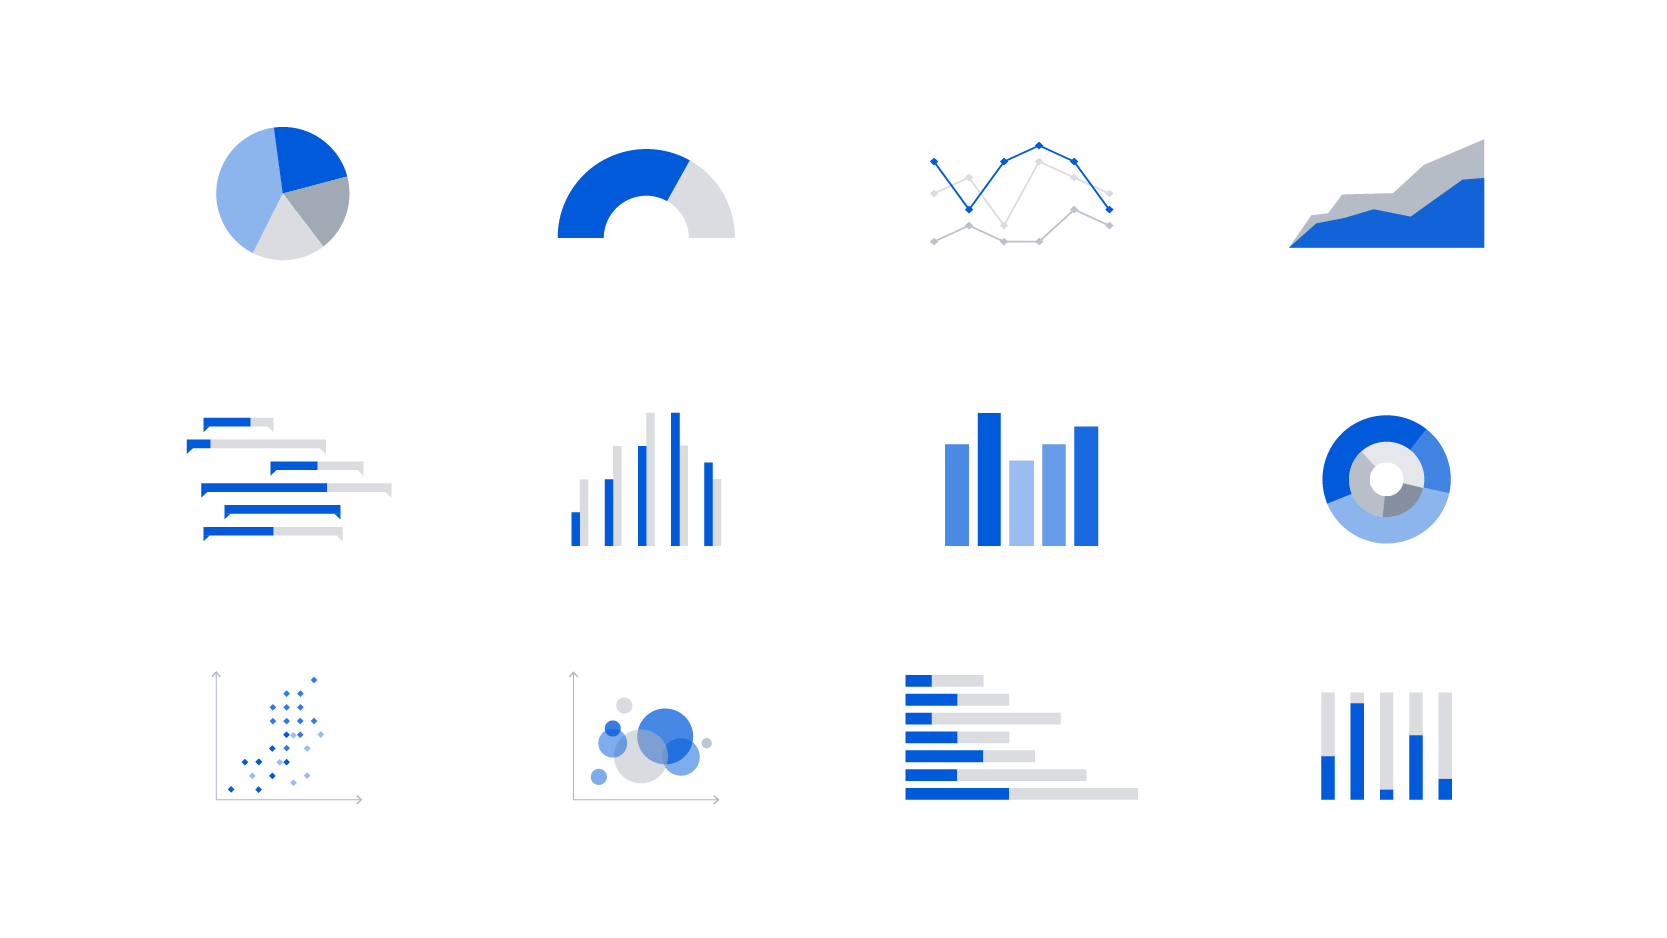
Make trends and outliers obvious. Choose clear visuals, label them well, and move on with shared understanding.
Advanced Visualization
Many Chart Types
Interactive Dashboards


When a number looks off, follow it. Narrow the scope, change the angle, and — when needed — open the underlying issues.
Page Filters
Hierarchies
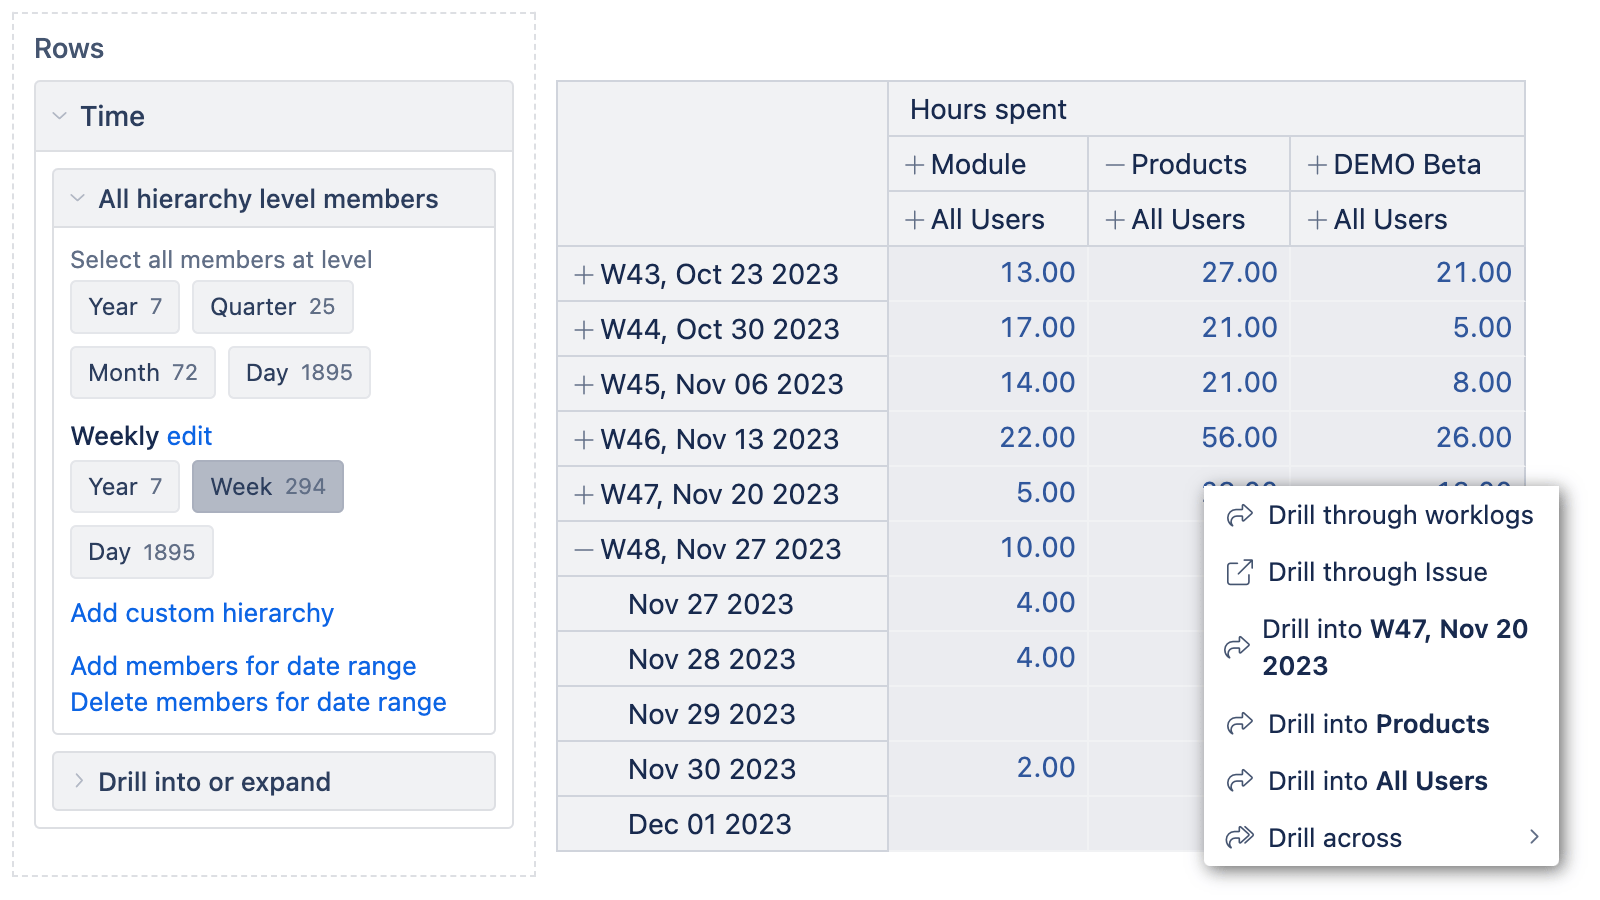
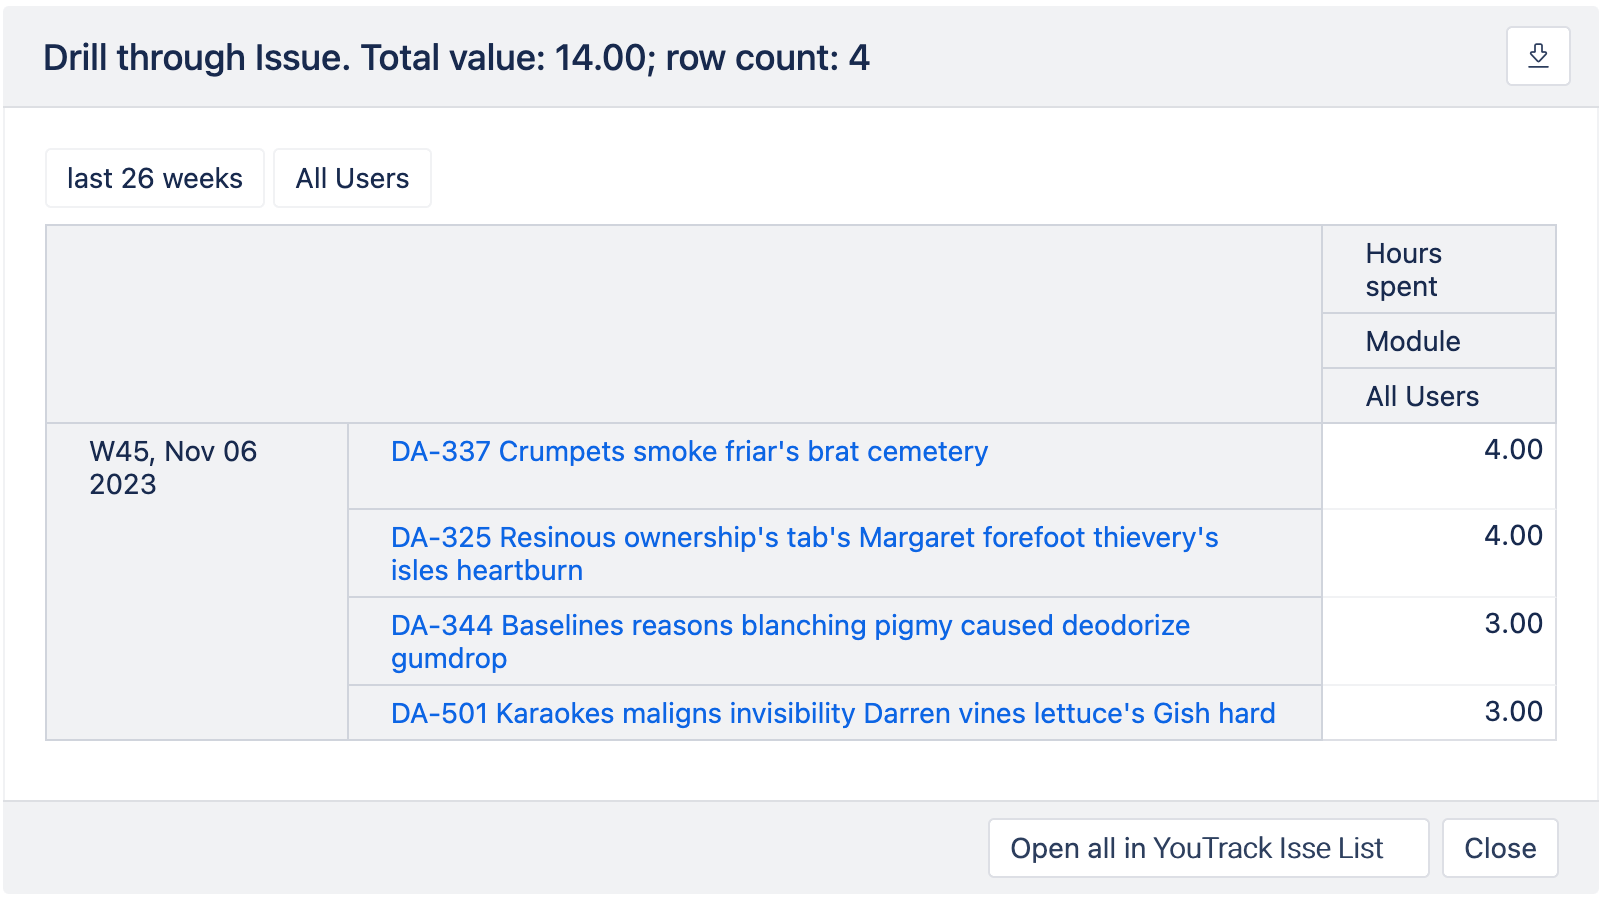
Drill & Zoom
Governance
Direct Links to YouTrack

Make updates a non-event. Reports refresh on a schedule; stakeholders get what they need without chasing you.
Scheduled Refresh
Email Subscriptions
Dashboard Sharing & Wallboards
Exports: PDF, XLSX, CSV
Start a 30-day Free Trial
Try eazyBI free for 30 days to see if it's right for you. If you need any help or support, feel free to reach out to support@eazybi.com—we're there for you.
Demo Dashboards & Template Library
Explore examples for project overviews, agile flow, sprint health, time tracking, quality trends, and portfolios. Import a dashboard or report as a template to your account and adjust it to your data.
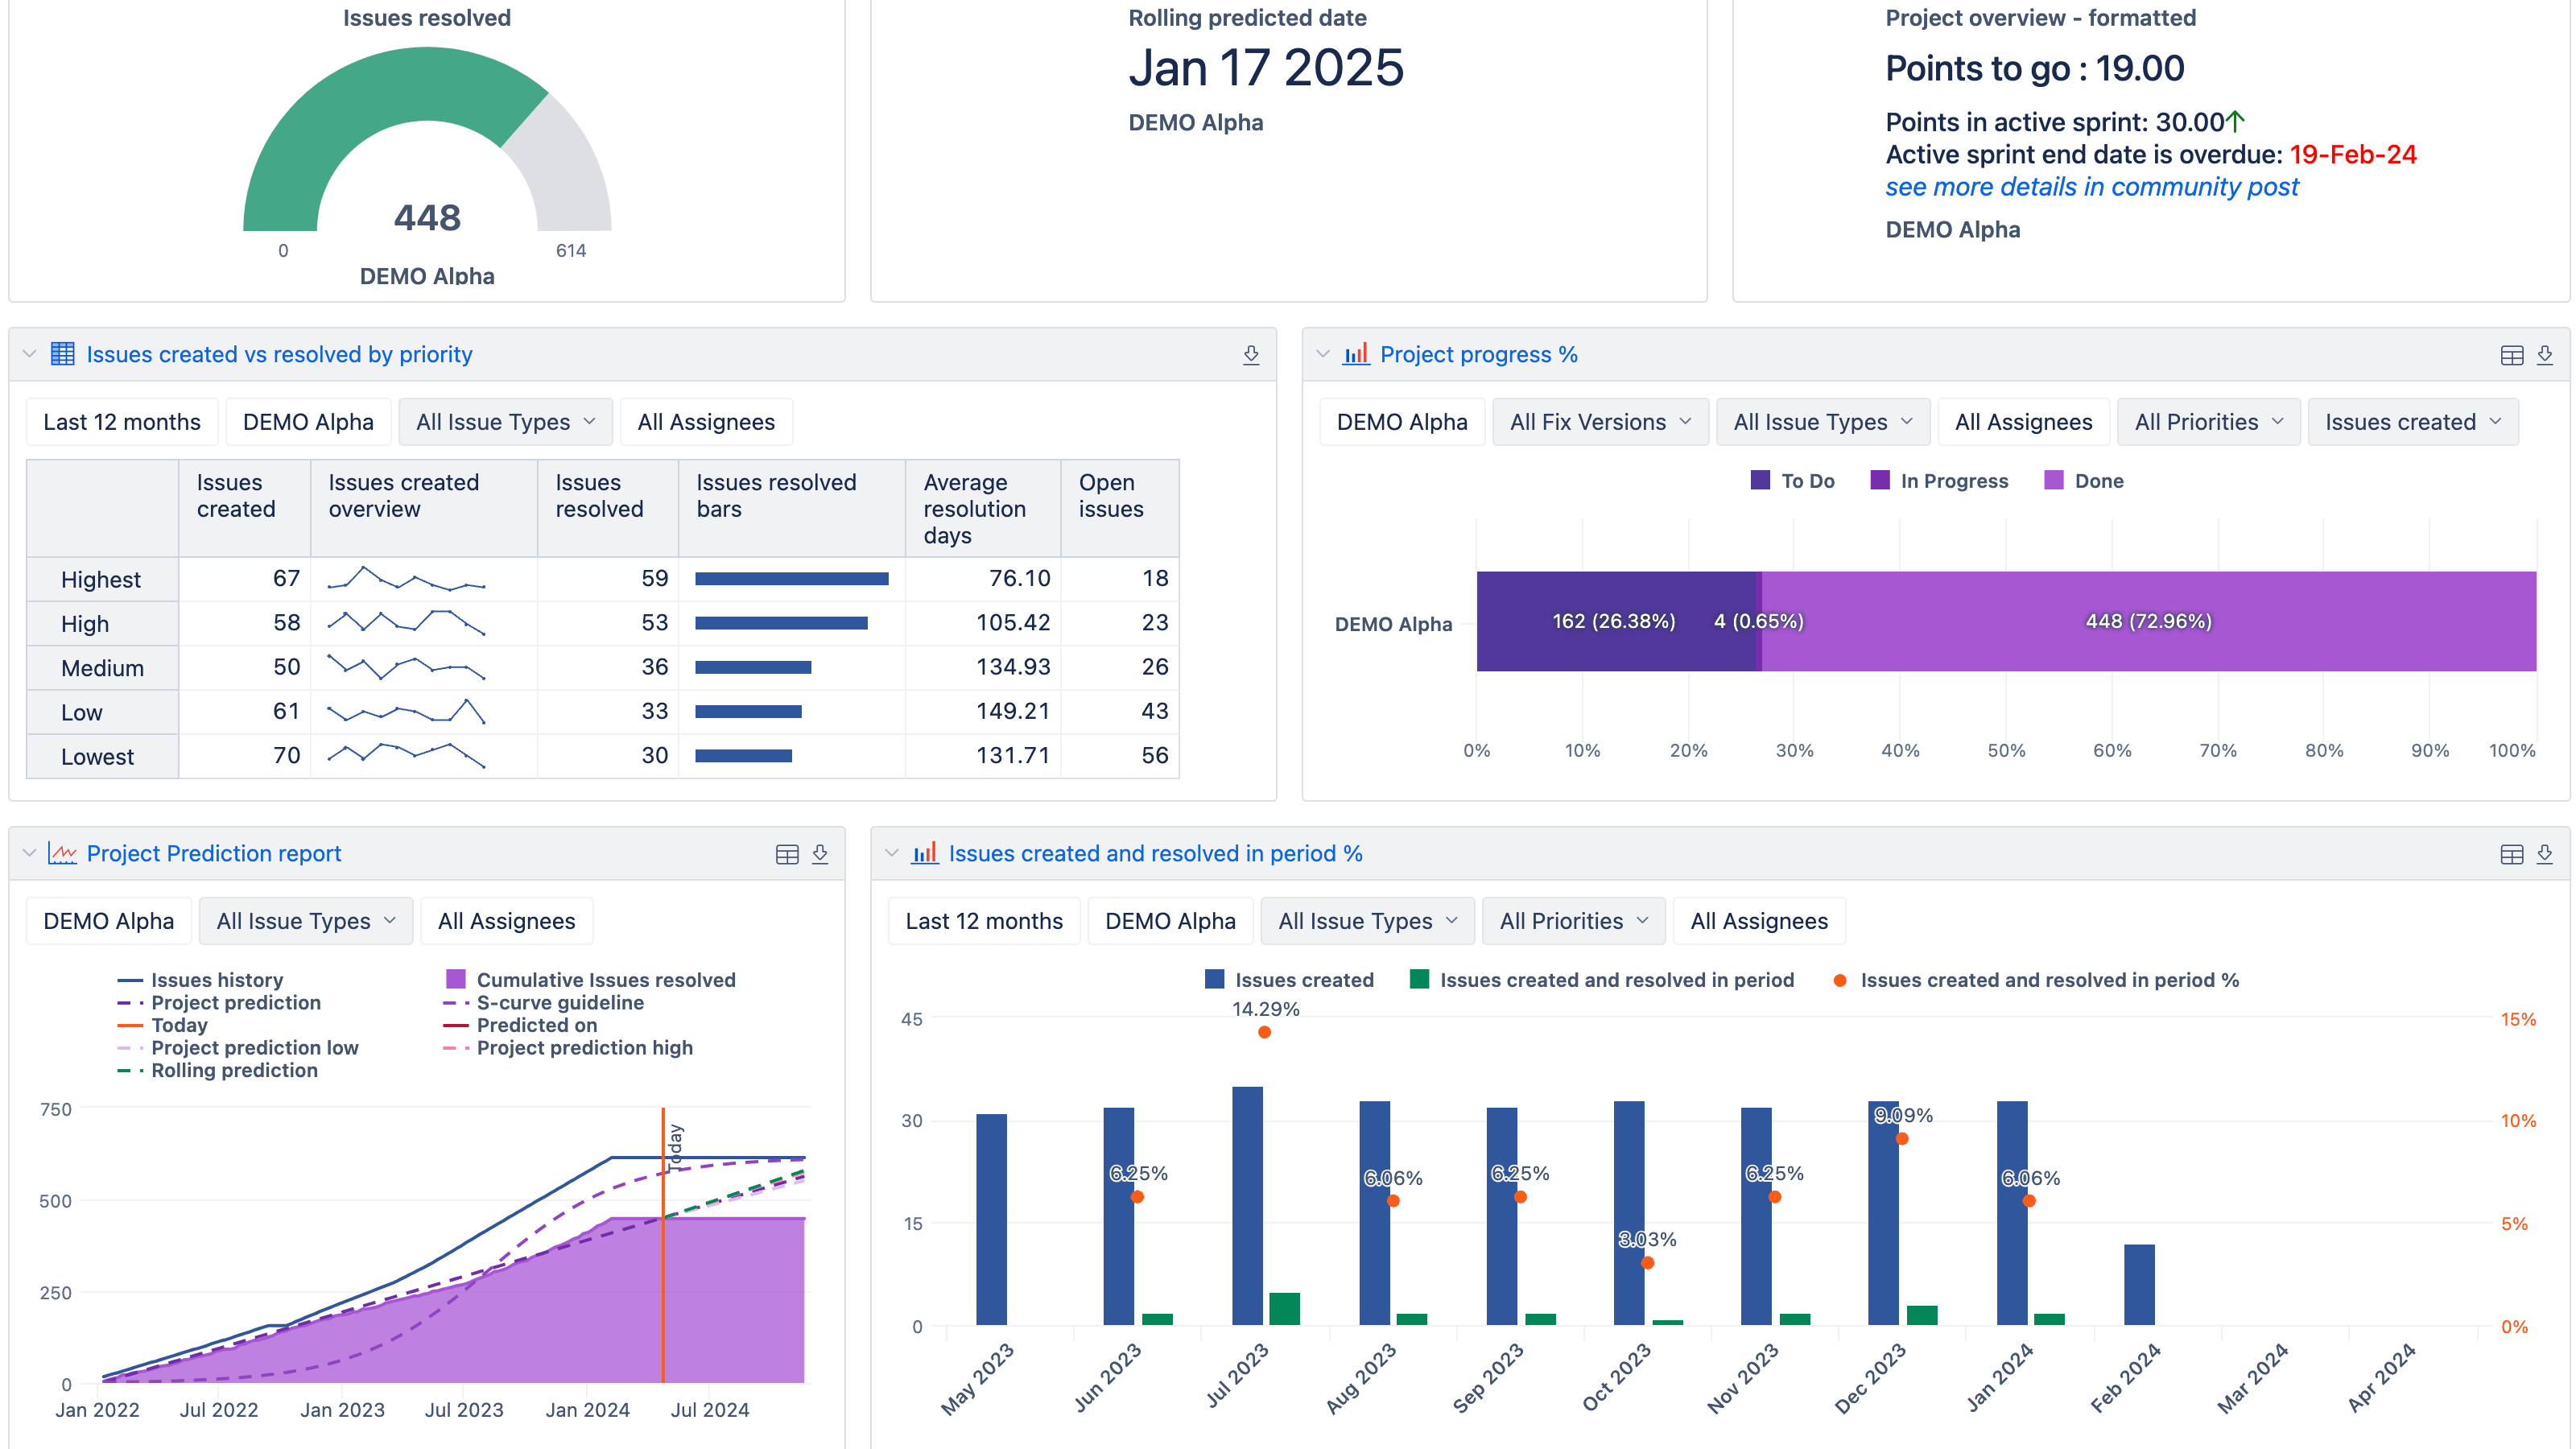
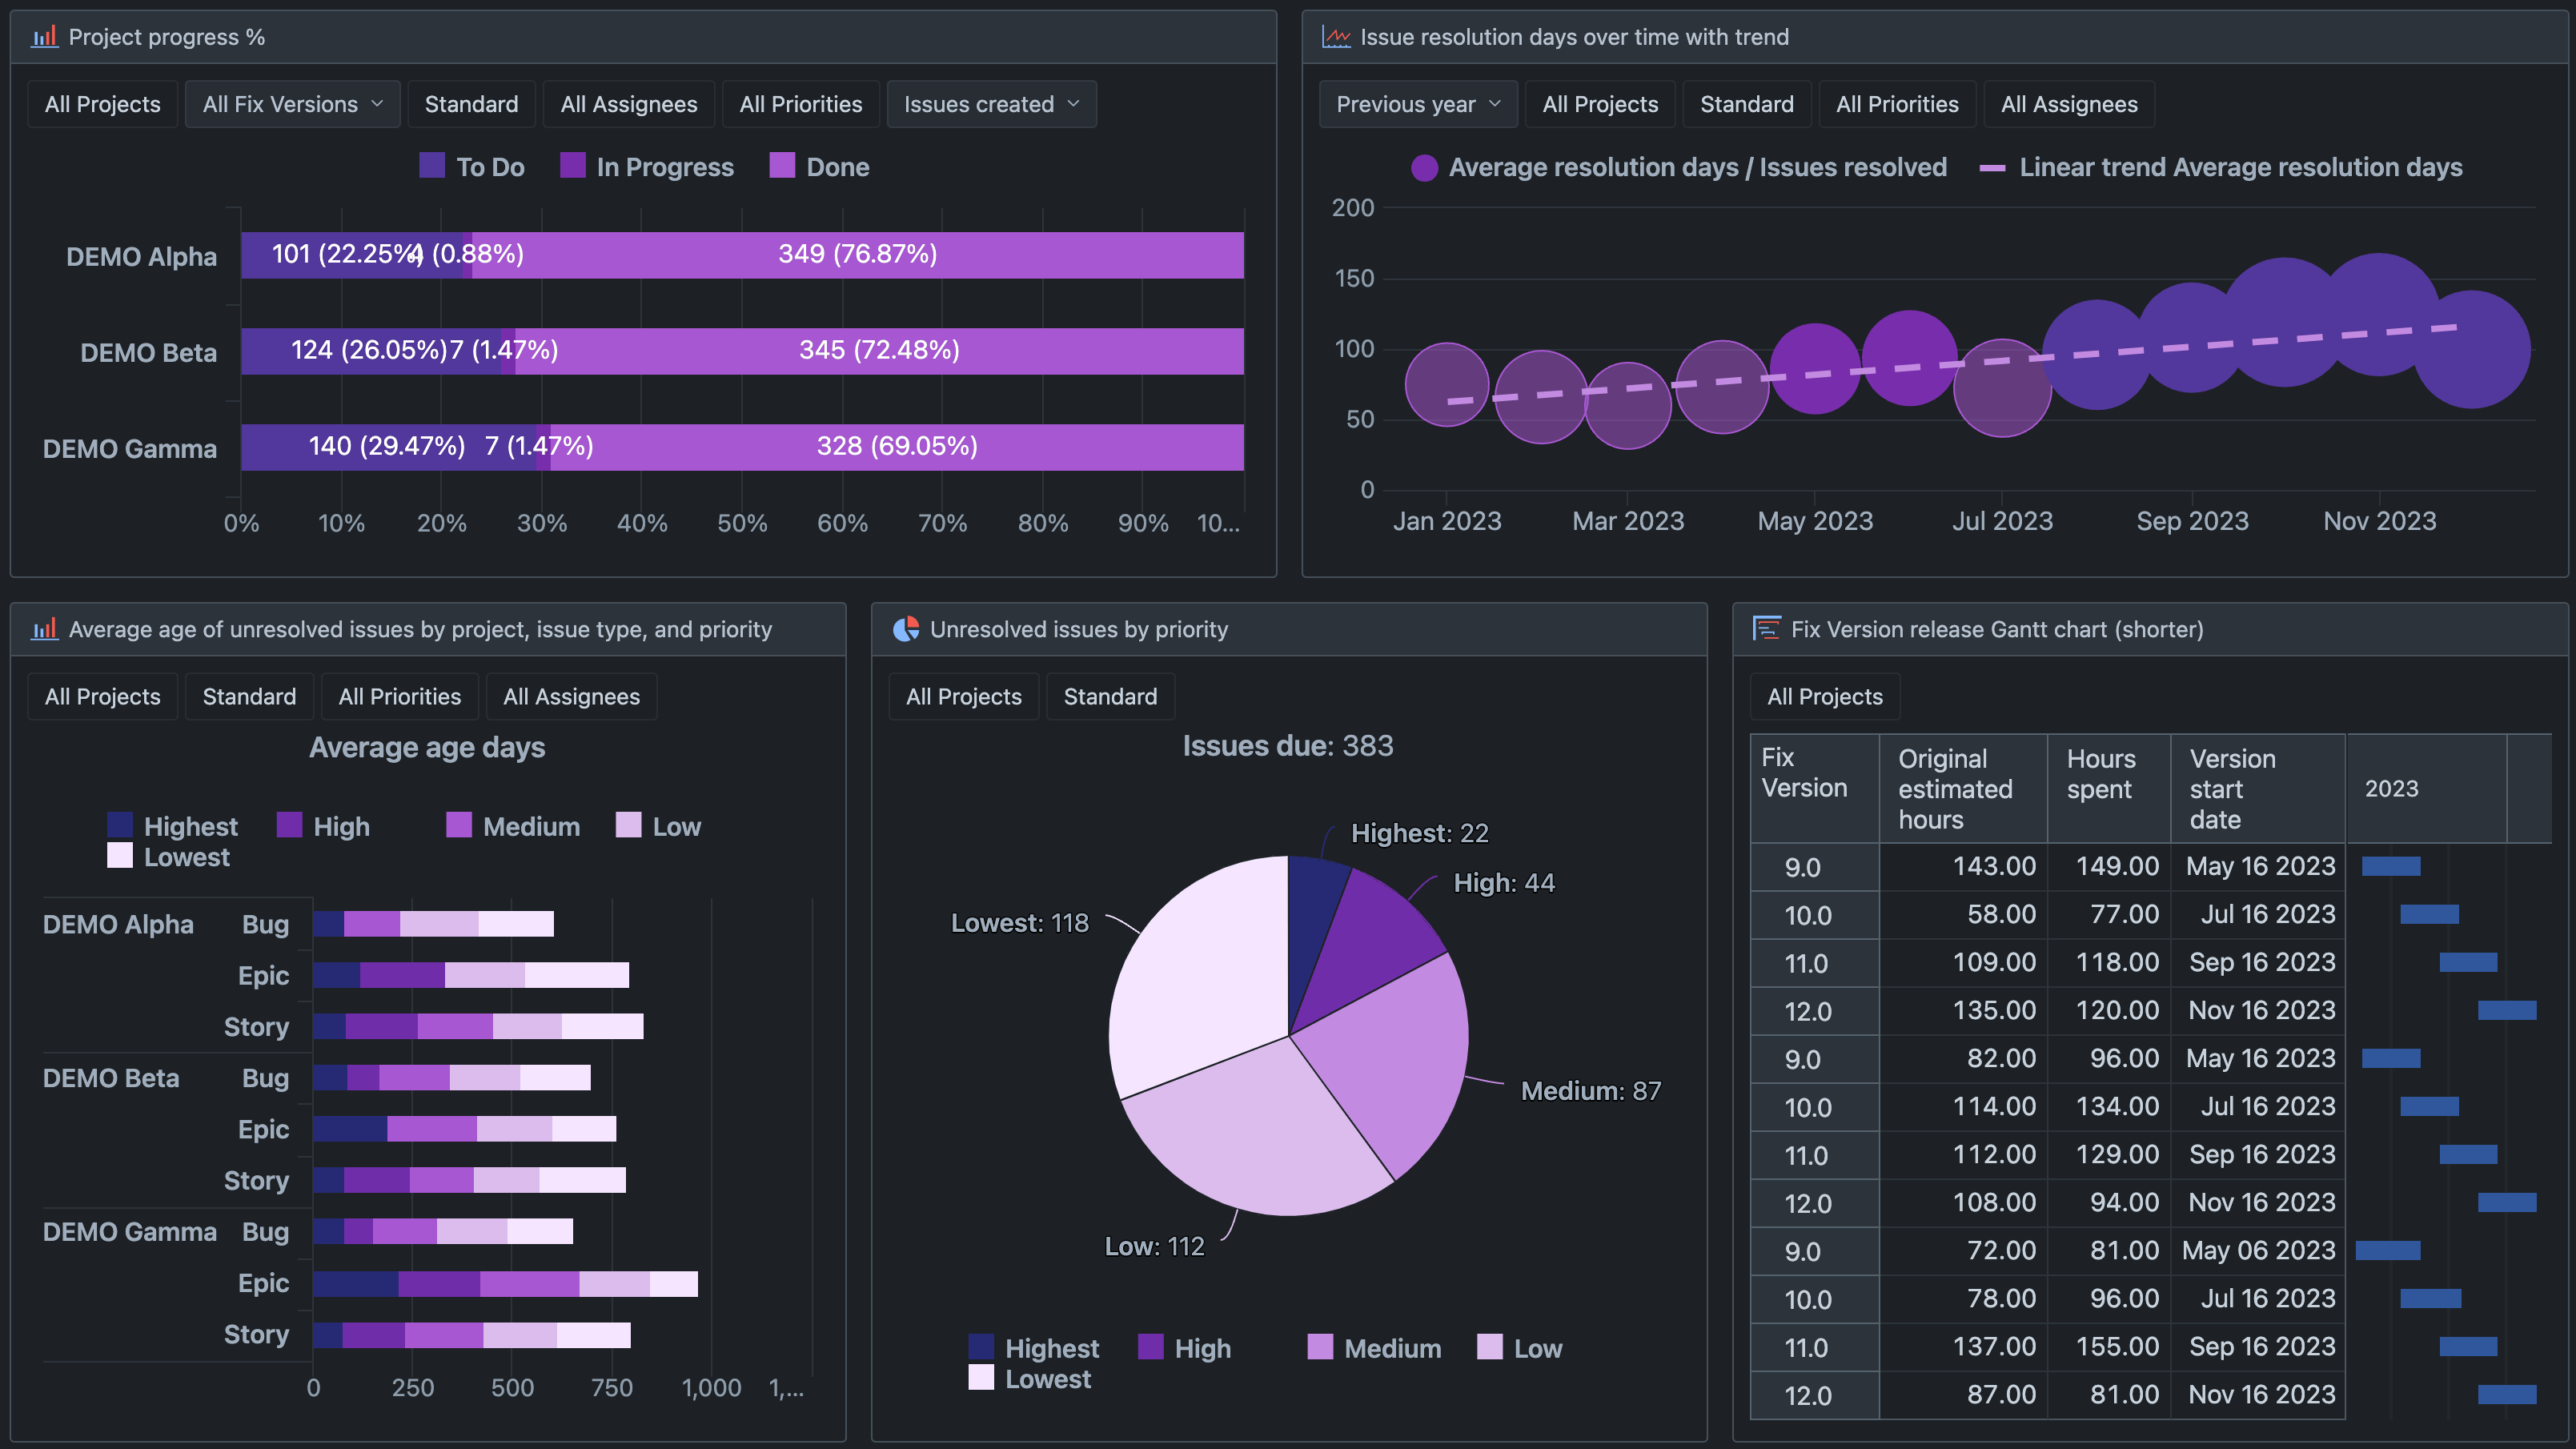
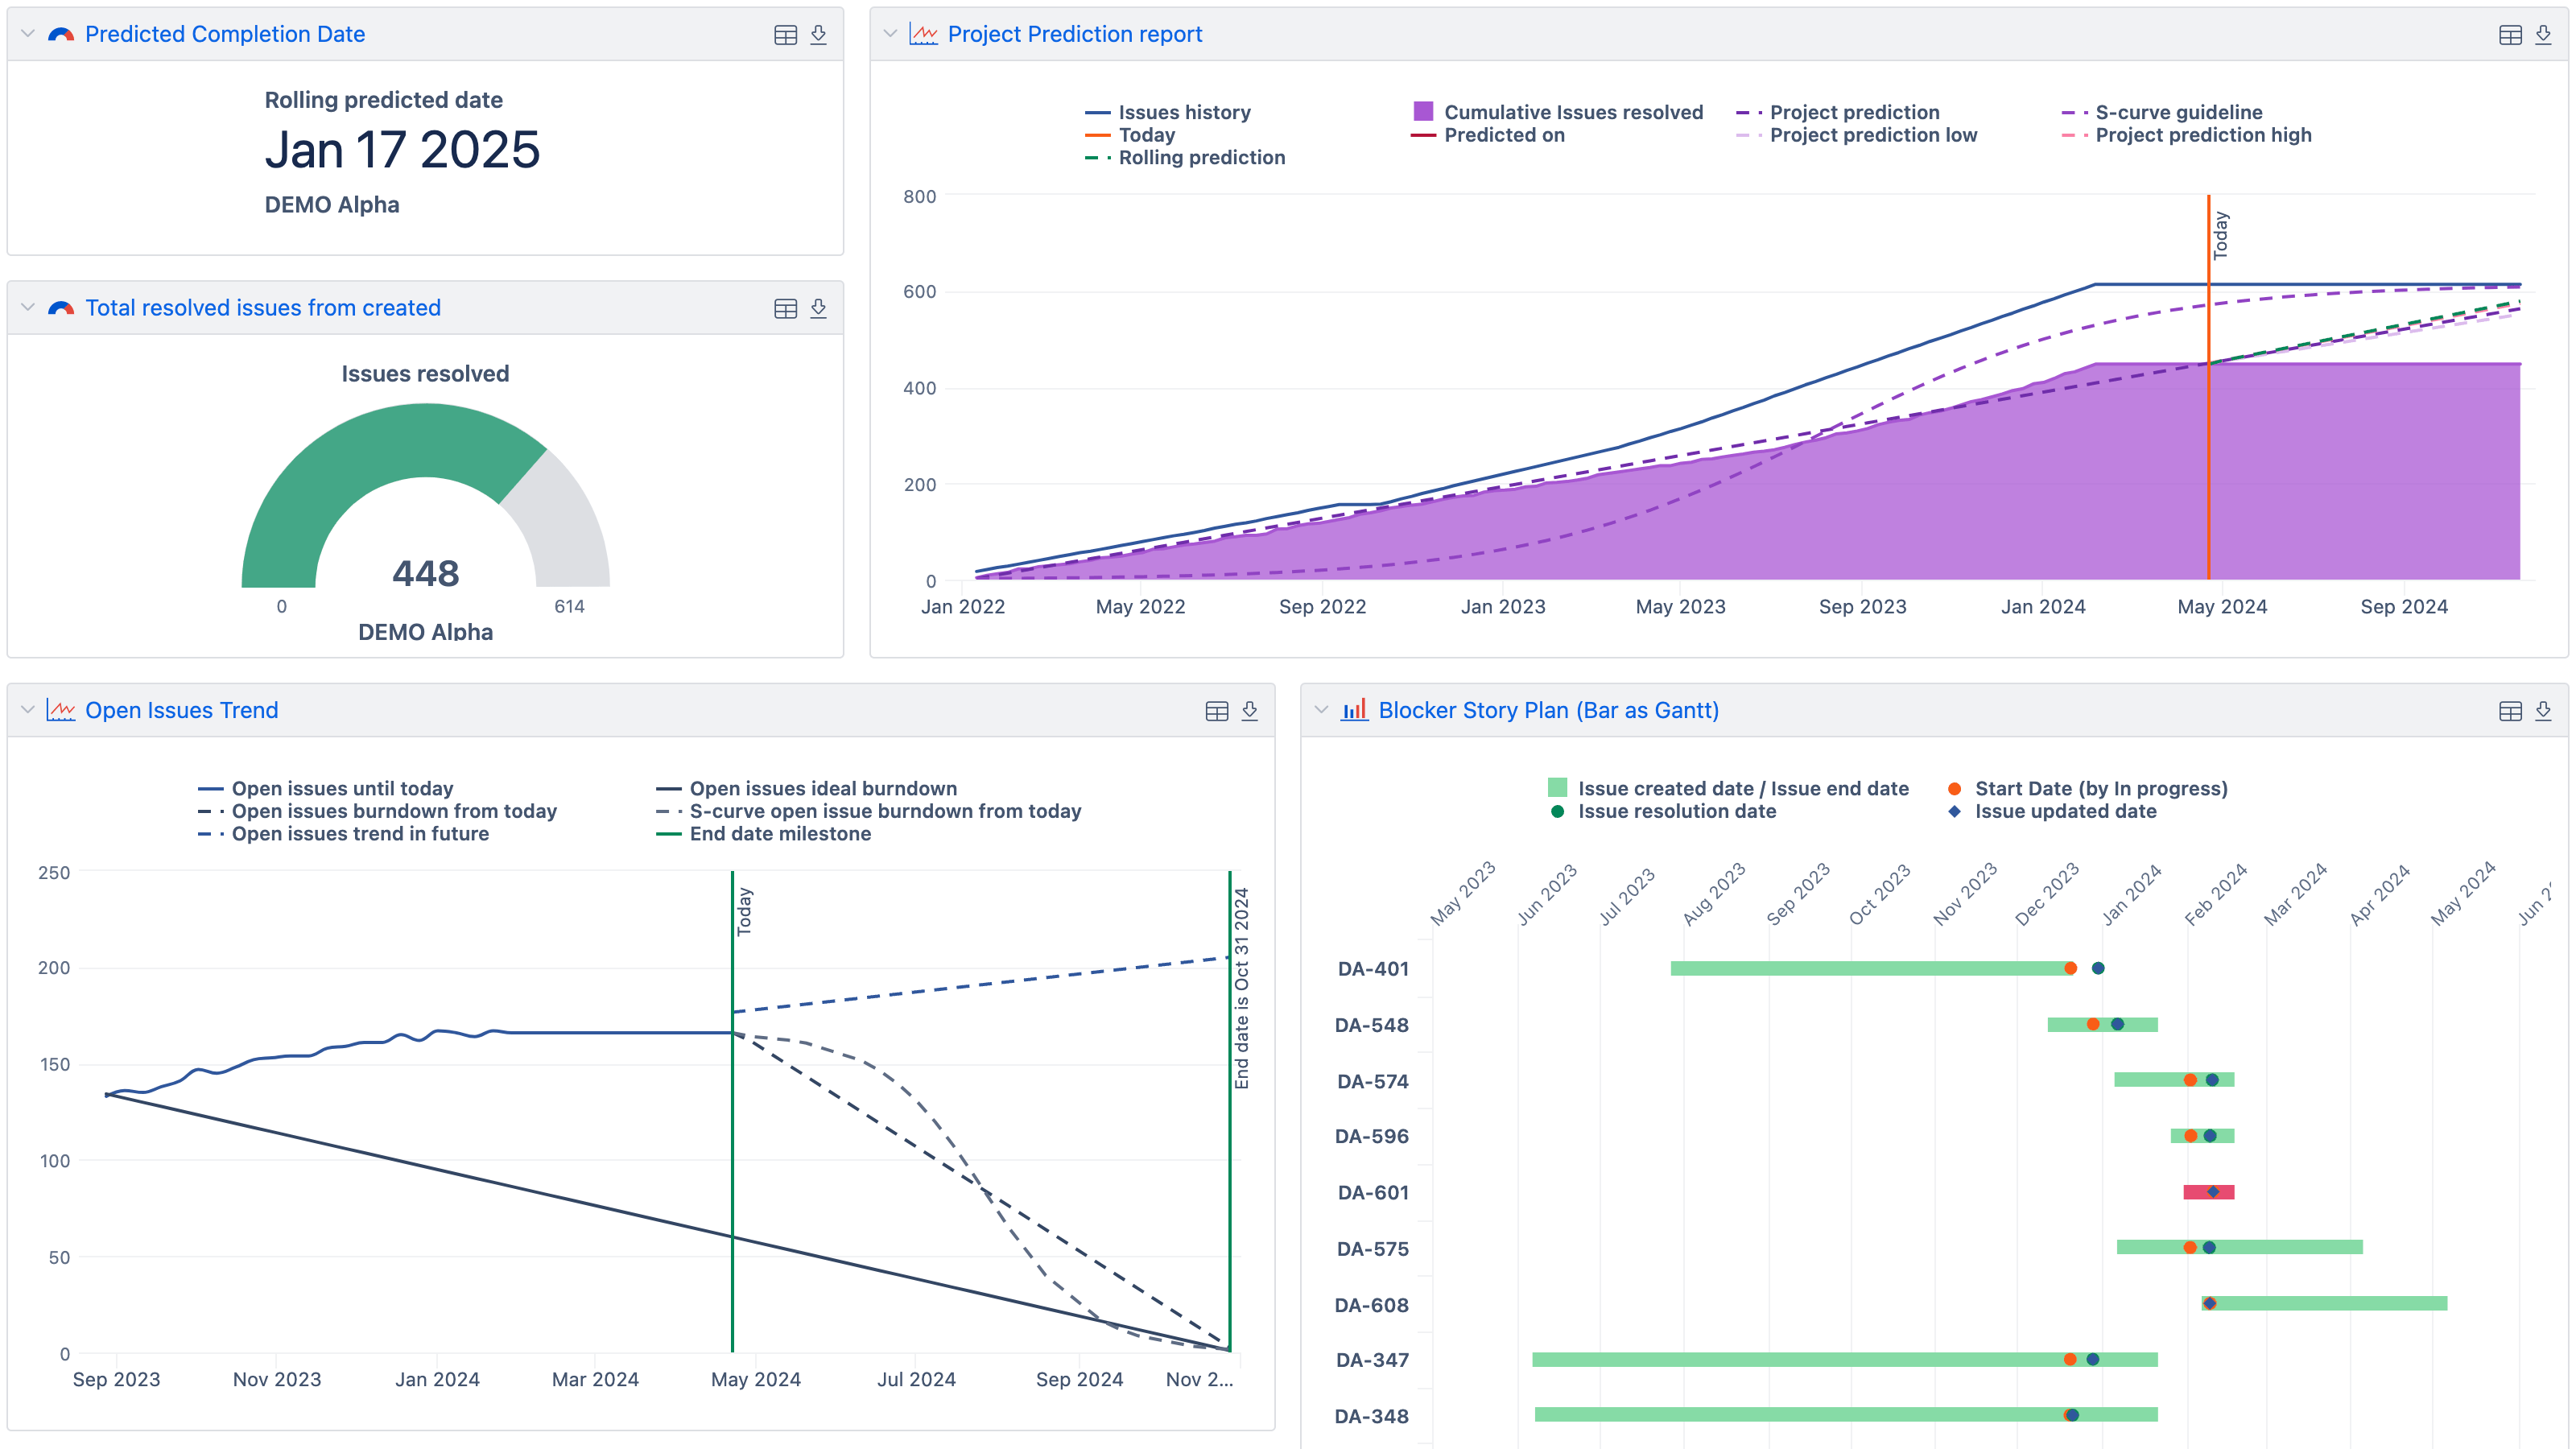
Track created vs. resolved, scope changes, open issues by state and priority, and resolution times. See what changed since last review.
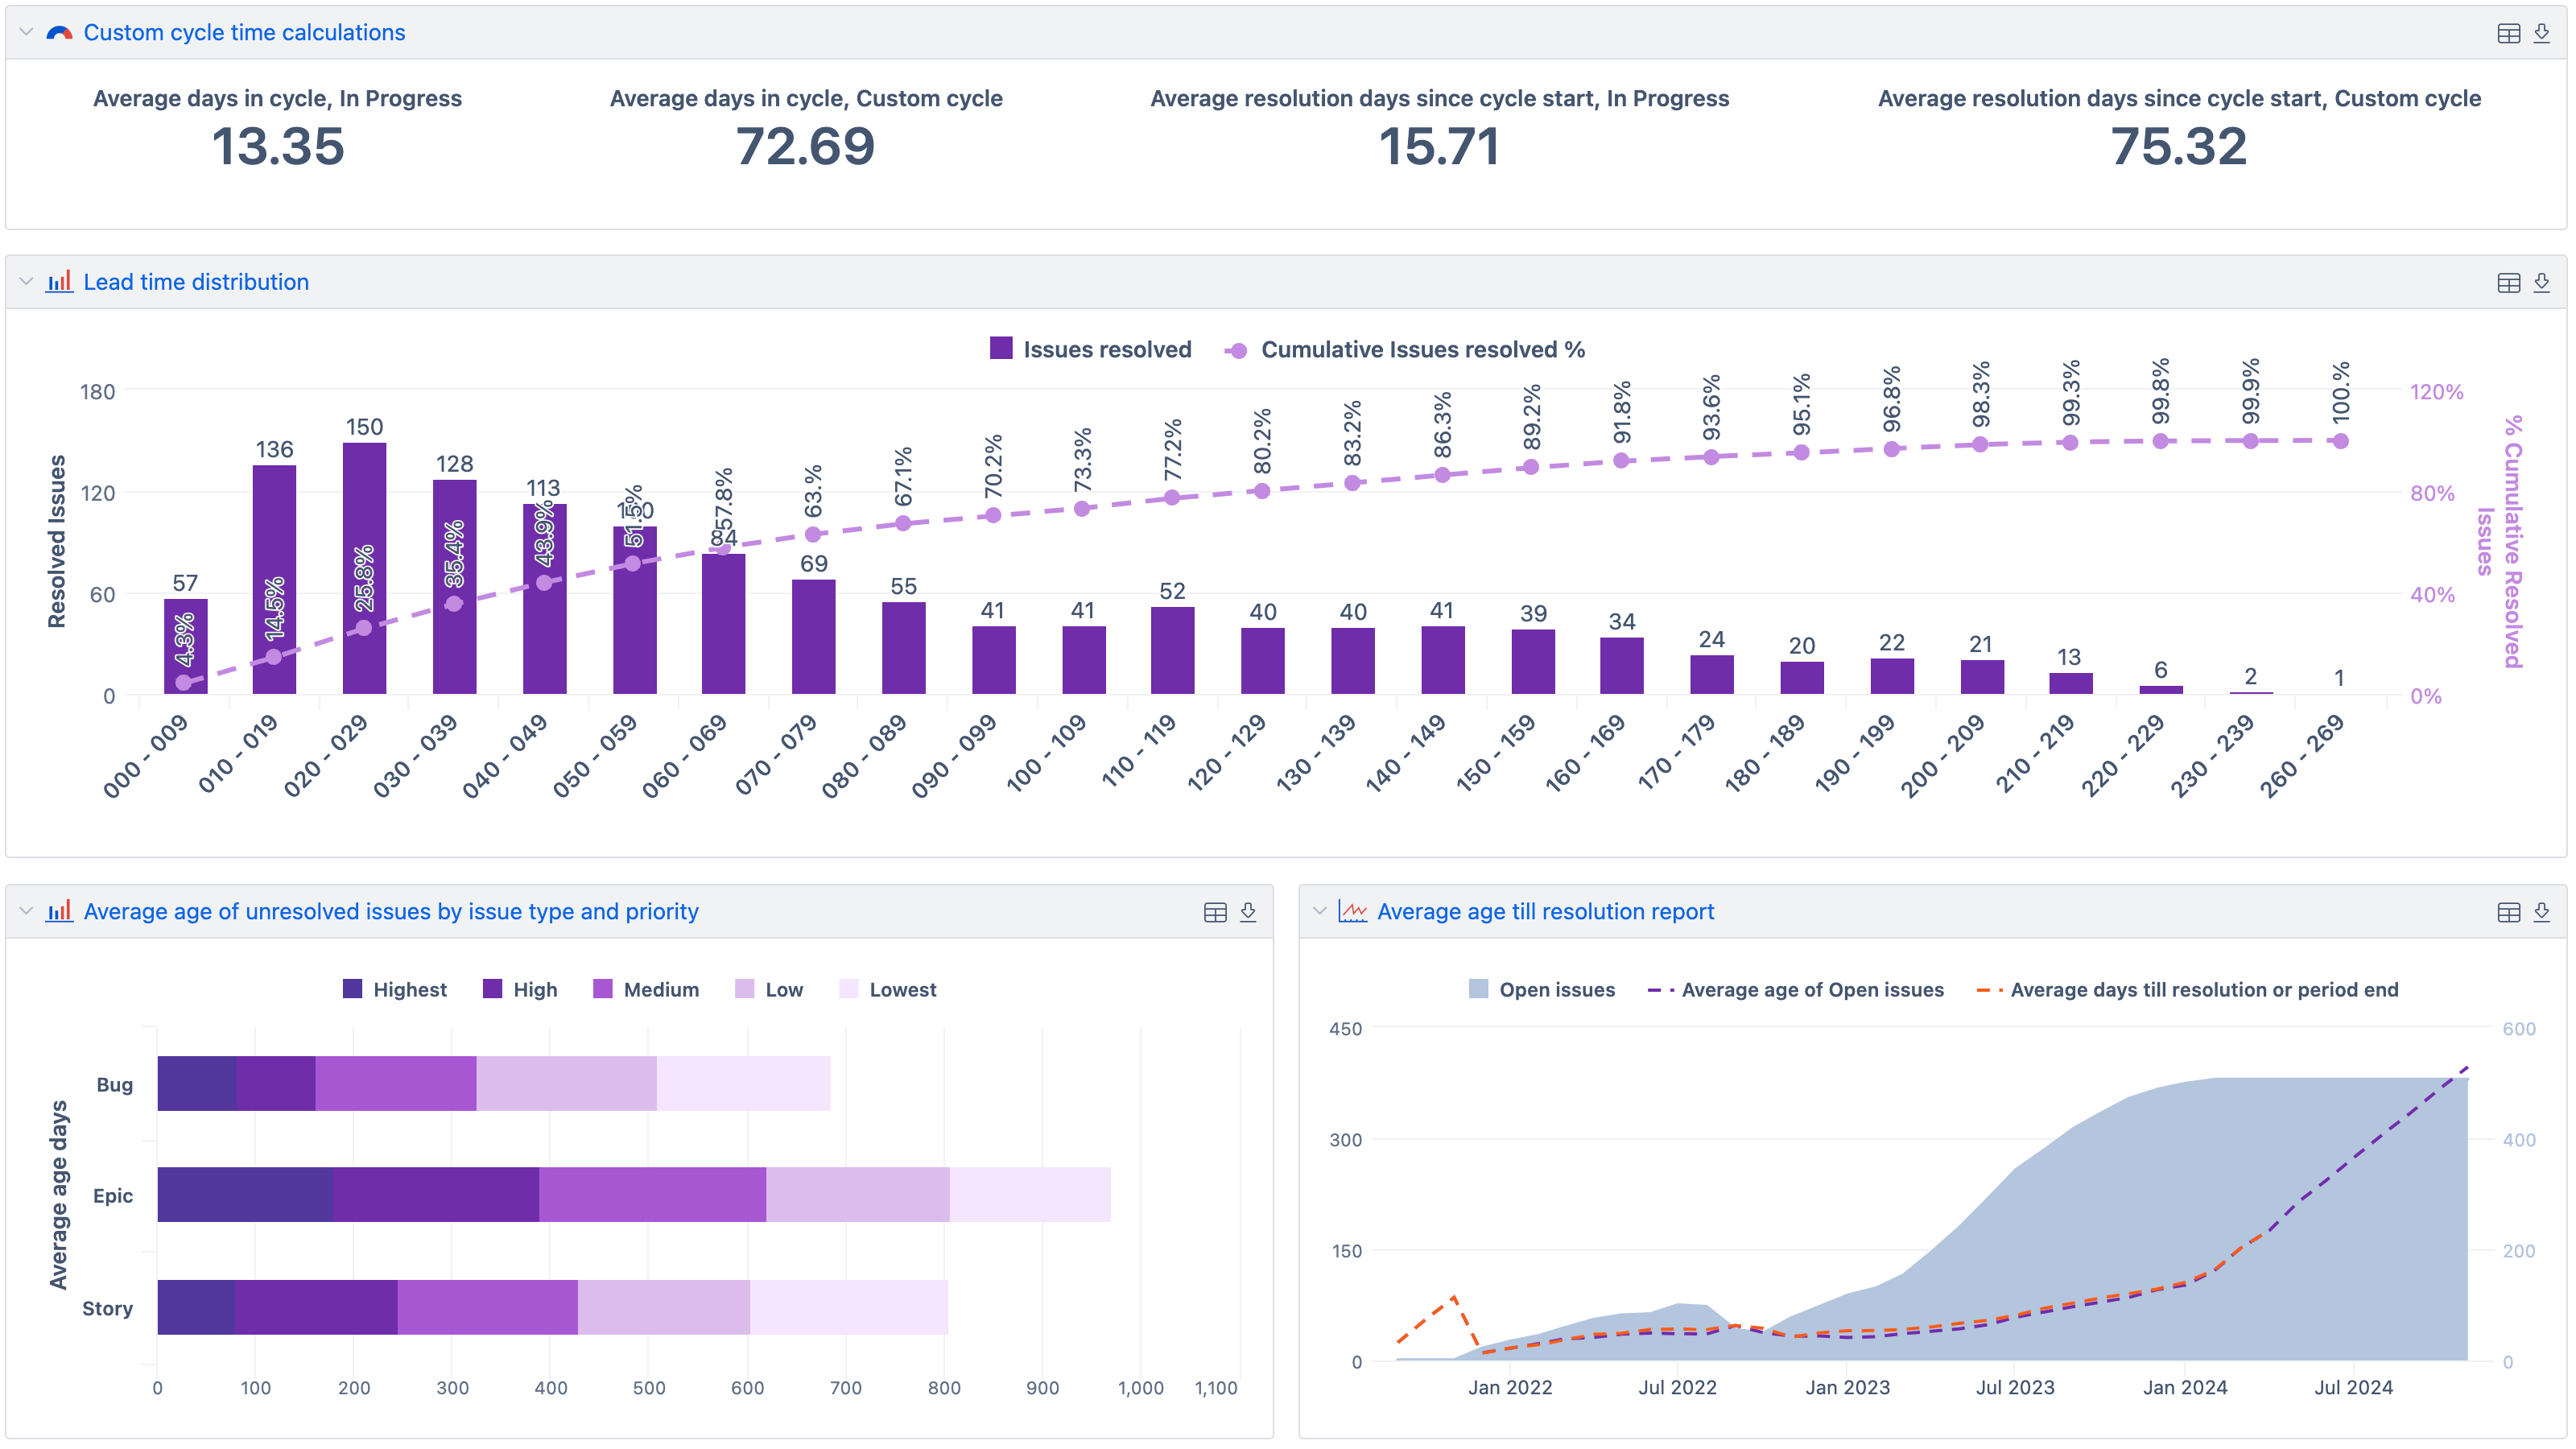
Throughput by week, WIP, cumulative flow, lead/cycle time, and blocked items trend — all on one screen.
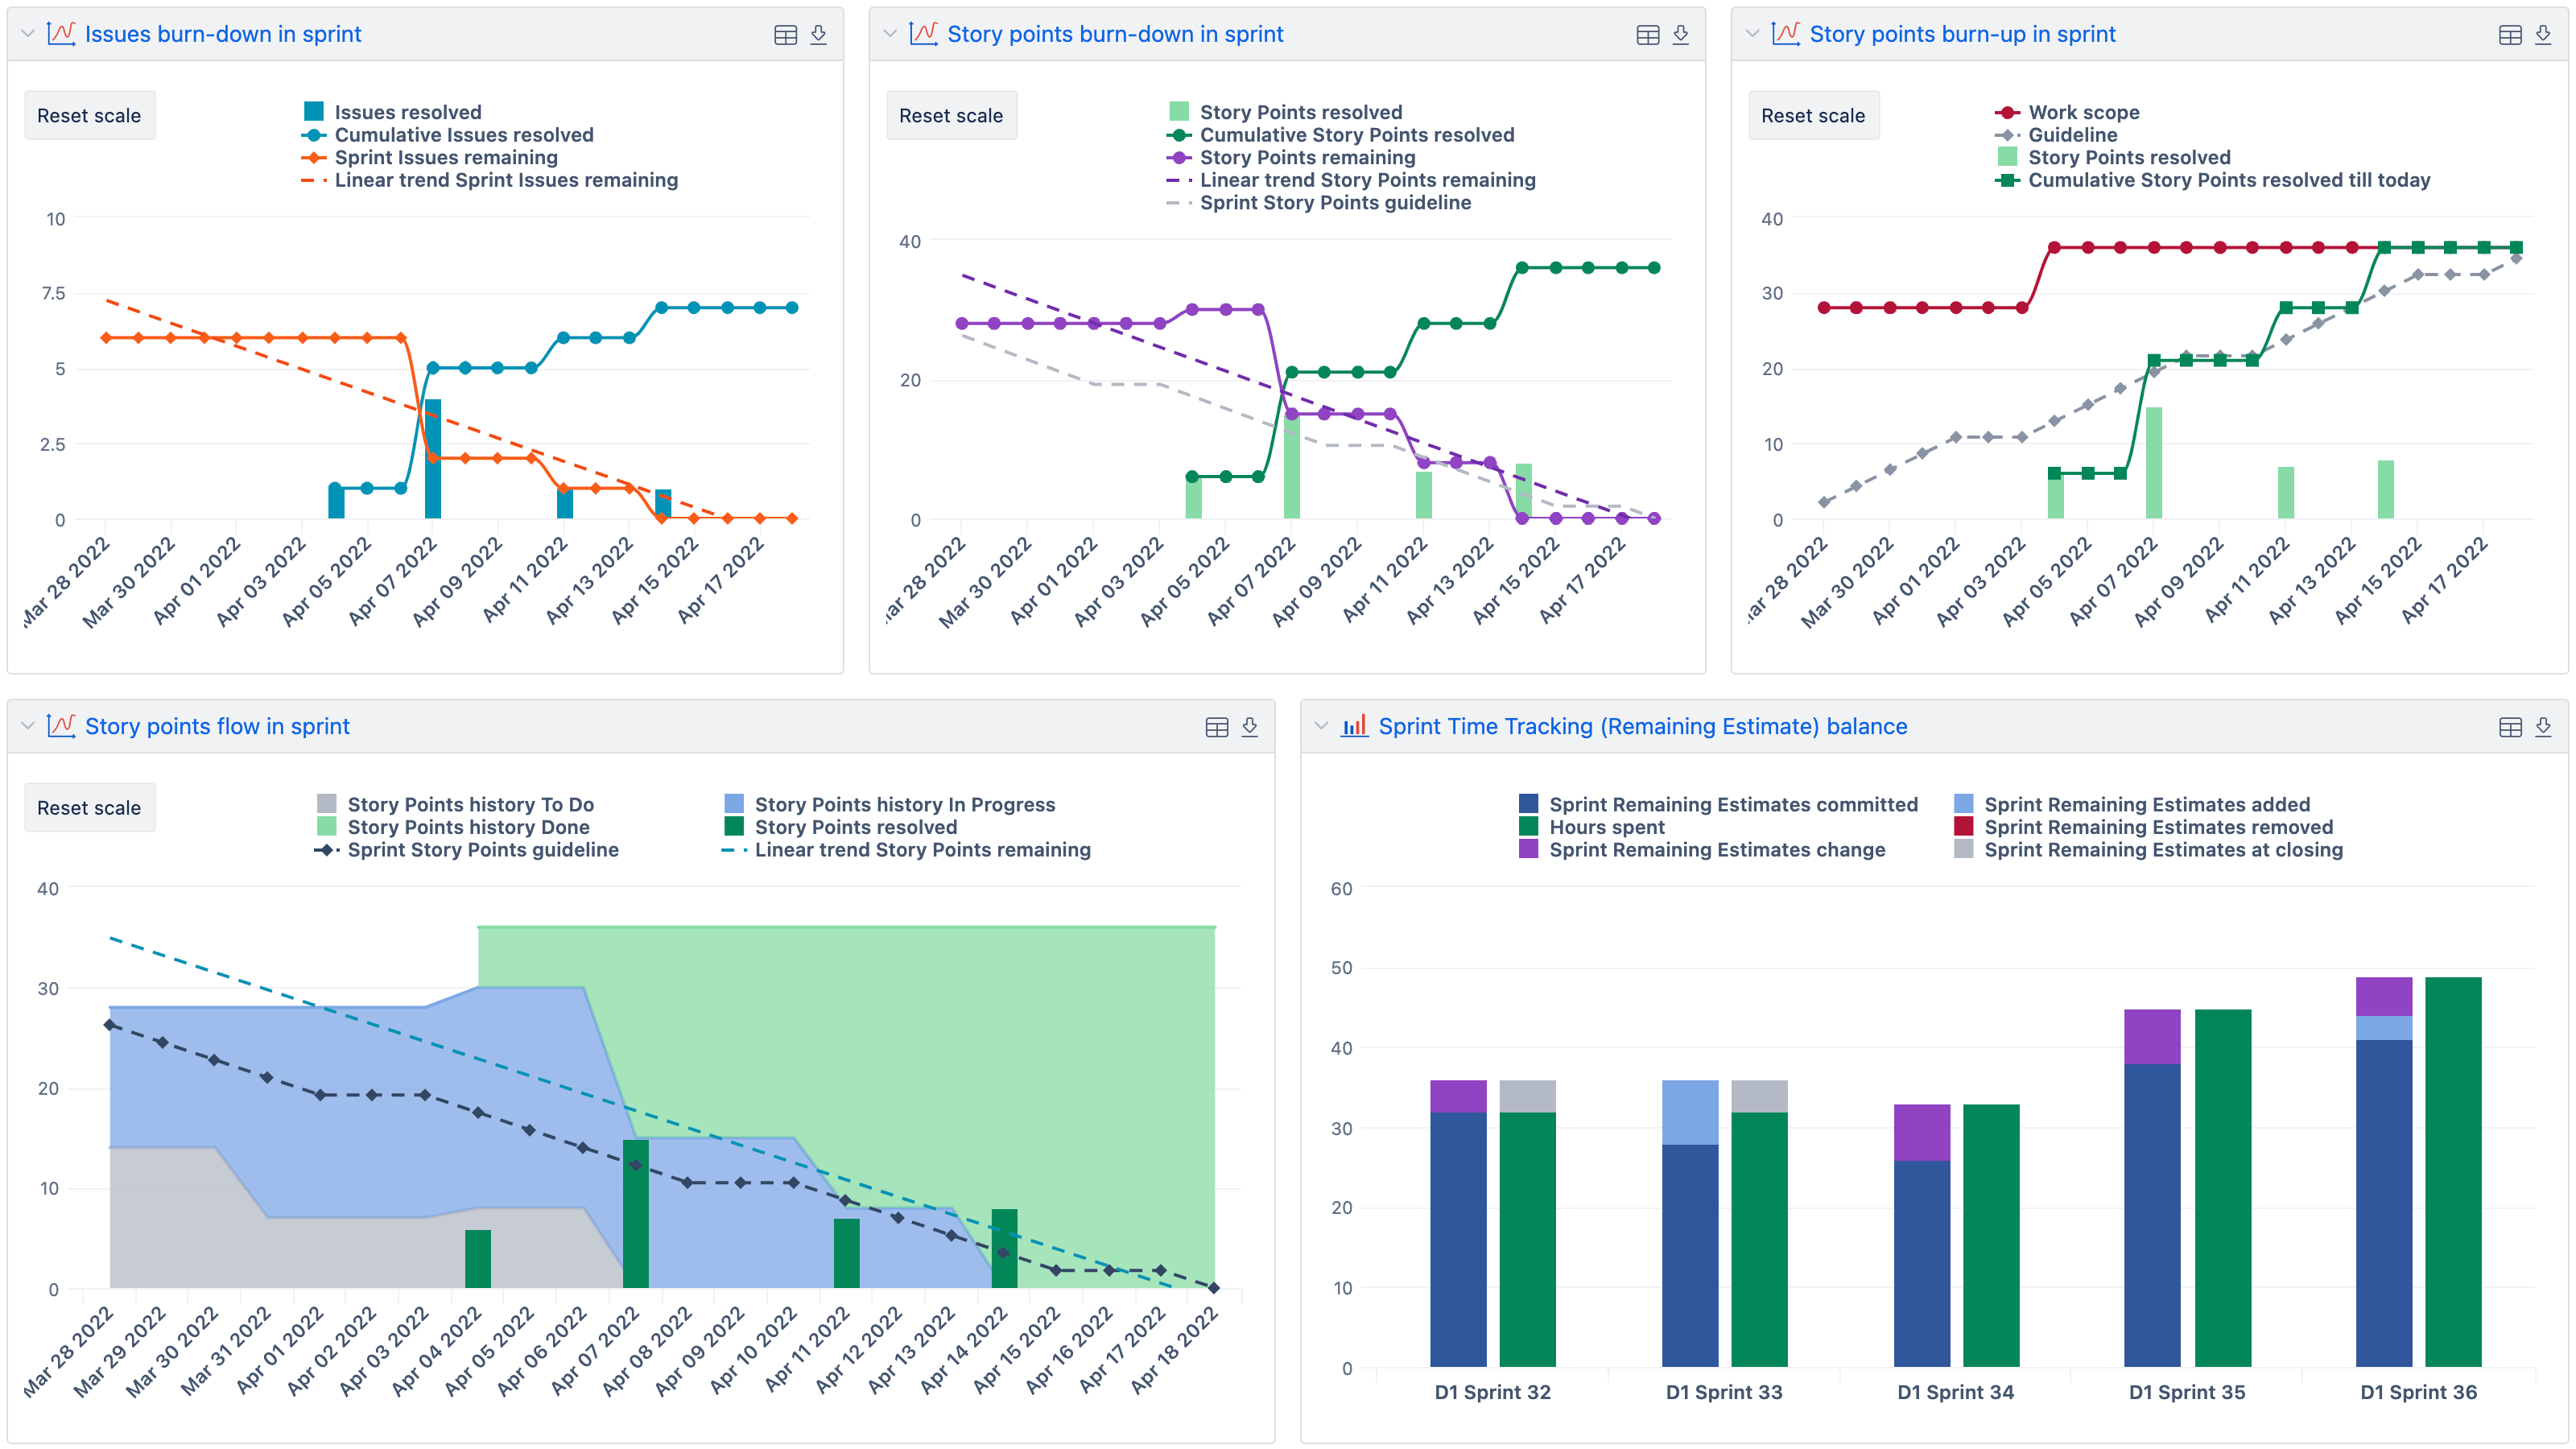
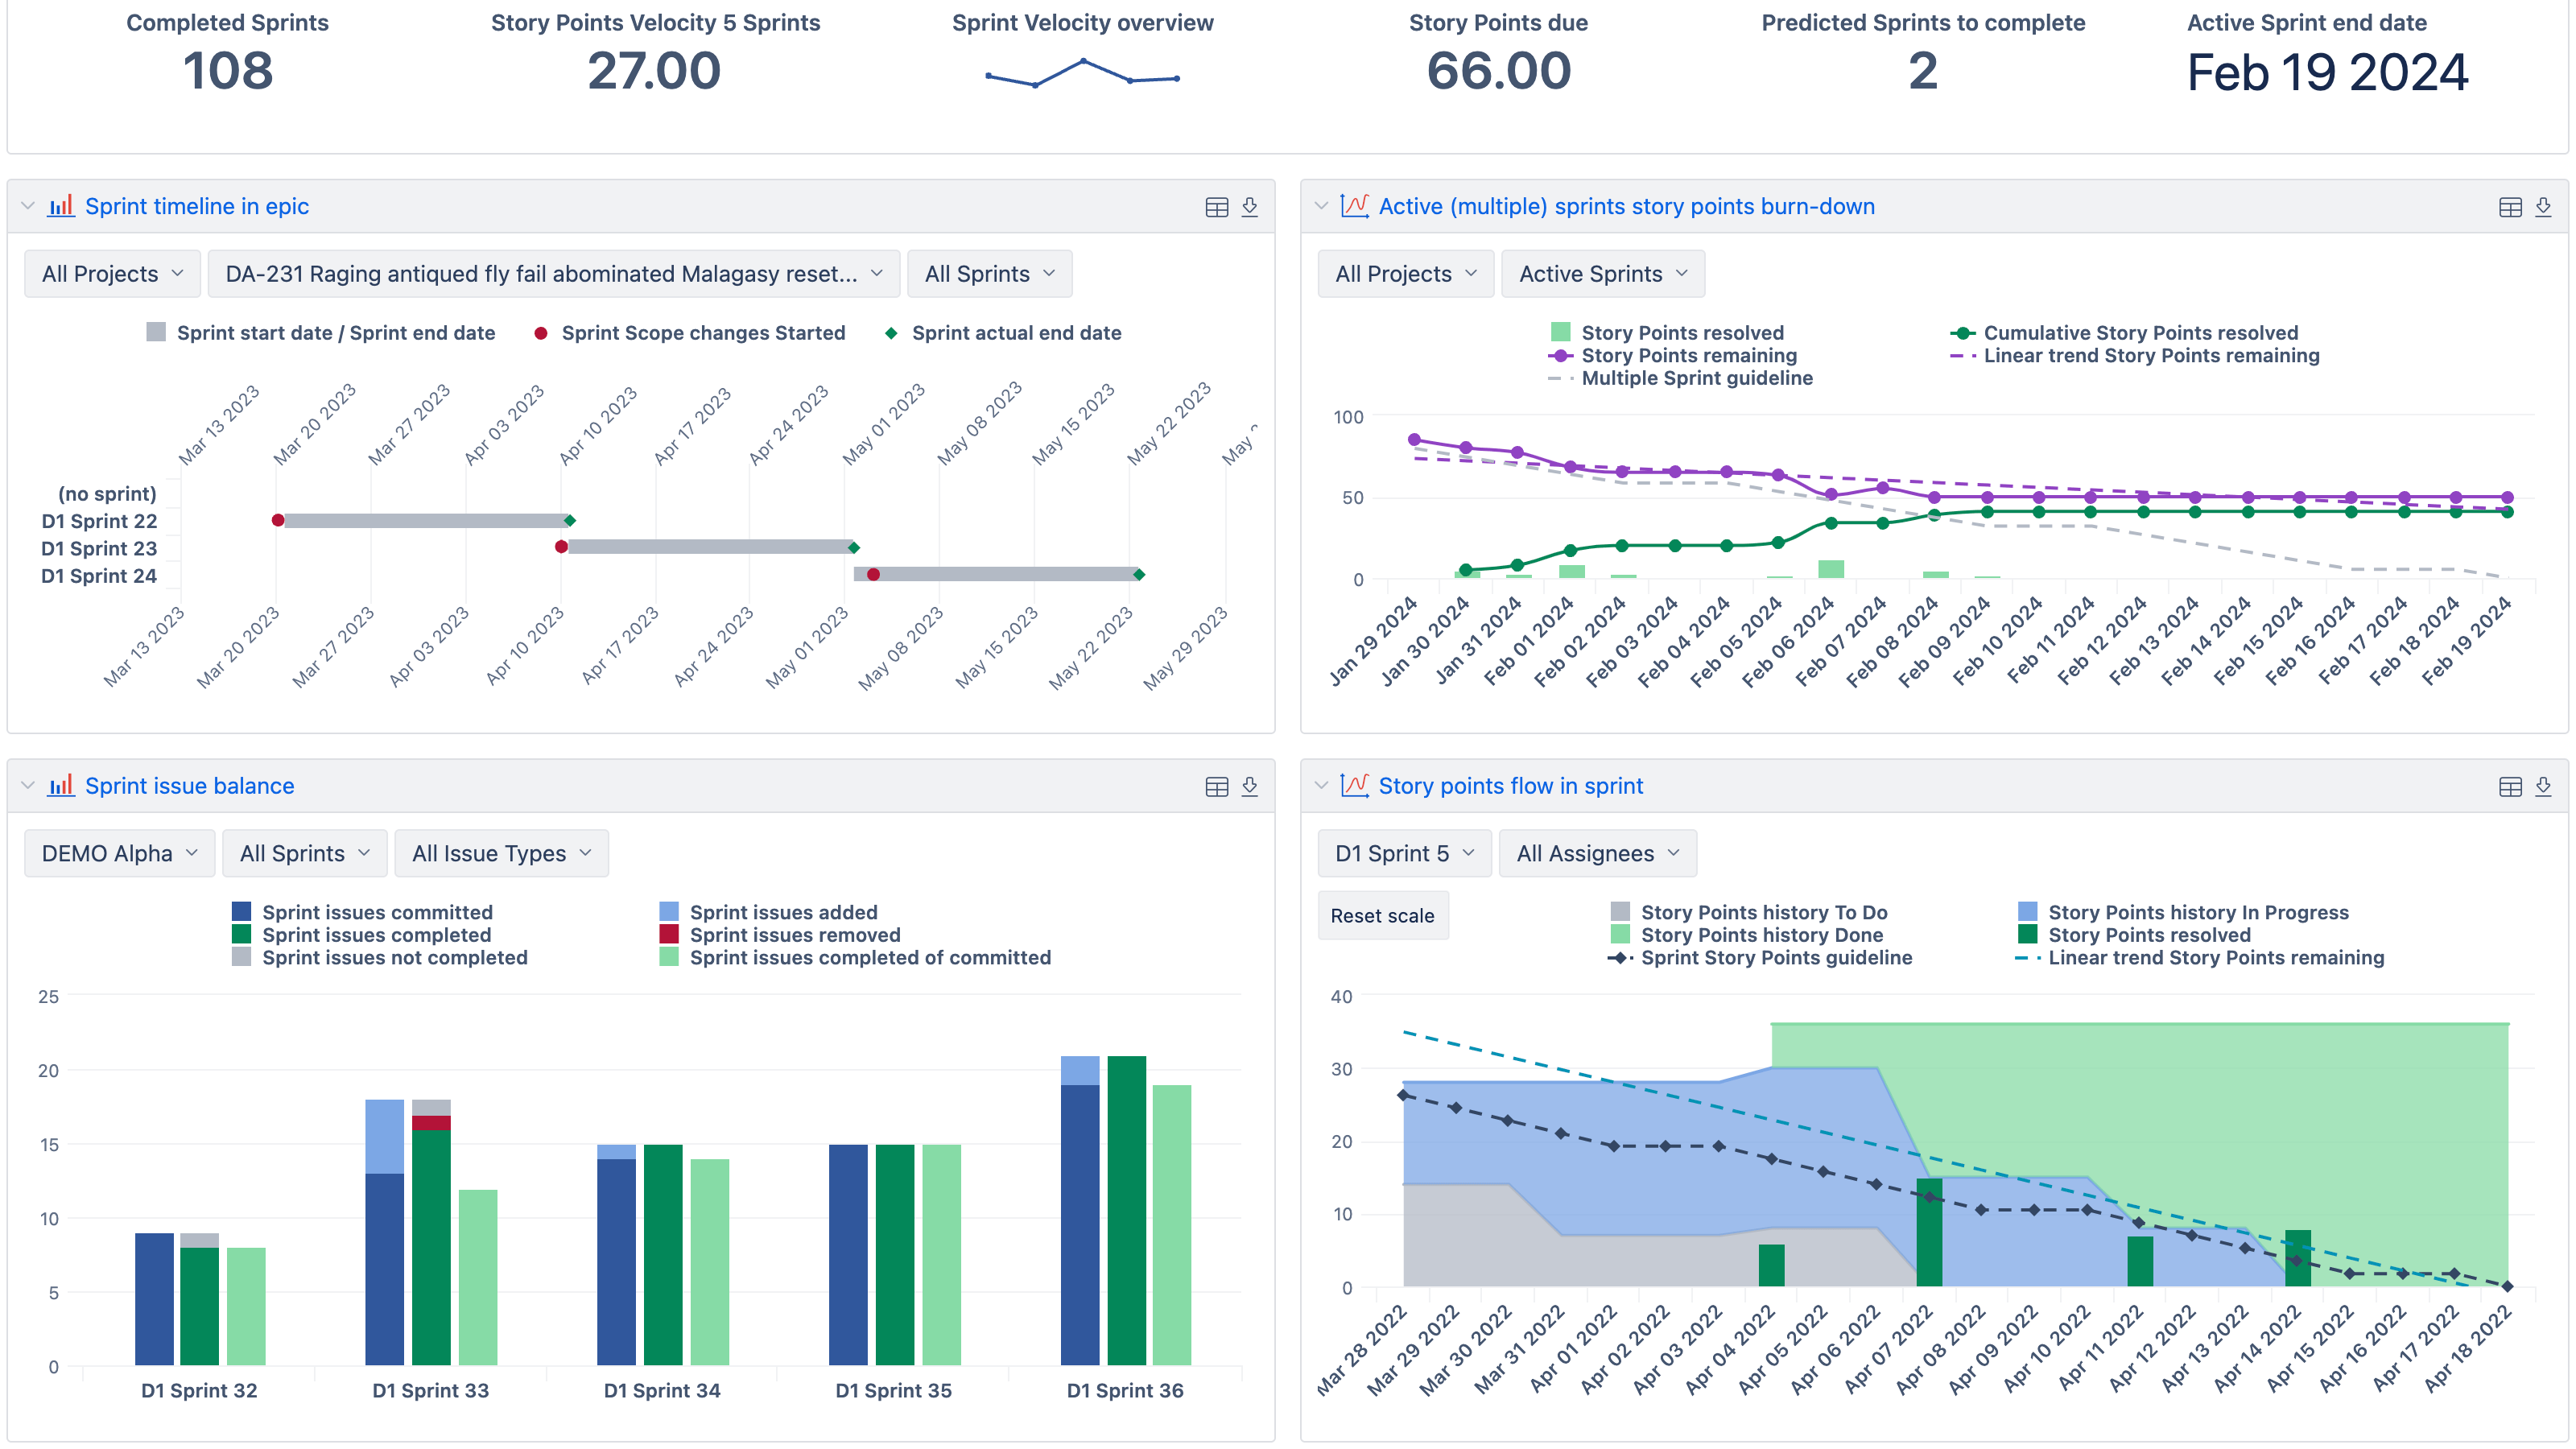
Velocity vs. commitment, scope change, carry-over, and blockers. Useful for planning the next sprint with facts, not guesswork.
Logged vs. estimate by assignee/component/project. Spot over-allocation early and adjust before it turns into delay.
Defects by subsystem/component, reopen rate, and time to resolution. Surface brittle areas and track improvements over time.
Multi-project KPIs, progress vs. plan, and risk indicators. A single view for leads and execs.
Enterprise Ready
Scales with your data and teams. Secure by design, with options that fit cloud-first and on-prem environments.

Security & Compliance
- SOC 2 Type II
- Bug bounty
- Scoped access to your YouTrack data

Scalability & Performance
- Built for large datasets
- Responsive analysis
- No load on YouTrack during reporting

Management
- Granular permission management
- Usage Statistics
- Template Accounts
- Audit log of changes

Support & Onboarding
- Documentation and templates
- Training resources
- Responsive support
Support & Resources
eazyBI’s powerful report builder comes with an extensive knowledge base, a vibrant community, and experienced support.


12000+ Installs, 5000+ Customers from 150+ Countries
Thousands of customers from all around the world use eazyBI for reporting to make better decisions at all levels of management.


eazyBI Cloud Pricing & Plans
Creators
($20 per user)
(€18 per user)
Admins, data importers, report and dashboard creators
Viewers
($5 per user)
(€4.5 per user)
Only report and dashboard viewers
- 200MB storage (per creator)
- Automatic data import at a specified time every day. On-request manual data import available any time.
- Import data from supported data sources and applications.
- Export your charts as PDF or PNG files and chart data as XLSX or CSV files.
- Embed and share your reports using <iframe>.
Starting from 5 creators or 20 viewers
- Embed and share your reports to non-eazyBI users using public access tokens.
- Receive regular dashboard snapshots as PDF attachments in your email.
- Create data access roles to limit user access to report folders, dashboards, or data cubes.
Start a 30-day Free Trial
Try eazyBI free for 30 days to see if it's right for you. If you need any help or support, feel free to reach out to support@eazybi.com—we're there for you.


