
From Broken Velocity Report to Reliable Sprint Billing
Three years ago, Sngular took on one of the most important Data Center to Cloud migrations in Spain: a large energy company with more than 2,000 users, 1,000 projects, and spaces across Europe. eazyBI was among the applications moved to the Cloud for that project. After the migration, Sngular took part in the company's ongoing maintenance services — a relationship that still holds today. That long-running engagement is what made the next problem visible.
Why Don't the Sprint Numbers Match?
The main contact for the company's most important area came with a question about Scrum reporting. The native Jira reports — the velocity report, the burndown — were not telling a consistent story. Comparing the total story points at the beginning of a Sprint with the completed story points at the end produced completely different numbers.
Part of those differences is expected: story points might change during a Sprint, tasks get added to a Sprint, and the totals shift. The harder part is to validate what the total story points actually were at the start of the Sprint. Can the Jira native report give you that answer? Not really.
In Scrum, committed story points are a specific thing, while the native concept counts the total including every modification made during the Sprint. Start a Sprint with one hundred story points, modify those points along the way, and the figure at the end is no longer what was committed. At that point, it stops being a reporting detail and becomes a methodology problem.
The Problem Is the Concept, Not the Performance
In eazyBI, which the customer already had, it turned out to be an out-of-the-box solution that addressed both problems. The Sprint report brings together everything: committed story points, story points added during the Sprint, and the surrounding measures.
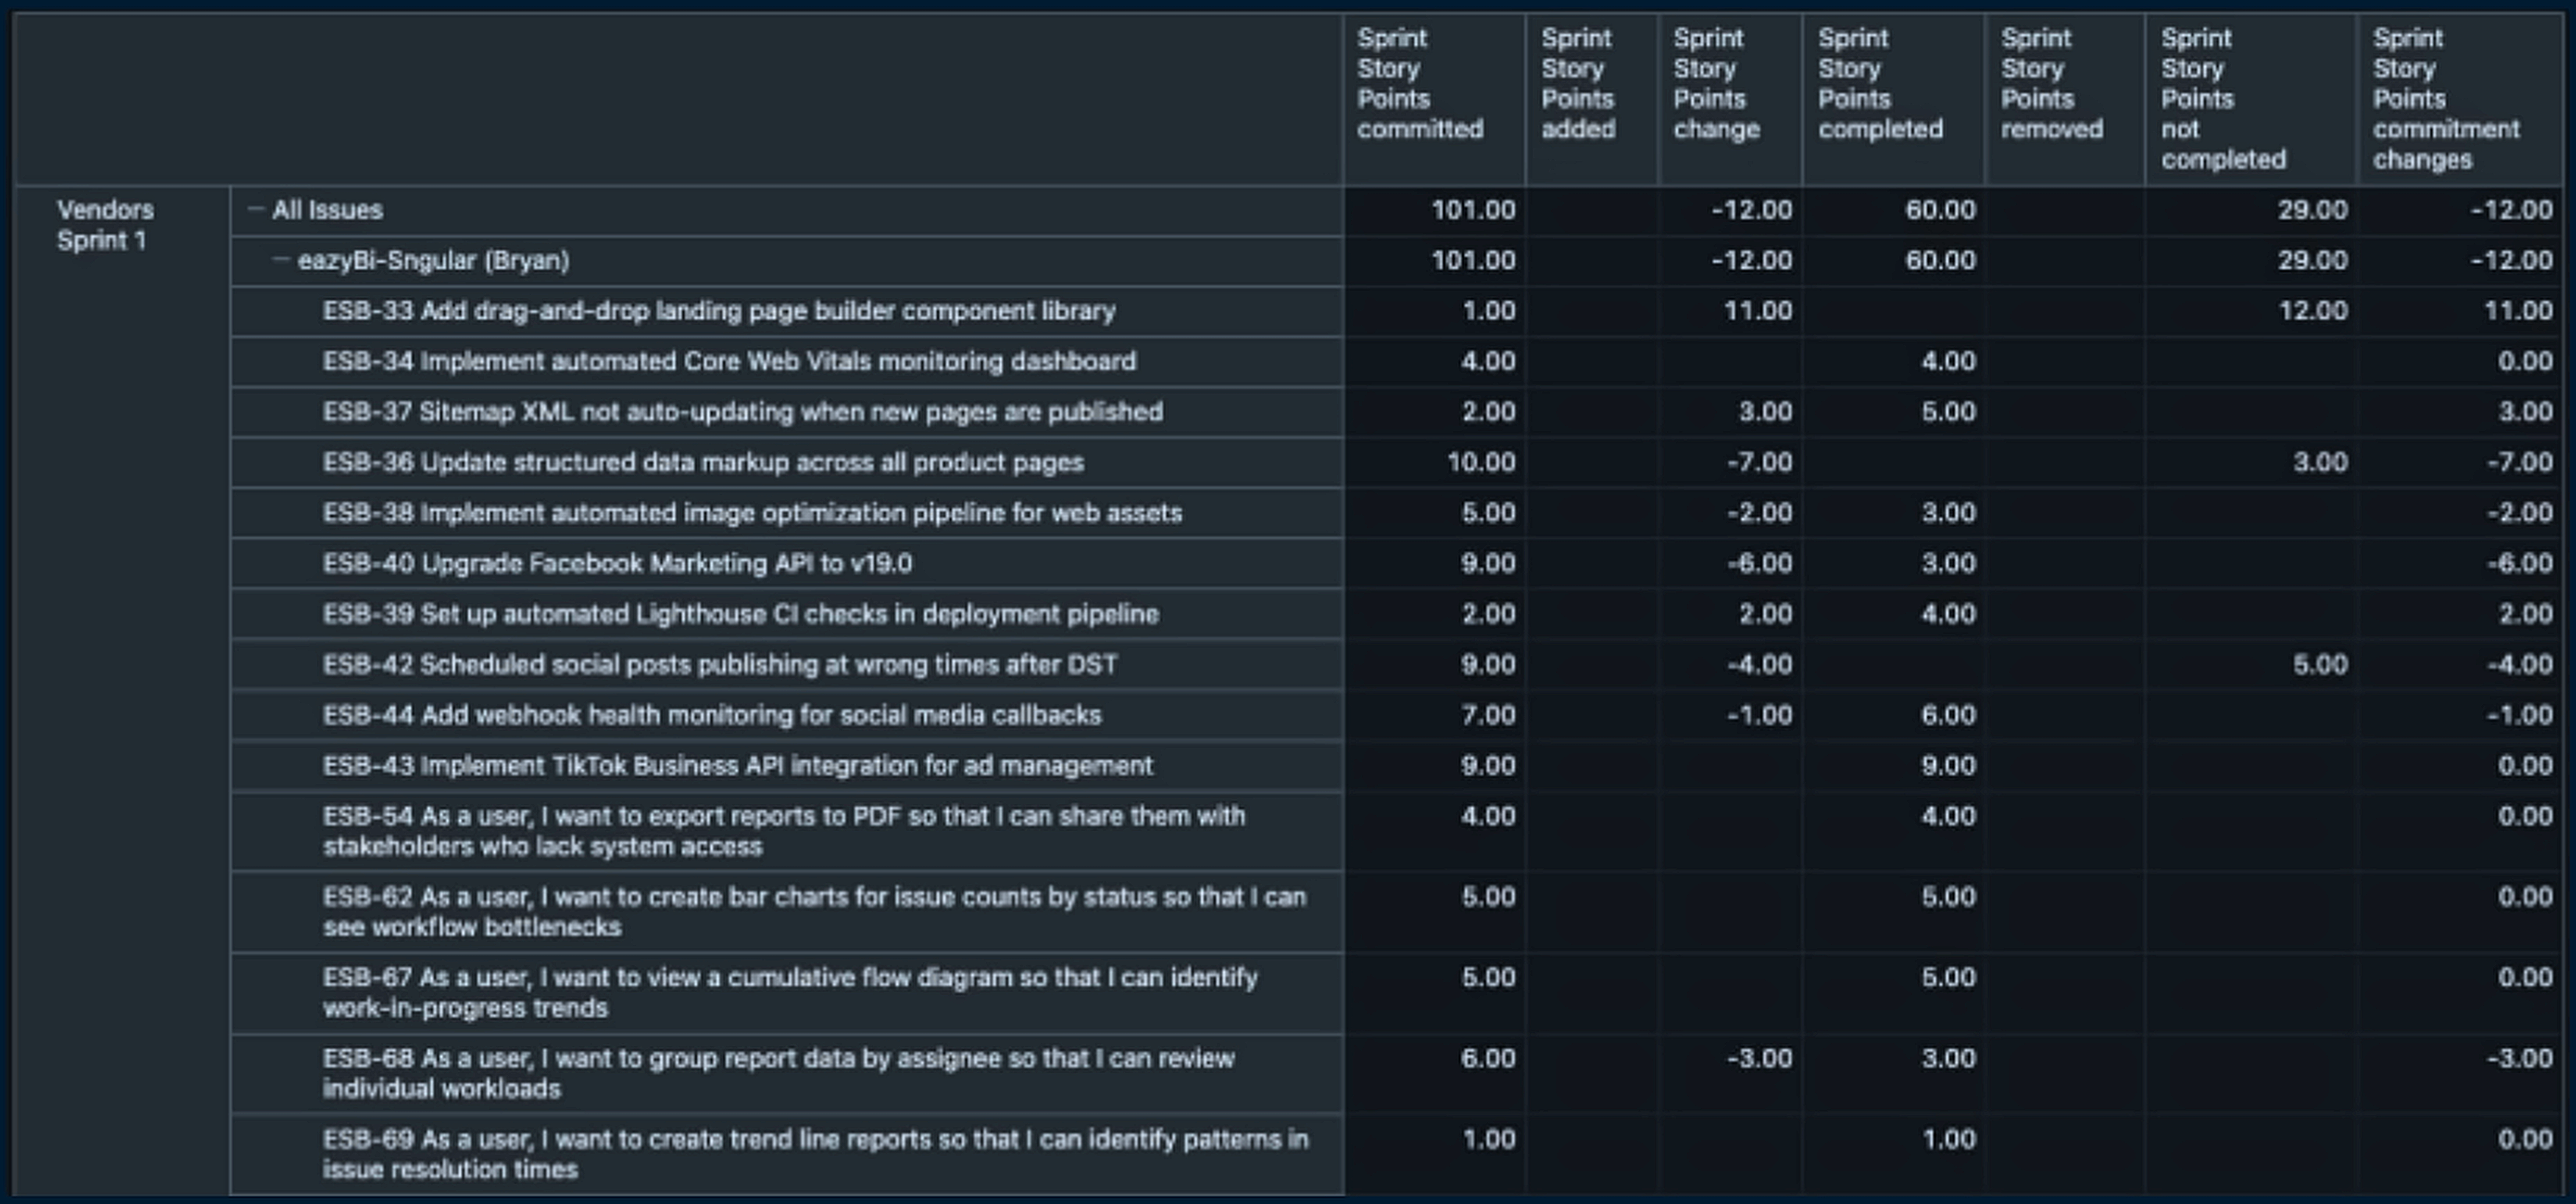
The committed story points in eazyBI are the real committed story points (based on Scrum) — not another strange concept. The customer had a trustworthy number, delivered fast, and the immediate request was answered.
Why Does This Report Matter to the Customer?
A consultant's next question is usually why. Why does this particular report need to exist?
The answer reframed the whole case: the customer used Sprints to calculate how much to pay their vendors based on story points — for every functionality, for products, for models. And it all was handled in Excel.
Spreadsheets at a customer site are often treated as a warning sign. But in many cases it means that the right solution hasn’t been built yet.
In this case, Excel held the vendor rates. A spreadsheet can be manipulated, and that becomes complicated the moment security enters the conversation. Removing Excel from the process became the actual objective.
Jira, Assets, and eazyBI: Replacing the Spreadsheet
The resulting design used three pieces.
Jira stayed because it is where activities are managed and where the teams keep working with Scrum. Assets was added on top because every vendor has a rate — money per story point. A BI tool was needed to replace the spreadsheet and improve the experience, which is where eazyBI came in.
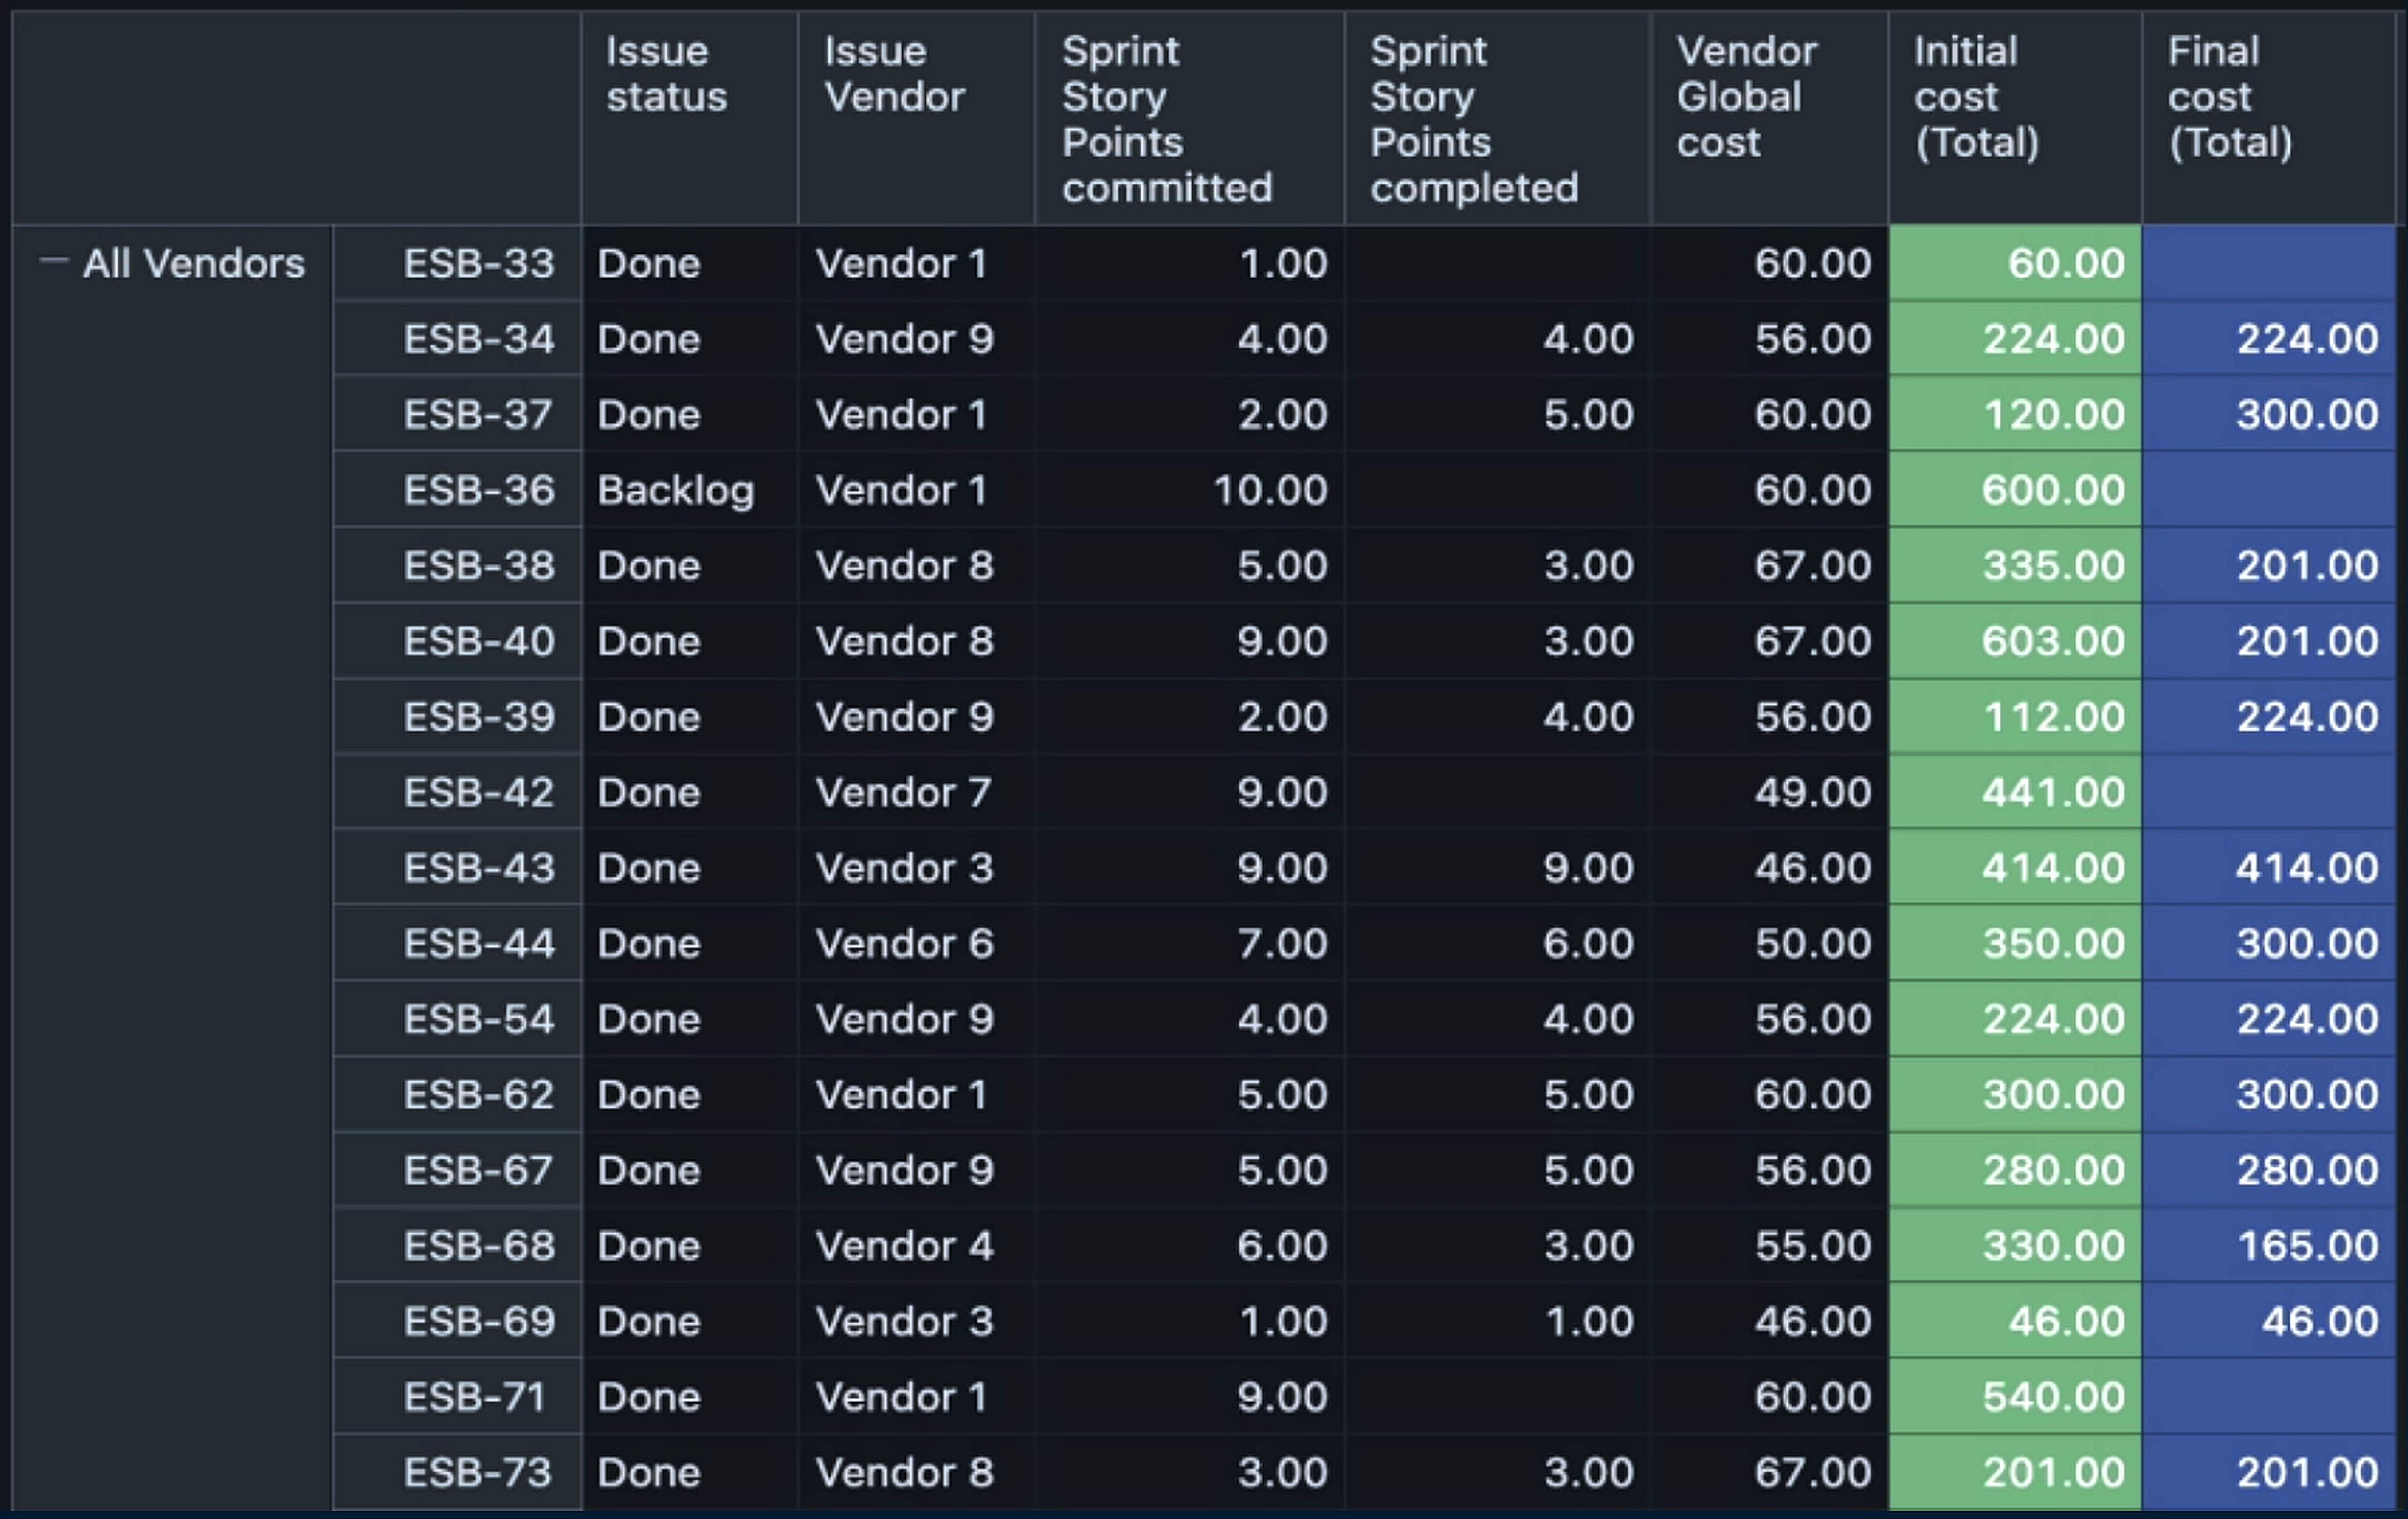
Two measures were added to the same sample report: initial cost and final cost. The calculation behind the first one is straightforward — take the committed story points at the beginning of the Sprint and multiply them by the rate. Final cost is calculated similarly — completed story points multiplied by the vendor rate.
Every vendor has a different rate, so every vendor produces its own cost, and the customer can see what they actually owe.
Vendor Effectiveness and Predictive Reporting
The next measure added was a vendor effectiveness score — the measure that matters most when a project starts moving toward predictive reporting. It looks at the historical changes in a Sprint and uses the rate together with the modifications made during the Sprint to evaluate which vendor is genuinely the best fit for the customer. The company had been working with seven or eight vendors. Today it works with three, and Sngular is one of them.
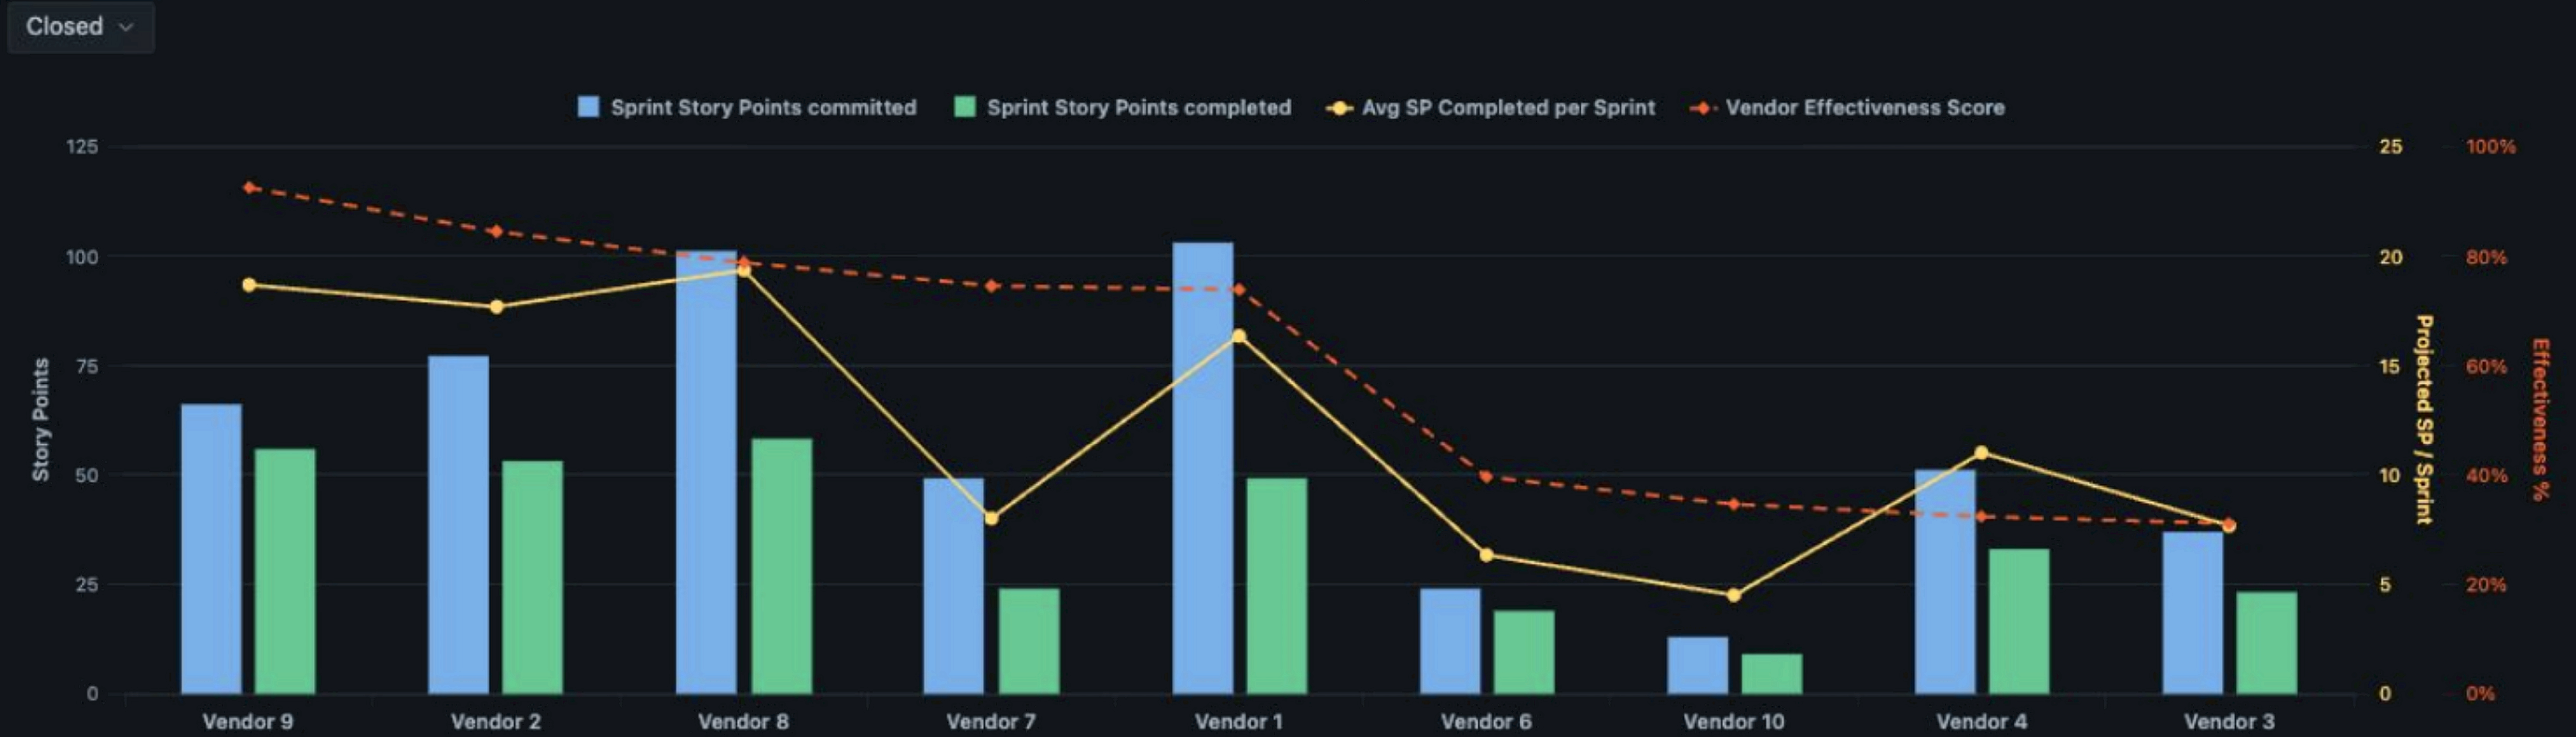
Then comes the forward-looking part. In projects like this one, trying to see the future is the most valuable thing a report can do, and it does not require anything exotic to get there. We don't need to use AI to see the future. We can calculate the possible future with simple arithmetic measures.
In this case, that measure is projected completion: a percentage based on the Scrum board's history.
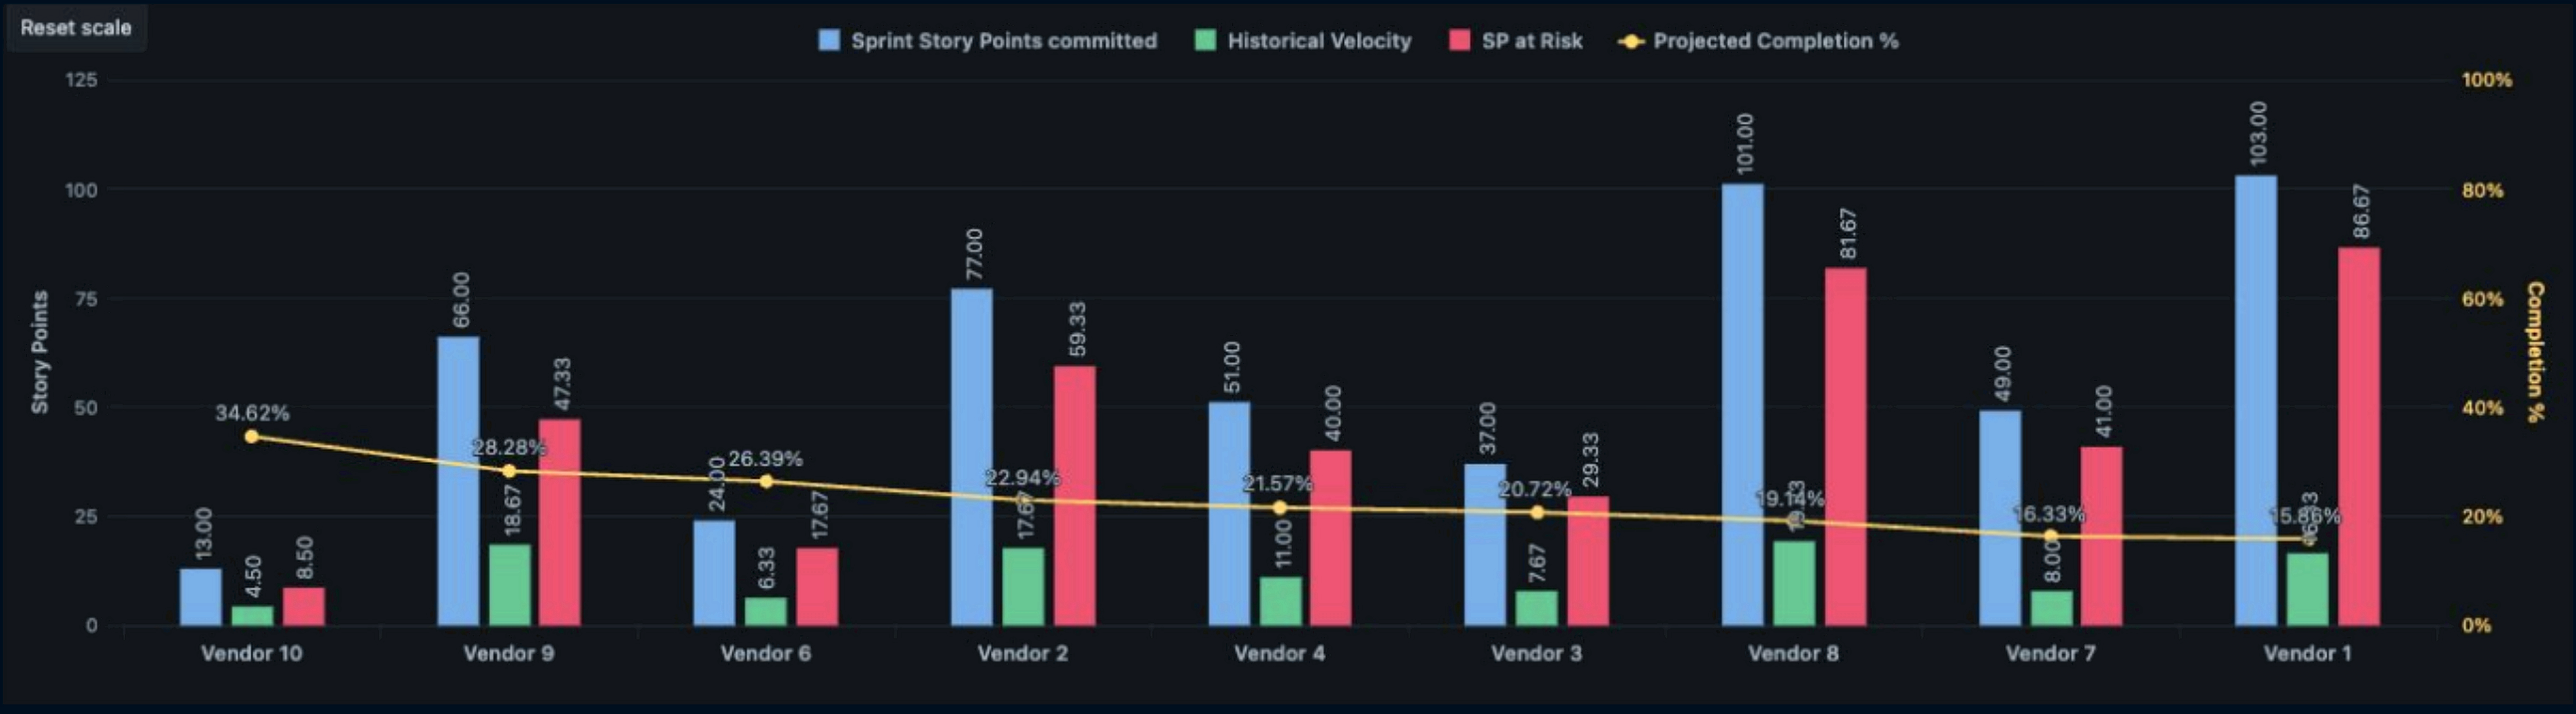
What started as a question about committed story points ended as a solution about money and the future.
Doing It Right Means Making It Easier
That is not always how the work gets framed. But the responsibility is to find the best solution for the customer — and the best solution is the one that makes things easy.
Watch the full presentation recording here.
About Sngular
Top 10 of Atlassian Solution Partners globally. But we're much more than a
Platinum Solution Partner.
As an end-to-end global technology consulting firm, we combine the power of
people and innovation to deliver the unconventional and build long-term
relationships with our customers.
With 50+ successful migrations to Jira Service Management Cloud, Sngular has
built ServiceNext — a proprietary migration framework based on our ITSM and process expertise,
specifically designed for customers of ITSM Platforms like ServiceNow.