
Do I Sleep Better or Worse after Activities?
I have attended the eazyBI Community Days event since it began in 2017, and I have always enjoyed seeing how customers use eazyBI creatively. This year, one of the talks that resonated especially closely with me was a short presentation by my colleague Elita. During the Tips&Tricks session, she shared how she analyzes her running data — what measures she uses, what kind of reports she creates to follow her health, and, as it turned out, to prepare for the half-marathon. She tracks her activities with a Garmin smartwatch, logs main metrics into Google Sheets, and imports them into her eazyBI account to create a dashboard. Impressive. You can watch her talk here.
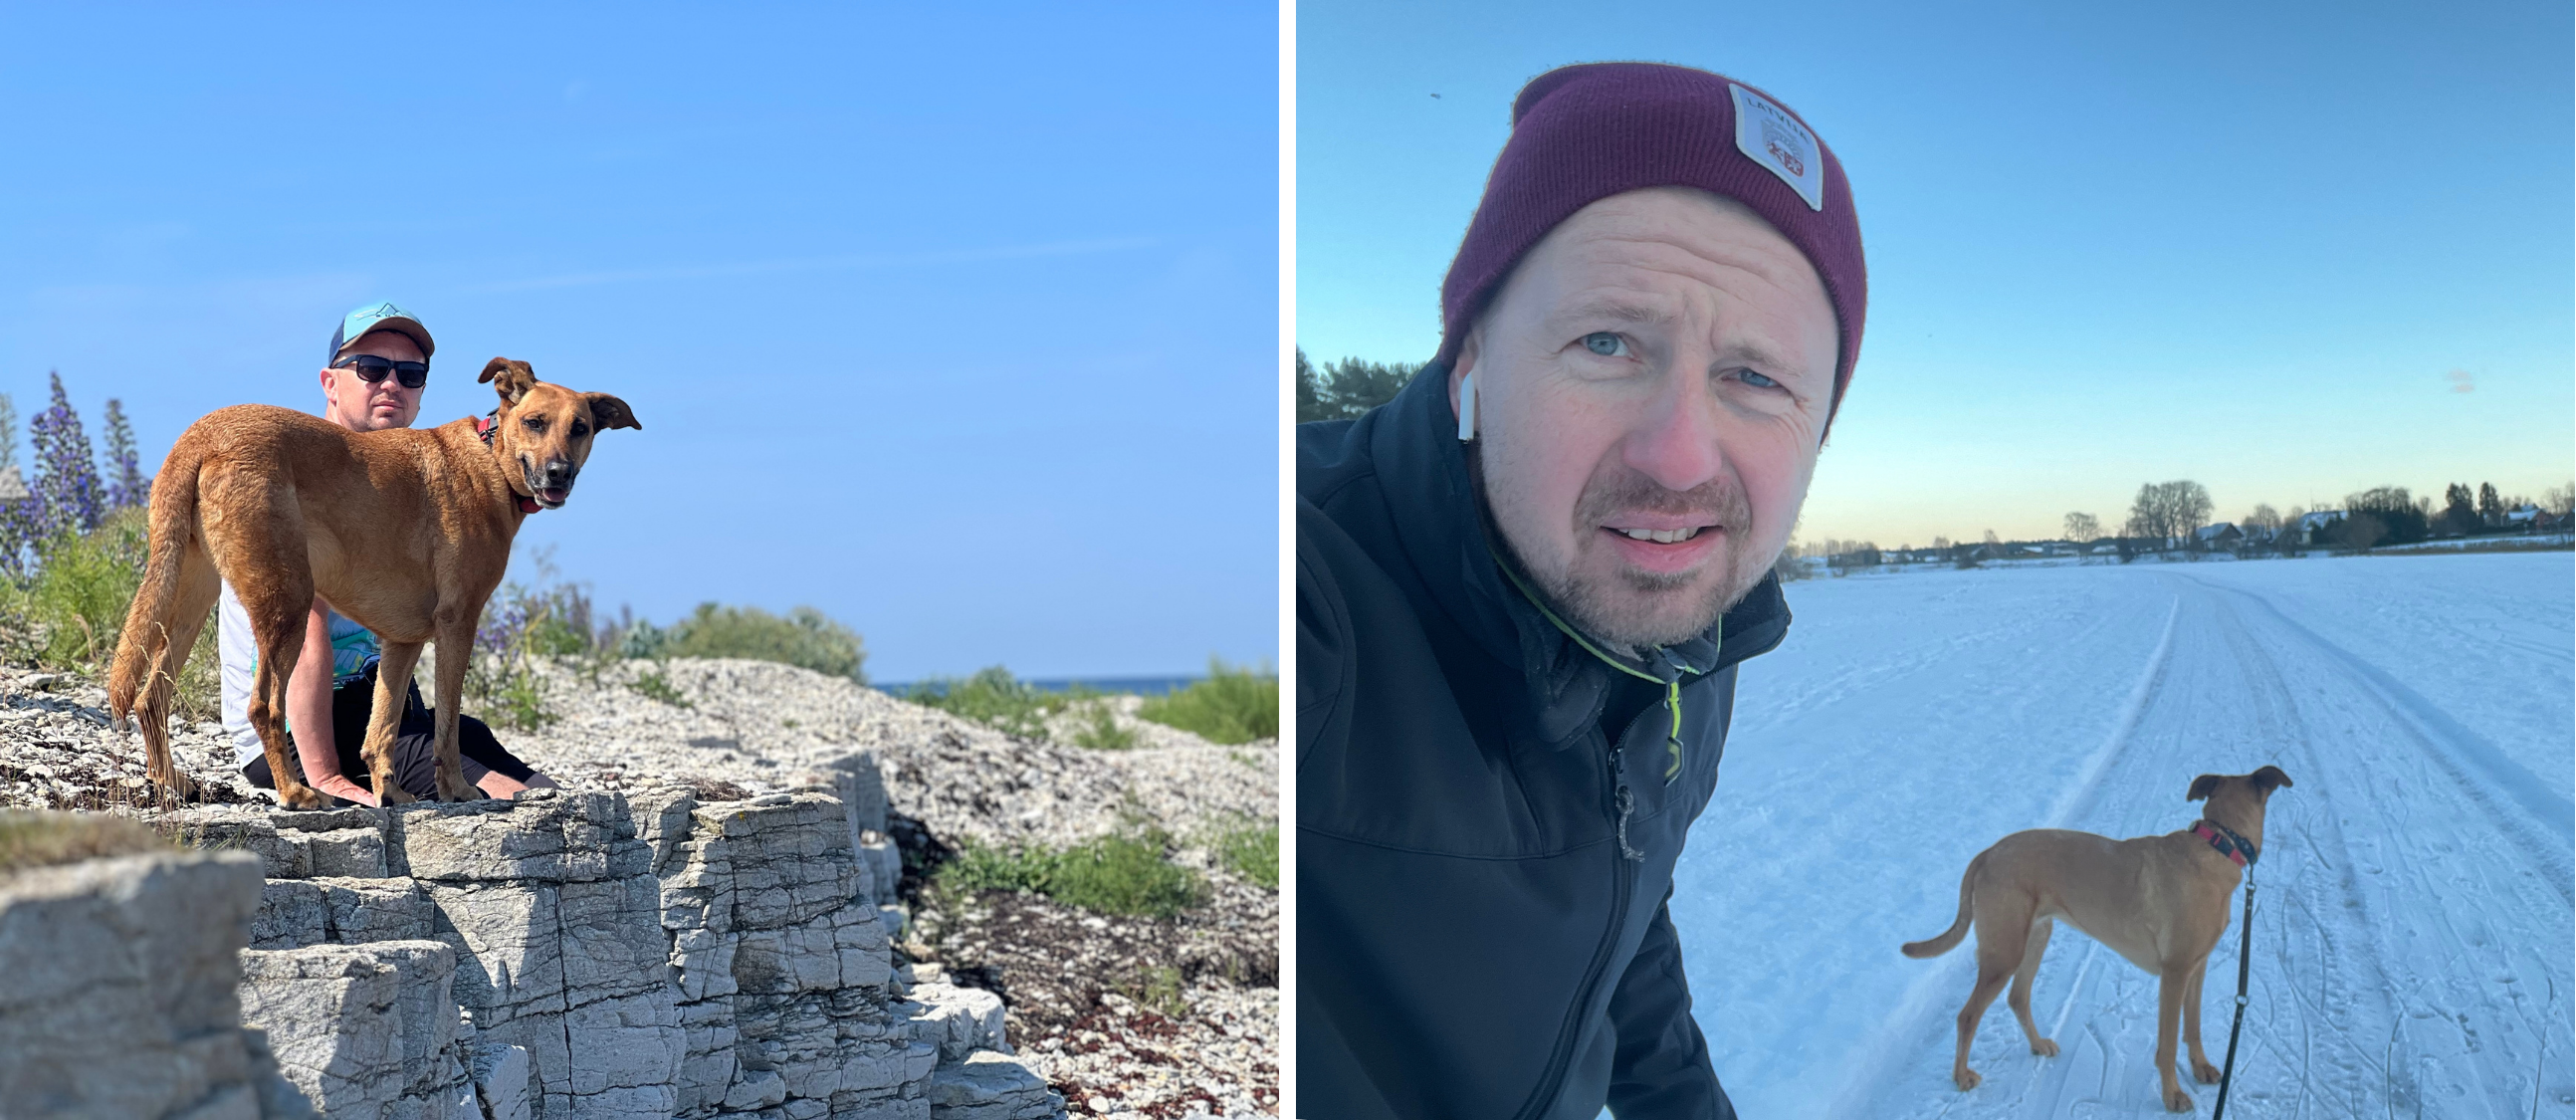
I own a Garmin smartwatch and a dog, Luu (as you will see, an important part of this story). I'm not much of a runner myself, but I do like long walks and hiking. Sometimes I run, but not with the intention of training for some organized running event. And I have access to Claude AI, a MacBook, and an eazyBI account where I'm an admin. So I thought to myself, "Why don't I analyze my Garmin data with eazyBI?”
But I know myself. I would be too lazy to manually input activity data into Google Sheets after every outing. So I sat down the next day after her presentation and started prompting my buddy, Claude AI, to find a more automated way to fetch the data and import it into eazyBI.
Building the Setup
After a conversation with Claude, I now have a Python script running via a Flask app that retrieves Garmin data via REST APIs and imports them into my eazyBI account. I created three REST API source applications — for activity data, steps, and sleep data.
When I want to refresh the data, I start ngrok to expose the local server, trigger an import that fetches the last two weeks of Garmin data, and eazyBI loads only the incremental records that aren't already there. Once the import is done, I shut ngrok down again. Keeping it running continuously felt like an unnecessary security risk on a free plan, so this on-demand approach hits the right balance between convenience and caution.
What the Numbers Actually Show
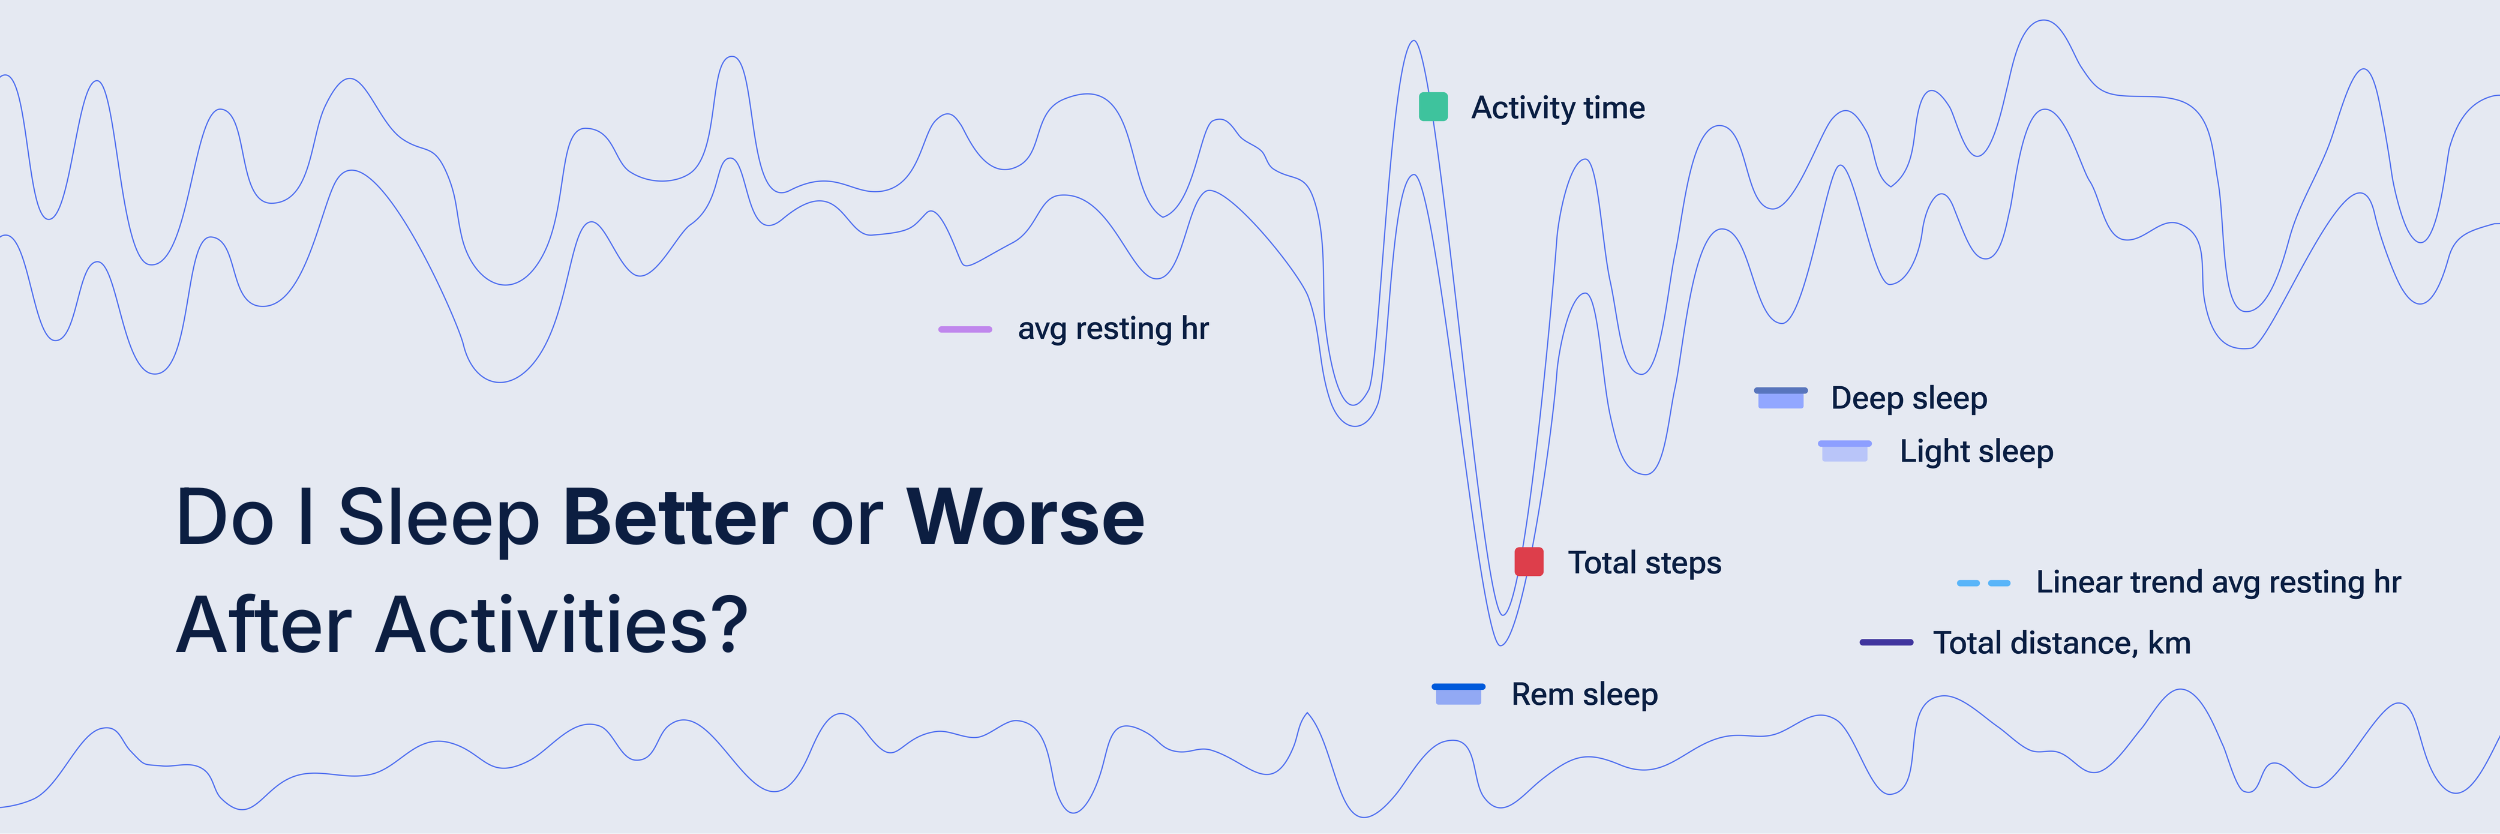
The question I wanted to answer was simple: Do I sleep better or worse after I've been active?
Garmin Connect's own web app has nice charts showing all kinds of metrics from the smartwatch. But I couldn't find a single view that puts total steps alongside sleep phases and resting heart rate, or one that shows activity duration and distance together in the same chart. That's exactly the kind of combined picture that eazyBI makes straightforward to build.
One report I created is exactly the one that answers my question. It overlays total daily steps (red bars) with sleep records (stacked by sleep phase, shown as a blue spline) against the resting heart rate for that night (purple line). The pattern that emerges over twelve weeks is modest but consistent — on higher-step days, resting heart rate tends to drift lower, and the share of deep sleep edges upward.

The second chart tracks daily activity duration against distance covered and the average heart rate during the activity, giving a clearer sense of effort, not only duration, across the same period.

Looking at the dashboard with both charts, I sleep slightly better on days with more activity. The data doesn't lie, even when it's a little inconvenient to admit.
How Do My Activities Look in the Long Term?
I’ve had a Garmin watch for a while, so I can look at my activities over a longer period. I live in Latvia, where outdoor activities mostly take place during the summer, as it gets dark early during autumn and winter. I can see that in the reports, too, when activity duration is longer in periods with more light.
My preferred activities — hiking, cycling, running, or riding my stand-up paddleboard — also appear in the report only during the warm season, except for those during my trips somewhere warmer.

However, you can see me walking consistently year-round. While I like walking, there is one definite motivation to do it regularly — my dog. She is the one who can’t stay indoors even for one day. And so we walk.
Also, when I check my average resting heart rate over the last few years, I see it has been stable and healthy. While I do not have recordings that long ago, I am pretty sure this is because we have been active with Luu daily for almost nine years.
The Setup, Briefly
For anyone curious about replicating this, here is the rough stack:
- Garmin Connect — the data source, accessed via the API
- Python + Flask — a lightweight local script to fetch Garmin data on demand
- ngrok (free plan) — started manually when needed, shut down immediately after import
- eazyBI — three REST API source applications (activity, sleep, and steps), with incremental imports to avoid duplicates and keep the data lean.
The whole thing was built in a single afternoon session with Claude AI doing the heavy lifting on the Python side.
Data shows that I’m OK, and I sleep slightly better after long walks. While I might get older, my heart remains healthy thanks to consistent walking.
How to force yourself to go on long walks? Easy. Get a dog.
Interested in setting up a similar workflow and need some guidance? Write to support@eazybi.com!